XMM-NEWTON OBSERVATIONS OF M31: X-RAY PROPERTIES OF RADIO SOURCES AND SNR CANDIDATES
Abstract
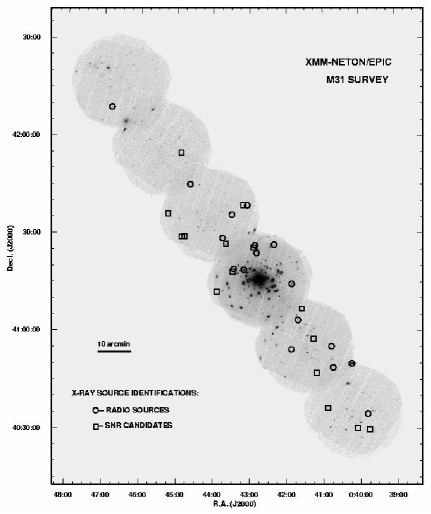
We present the results of the ongoing XMM-Newton Survey of nearby spiral galaxy M31. 17 X-ray sources detected in the survey have bright radio counterparts, and 15 X-ray sources coincide with supernova remnant (SNR) candidates from optical and radio surveys.
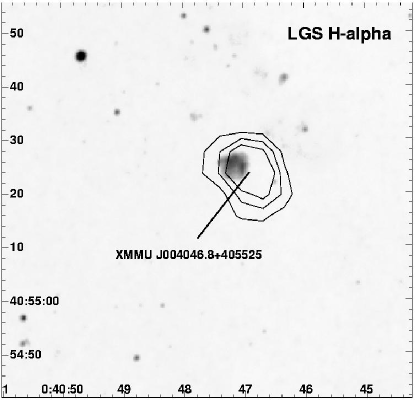
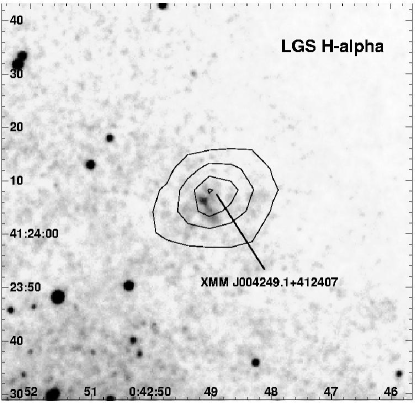
15 out of 17 sources with radio counterparts, not SNR candidates, have spectral properties similar to that observed for background radio galaxies/quasars or Crab-like supernova remnants located in M31. The remaining two sources, XMMU J004046.8+405525 and XMMU J004249.1+412407, have soft X-ray spectra, and are associated with spatially resolved H-alpha emission regions, which makes them two new SNR candidates in M31.
The observed absorbed X-ray luminosities of SNR candidates in our sample range from to ergs s-1, assuming the distance of 760 kpc. Most of the SNR candidates detected in our survey have soft X-ray spectra. The spectra of the brightest sources show presence of emission lines and can be fit by thermal plasma models with keV. The results of spectral fitting of SNR candidates suggest that most of them should be located in a relatively low density regions.
We show that X-ray color-color diagrams can be useful tool for distinguishing between intrinsically hard background radio sources and Crab-like SNR and thermal SNR in M31 with soft spectra.
1 Introduction
The Andromeda Galaxy (M31), the closest giant spiral galaxy to our own, is a unique object for the study of optical and X-ray astronomy. Its proximity and favorable orientation allow to observe stellar populations over the full extent of the galaxy at a nearly uniform distance, and with less severe effects of line-of-sight contamination from interstellar gas and dust. Due to similarities between the two galaxies, the results from the study of M31 provide an important benchmark for comparison with the results from the study of our own Milky Way Galaxy. M31 was observed extensively in X-rays with Einstein, ROSAT, Chandra and XMM missions, detected hundreds of sources, with some bright X-ray sources coincident with radio-emitting sources and SNR candidates from optical surveys. In the extensive ROSAT/PSPC survey of M31 (Supper et al. 2001), 16 X-ray emitting SNR were identified. Recently, Kong et al. (2003) identified two new SNRs using the data of Chandra and VLA observations. Trudolyubov et al. (2004) used XMM-Newton observations to study X-ray spectral properties of the 3 bright thermal SNR in the northern disk of M31.
2 Source identification and classification
Using the data of XMM-Newton survey of M31, we detected about 600 X-ray point sources in the six XMM fields covering major axis of M31. We searched for radio, optical and X-ray counterparts to the XMM sources using the existing catalogs and images from the CTIO/KPNO Local Group Survey (LGS) (Massey et al. 2001). We varied the search radius based on both the accuracy of the catalogs and localization errors of XMM sources (upper limit of 5 arcseconds). We used the following catalogs and corresponding search radii:
Radio sources: VLA All-sky Survey Catalog (Condon et al. 1998) and the lists of Walterbos, Brinks Shane (1985) and Braun (1990) – 5 arcsecond search radius. 17 X-ray sources were found to coincide with radio sources.
Supernova remnant candidates: the lists by Braun & Walterbos (1993) and Magnier et al. (1995) – 10 arcsecond search radius. 15 X-ray sources have SNR counterparts in M31.
X-ray sources: the ROSAT/PSPC catalog of sources in the field of M31 (Supper et al. 2001) – search radius specified by position accuracy for each individual source.
The information on the positions and identifications of the X-ray sources coincident with radio sources and SNR candidates is shown in Tables 1 and 2. The XMM/EPIC X-ray images of M31 with source positions marked are shown in Fig. 1.
| Source Name | Fluxa | Radio/X-ray IDb |
|---|---|---|
| XMMU J00… | ||
| 3948.2+403436 | 37W42 | |
| 4013.9+405004 | 37W51 | |
| SHP67 | ||
| BL Lac | ||
| 4044.0+404853 | 37W63 | |
| SHP90 | ||
| 4046.8+405525 | 37W64 | |
| SHP94 | ||
| SNR? | ||
| 4141.2+410331 | 37W91 | |
| SHP119 | ||
| 4151.4+411439 | 37W95 | |
| SHP132 | ||
| 4152.0+405429 | 37W97 | |
| 4220.2+412641 | 37W116 | |
| RX J0042.3+4126 | ||
| 4249.1+412407 | 37W140 | |
| SNR? | ||
| 4251.4+412633 | 37W144 | |
| 4304.1+413848 | 37W150 | |
| 4309.8+411900 | 37W153 | |
| SHP226 | ||
| Highly variable | ||
| 4326.2+411912 | 37W158B | |
| 4329.3+413554 | 37W159 | |
| 4344.6+412843 | 37W169 | |
| 4437.8+414513 | 37W194 | |
| 4648.0+420852 | 37W235 | |
| SHP353 |
-
a – Source X-ray flux in the keV energy band in units of ergs s-1 cm-2
-
b – Source identifications beginning with 37W refer to the radio sources listed in Walterbos, Brinks Shane (1985). Identifications beginning with SHP refer to entries from ROSAT/PSPC catalog of X-ray sources in M31 by Supper et al. (2001).
| Source Name | (0.3-10 keV) | Identificationb |
|---|---|---|
| XMMU J00… | ergs s-1 | |
| 3945.1+402950 | MA 1-001 | |
| 4005.1+403017 | MA 2-002 | |
| 4052.5+403626 | MA 3-027 | |
| 4110.6+404716 | MA 2-013 | |
| 4115.6+405741 | MA 2-016 | |
| 4134.8+410659 | BW53 | |
| 4253.6+412551 | BW55 | |
| 4310.6+413853 | BW6 | |
| 4327.9+411828 | BW56,MA 2-043 | |
| 4339.1+412655 | BW57,MA 3-069 | |
| 4353.7+411206 | BW9 | |
| 4447.1+412917 | BW29 | |
| 4451.1+412907 | BW33 | |
| 4452.7+415457 | BW34 | |
| 4514.0+413614 | BW39,MA 2-048 |
-
a – X-ray luminosity of the source assuming a distance of 760 kpc.
-
b – Source identifications beginning with BW refer to the SNR candidates listed in Braun Walterbos (1993). Identifications beginning with MA refer to the SNR candidates from Magnier et al. (1995).
3 Radio Sources
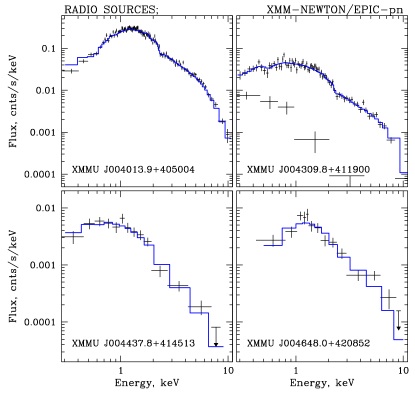
17 bright XMM sources not identified as SNR candidates coincide with bright radio sources detected with VLA all-sky (Condon et al. 1998) and earlier surveys (Walterbos, Brinks Shane 1985; Braun 1990). 15 out of 17 sources with radio counterparts have spectral properties similar to that observed for background radio galaxies/quasars and Crab-like SNR in M31. The brightest objects have X-ray spectra well presented by absorbed power laws with indices between and , typical for this source class (Table 3; Fig. 2). For majority of bright radio sources the corresponding values of the interstellar absorption inferred from their X-ray spectra are well above expected Galactic value in the direction of M31 (Dickey Lockman 1990), supporting their identification with objects in the background of M31.
Two XMM sources, identified with radio-emitting objects, have soft X-ray spectra. The X-ray spectrum of the first source, XMMU J004309.8+411900, can be well fit to the absorbed Raymond-Smith (RS) thermal plasma emission model with keV. The corresponding absorbed source luminosity in the keV energy band is ergs s-1 assuming the distance of 760 kpc. The other source, XMMU J004249.1+412407, has a spectrum well approximated by the absorbed RS model with keV and luminosity of ergs s-1 in the keV energy range. The inspection of the optical LGS images of M31 revealed two spatially resolved Hα emission regions, coincident with these two X-ray sources (Fig. 3, 4). The combination of the soft thermal X-ray spectra, extended Hα and bright radio counterparts allows to propose XMMU J004309.8+411900 and XMMU J004249.1+412407 as a new SNR candidates in M31.
| Source Name | Photon | N | Fluxb |
|---|---|---|---|
| XMMU J00… | Index | ||
| 4013.9+405004 | |||
| 4141.2+410331 | |||
| 4151.4+411439 | |||
| 4309.8+411900 | |||
| 4437.8+414513 | |||
| 4648.0+420852 |
-
a – Equivalent hydrogen absorbing column in units of cm-2.
-
b – Source X-ray flux in the keV energy band in units of ergs s-1 cm-2
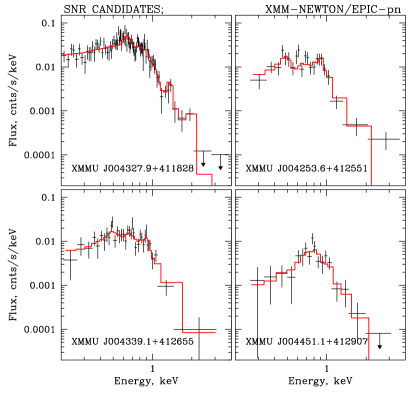
4 Supernova Remnant Candidates
15 XMM sources detected in M31 fields were identified with SNR candidates from optical surveys (Braun Walterbos 1993; Magnier et al. 1995). Most of these sources were previously detected with ROSAT and identified as SNR (Supper et al. 2001; Magnier et al. 1997).
All relatively bright SNR candidates have relatively soft X-ray spectra (Fig. 5). We fitted the spectra of SNR candidates with various single component spectral models including a simple power law, thermal bremsstrahlung, black body, RS thermal plasma, and non-equilibrium ionization collisional plasma (NEI) models with interstellar absorption. RS models with characteristic temperatures of keV and NEI models with temperatures of keV give the best approximation to the data for 6 bright SNR candidate sources (Fig. 5). The absorbed X-ray luminosities of SNR candidates range from to ergs s-1 assuming the distance of 760 kpc. The estimated ages of SNR range from to years and the number density of ambient gas is cm-3, suggesting that these SNR may be located in a relatively low density regions. The X-ray measured chemical abundances were found to be similar to their optically determined values (Blair, Kirshner & Chevalier 1982).
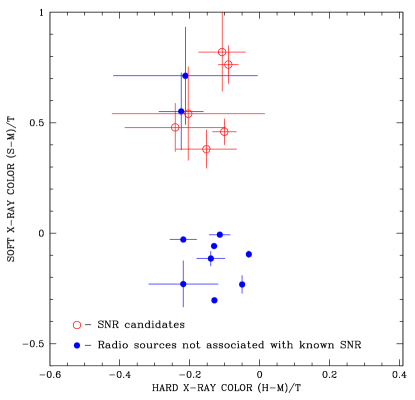
5 X-ray Color-color Diagram
In order to facilitate comparison between spectral properties of the radio sources and SNR candidates detected in our survey , we constructed their X-ray color-color diagram. We calculated the total number of counts for each source using its corrected EPIC-pn spectra in three energy bands: the soft band ( keV), medium band ( keV) and hard band ( keV). Two X-ray colors were defined for each source as: (soft color) and (hard color), where and are the counts in soft, medium and hard bands respectively, and is the total number of source counts in the keV energy range. We used the data for 16 brightest (10 radio sources and 6 SNR candidates) sources, each of which provided more than 50 counts in EPIC-pn.
Fig. 6 shows the X-ray color-color diagram for the bright X-ray sources identified with radio sources and SNR candidates. There are two distinct concentrations of sources in this diagram. The first group with includes intrinsically soft sources: bright thermal SNR and two radio sources, XMMU J004046.8+405525 and XMMU J004249.1+412407. The second group includes harder radio sources. The
X-ray color-color diagrams show that they can be useful tool for distinguishing between sources with intrinsically soft and hard spectra like thermal SNR and background radio sources. On the other hand, this method shows no difference between Crab-like SNR and background radio sources. The combination of low-energy absorption and limited instrument bandpass also have significant effect on the source position on the color-color diagram (Di Stefano Kong 2003). For example, the source with intrinsically soft spectrum, if highly absorbed, can easily “migrate” to the region on the color diagram normally occupied by sources with much harder spectra. Therefore, additional information, such as X-ray variability, luminosity and source counterparts at other wavelengths, is needed to classify the X-ray source.
6 Summary
Nearly 600 X-ray sources were detected in the ongoing XMM-Newton survey of M31. 17 of them have bright radio counterparts not identified with SNR candidates, and 15 sources coincide with SNR candidates from radio and optical surveys.
15 out of 17 sources with radio counterparts, not known to be SNR candidates from optical surveys, have spectral properties similar to that observed for background radio galaxies/quasars or Crab-like supernova remnants located in M31. The energy spectra of the brightest objects are well represented by absorbed power law with photon indices between and , and low-energy absorption in excess of the Galactic foreground value in the direction of M31. The remaining two sources, XMMU J004046.8+405525 and XMMU J004249.1+412407, have soft X-ray spectra, and are associated with spatially resolved H-alpha emission regions, which makes them two new SNR candidates in M31.
Most of the SNR candidates detected in our survey have soft X-ray spectra. The spectra of the brightest sources show presence of emission lines and can be fit by thermal plasma models with keV. The observed absorbed X-ray luminosities of our SNR candidates range from to ergs s-1, assuming the distance of 760 kpc. The results of spectral fitting suggest that most of the bright SNR candidates in our sample may be located in the low density regions.
We show that X-ray color-color diagrams can be useful tool for distinguishing between intrinsically hard background radio sources and Crab-like SNR and thermal SNR in M31.
Acknowledgments
Support for this work was provided through NASA XMM Grant NAG5-12390. XMM-Newton is an ESA Science Mission with instruments and contributions directly funded by ESA Member states and the USA (NASA). This research has made use of data obtained through the High Energy Astrophysics Science Archive Research Center Online Service, provided by the NASA/Goddard Space Flight Center.
References
- Blair, Kirshner & Chevalier (1982) Blair, W.P., Kirshner, R.P., & Chevalier, R.A. 1982, ApJ, 254, 50
- Braun (1990) Braun, R. 1990, A&AS, 72, 761
- Braun & Walterbos (1993) Braun, R., & Walterbos, R.A.M. 1993, A&AS, 98, 327
- Condon et al. (1998) Condon, J.J., Cotton, W. D., Greisen, E.W., Yin, Q.F., Perley, R.A., Taylor, G.B., & Broderick, J.J. 1998, AJ, 115, 1693
- Dickey & Lockman (1990) Dickey, J.M., & Lockman F.J. 1990, ARA&A, 28, 215
- Di Stefano & Kong (2003) Di Stefano, R., & Kong, A.K.H. 2003, ApJ, 592, 884
- Gelfand et al. (2004) Gelfand, Y., Lazio, J., & Gaensler, B. 2004, in “X-ray and Radio Connections”, eds. Sjouwerman, L.O. & Dyer, K.K., Published electronically at http://www.aoc.nrao.edu/events/xraydio
- Kong et al. (2003) Kong, A. K. H., Sjouwerman, L. O., Williams, B. F., Garcia, M. R., Dickel, J. R. 2003, ApJ, 590, 21
- Magnier et al. (1995) Magnier, E.A., Prins, S., van Paradijs, J., Lewin, W.H.G., Supper, R., Hasinger, G., Pietsch, W., & Truemper, J. 1995, A&AS, 114, 215
- Magnier et al. (1997) Magnier, E. A., Primini, F. A., Prins, S., van Paradijs, J., & Lewin, W. H. G. 1997, ApJ, 490, 649
- Massey et al. (2001) Massey. P., Hodge, P. W., Holmes, S., Jacoby, G., King, N. L., Olsen, K., Saha, A., & Smith, C. 2001, in American Astronomical Society Meeting, 199, 1305
- Supper et al. (2001) Supper, R., Hasinger, G., Lewin, W.H.G., Magnier, E.A., van Paradijs, J., Pietsch, W., Read, A.M. & Truemper, J. 2001, A&A, 373, 63
- Trudolyubov et al. (2004) Trudolyubov, S., Kotov, O., Priedhorsky, W., Cordova, F., & Mason, K. 2004, ApJ, submitted (astro-ph/0401227)
- Walterbos, Brinks & Shane (1985) Walterbos, R.A.M., Brinks, E., Shane, W.W. 1985, A&AS, 61, 451