The oxygen abundance gradient in M101: the reliability of the method
We present the oxygen abundance determination for 90 H ii regions in the inner parts of the grand design galaxy M101. The abundances were derived employing the method (Pilyugin 2001a). A comparison is made with previous determinations using another calibration and direct measurements of electron temperature to derive the oxygen abundance. The results show agreement with the abundances derived from the electron temperature method and also show that the older calibration is not as accurate as the method.
Key Words.:
H ii regions – Galaxies: individual: NGC 5457 – Galaxies: abundances1 Introduction
The determination of oxygen abundance is a critical stage prior to deriving the value for the metallicity in galaxies and the equivalent abundances for several other elements, such as sulfur, nitrogen or argon. The preferred method for determining the oxygen abundance in galaxies using H ii regions is through electron temperature-sensitive lines (the so-called method), such as the [O iii]4363 or [O iii]7325 auroral lines (Searle 1971; Rosa 1981; Garnett & Kennicutt 1994; Kennicutt et al. 2003). However, these lines are not always available: for oxygen-rich regions, the oxygen line [O iii]4363 is weak and difficult to detect, so there are not many direct abundance determinations from the inner parts of galaxies.
Other methods are based on “empirical” calibrations of metallicity employing strong-line abundance estimators. These methods are based on direct measurements of the electronic temperature of low metallicity regions and in theoretical models for high metallicity regions. One method with widespread acceptance and use is the -method, suggested by Pagel et al. (1979). It is based in the oxygen line ratio, . There are different calibrations using the ratio, such as those of Dopita & Evans (1986), Edmunds & Pagel (1984), McCall et al. (1985), McGaugh (1991) or Zaritsky et al. (1994). However, this indicator presents one great disadvantage: the derived abundances depend strongly on the -O /H calibration (Kewley & Dopita 2002; Cedrés 2003).
Moreover, for M101 Kennicutt et al. (2003) have recently found systematic differences up to a factor 3 between abundances derived from some empirical calibrations and those derived from the direct method, the latter being lower.
Smartt et al. (2001) and Trundle et al. (2002) have shown that in the Local Group spiral galaxy M31 oxygen abundances of B supergiant atmospheres are also systematically lower than those obtained by classical -O /H calibrations. However, Monteverde et al. (2000) found very good agreement between B supergiant abundances (obtained in a similar way as in the aforementioned references) and the abundances derived from the method in the interstellar medium in M33. Thus, it is clear that more comparisons are required.
New methods for abundance determinations using strong lines have been developed recently. These methods achieve a better approximation to the results obtained with the method. One of these new calibrations, the method, is proposed by Pilyugin (2001a, 2001b).
In this paper we present an estimate of the oxygen abundance for the inner H ii regions of M101 using the method with data from direct imaging observations, which give us a larger number of regions when compared with spectroscopic methods, these allowing better sampling of the disc both spatially and in H ii region luminosity, and with less telescope time.
2 Data
The data have been taken from Cedrés & Cepa (2002). These data were obtained using the direct imaging method through narrow band filters. The observational methods and the reduction and calibration processes are described in Cedrés & Cepa (2002). All the regions are extinction-corrected and the H line is also corrected for underlying absorption (Cedrés & Cepa 2002). For the total sample of 338 regions, we selected regions with data in [O ii]3727,3729 and [O iii]4959,5007, where we assumed that [O iii]4959,5007 = 1.34[O iii]5007, because for our observations there were only filters available for the [O iii]5007 line. After the determination of the value of the oxygen abundance, we rejected those regions with an error in the determination of the oxygen abundance larger than 0.23 dex. These errors were determinated from the propagation of the uncertainties in the line strengths. We obtained a total of 90 H ii regions with , where is the disc isophotal diameter ( arcmin 32.4 kpc; de Vaucouleurs et al. 1991). We selected only the inner parts of the galaxy and regions with 12 + log(O/H) 8.4 for two reasons: to avoid the problem caused by a systematic change in the slope of the gradient with strong line determinations of the abundance (Kennicutt et al. 2003), and to be sure that all the regions were in the high metallicity regime, thus avoiding uncertainties due to the low metallicity branch of Pilyugin’s (2001a) calibration. Our cut off is approximately 0.2 dex over the limit indicated by Pilyugin (2001a). In Table 3 111Table 3 is only available in electronic form at the CDS via anonymous ftp to cdsarc.u-strasbg.fr (130.79.128.5) are listed the results for all the regions. The first column is the region identification number from Cedrés & Cepa (2002): the second column is the oxygen abundance.
3 Results
The oxygen abundance was derived using the method proposed by Pilyugin (2001a,b), using the following expression:
| (1) |
where
| (2) |
and
| (3) |
This calibration is valid in moderately high-metallicity H ii regions (Pilyugin 2001a).
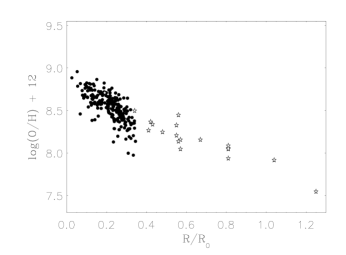
In Figure 1 we represent the oxygen abundance versus the galactocentric radius divided by , for all the regions with data in [O ii] and [O iii] from Cedrés & Cepa (2002). The change in slope (compared to the data for ) is clear in Figure 1, as noted in Kennicutt et al. (2003), so it is not advisable to use this calibration for the outer, lower metallicity, parts of the galaxy. This behaviour is also observed (but with fewer regions) for this galaxy in Pilyugin (2001b).
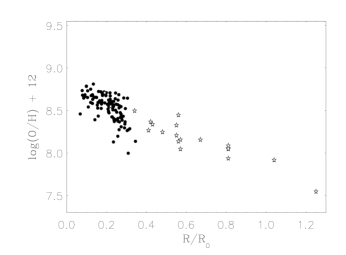
In Figure 2 we now represent the oxygen abundance as a function of the galactocentric radius divided by for all the regions with errors less than 0.23 dex. There is a good correlation between the data derived from the method (dots) and the data derived through the method (stars), and the tightness of the relation is now clearer.
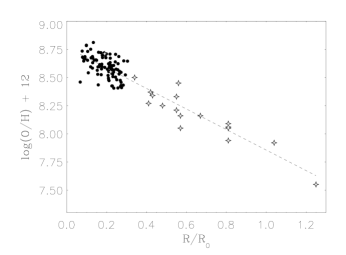
In Figure 3 we represent the derived oxygen abundance as a function of the galactocentric radius divided by for the selected regions with errors less than 0.23 dex and abundance larger than 8.4, to avoid the uncertainties due to the low metallicity branch of the method From Figure 3, it is clear that there is very good agreement between our data and those of Kennicutt et al. (2003). Moreover, our data cover a zone of high metallicity where only two regions are available from temperature-sensitive line method because of the low excitation of the H ii regions in the inner disc of the galaxy and the stronger continuum, which make the detection of the auroral lines difficult (Kennicutt et al. 2003).
In Table 1 we present the equivalent width for the [O ii] and [O iii] lines for our data (columns two and four) and for Kennicutt et al. (2003) data (columns three and five). The equivalent widths from Kennicutt et al. (2003) were derived assuming a value for the continua equal to those measured by Cedrés & Cepa (2002). In Table 2 we present the coincidental regions. The first column is the region identification (from Kennicutt & Garnett 1996), the second column is the -derived metallicity, the third column is the -derived metallicity from data in Cedrés & Cepa (2002) and the last column is the -derived metallicity from Kennicutt & Garnett (1996) data. It is clear that both regions present an agreement within the error limits for our -derived data and the -derived data.
| Region | EW([O ii]) | EW([O ii]) | EW([O iii]) | EW([O iii]) |
|---|---|---|---|---|
| (K2003) | (K2003) | |||
| H336 | 495Å | 570Å | 183Å | 226Å |
| H1013 | 1002Å | 816Å | 1135Å | 1732Å |
| Region | (This work) | (K&G) | |
|---|---|---|---|
| H336 | 8.550.16 | 8.630.22 | 8.59 |
| H1013 | 8.710.05 | 8.530.20 | 8.60 |
The best fit for all the data (including our strong-line derived abundance regions and the electron temperature-sensitive lines regions from Kennicutt et al. 2003) is:
| (4) |
which gives us a gradient of dex/kpc.
The fit in eq. (4) has an abundance scatter of the same order and presents considerable agreement with that derived by Kennicutt et al. (2003) using -based data alone:
| (5) |
When comparing these results with those presented in Cedrés & Cepa (2002) employing the empirical calibration of Zaritsky et al. (1994), it is clear that there is a large difference in the determination of the oxygen abundance. Taking into account the data from Kennicutt et al. (2003), we may assume that the early determinations of the metallicity of the central parts of the galaxy in Cedrés & Cepa (2002) were not as accurate as those presented here. Moreover, the shape of the abundance gradient is different. From Cedrés & Cepa (2002) it seems that there is a change in slope for the outer parts of the galaxy. However, such behaviour it is not shown here with the -derived data. Therefore, as proposed in Cedrés & Cepa (2002), this turnover may be due to a systematical error in the calibration employed by Zaristky et al. (1994). Our results seem to indicate that the gradient is linear right through to the inner regions of the galaxy. This assumption is corroborated by the coincidence between the two regions with data and data (H336 and H1013). However to fully confirm the linearity and the absolute value of the method as a tool for abundance measurement in the inner parts of galaxies, more determinations of abundance employing the and methods simultaneously are required.
4 Conclusions
We have obtained the oxygen abundance through the method for 90 H ii regions of the inner parts of M101.
There is very good agreement between our data and the derived abundances from the method for regions with high metallicity. Compared with spectroscopic methods, these results present a larger number of regions than any previous study. The dispersion of the data shows that, even for the larger uncertainties, the data are almost as reliable as those of spectroscopic studies employing the or the method. Moreover, the direct imaging method is less time-consuming because only two observing nights are required to obtain data for more than a hundred regions from one galaxy.
The method has proved to be a useful tool for determining oxygen abundances in the inner zones of galaxies, where auroral lines are difficult to measure and the metallicity is moderately high. Moreover, direct imaging techniques proved superior when considering observing time and the number of regions observed.
Acknowledgements.
This work was supported by the Spanish Plan Nacional de Astronomía y Astrofísica under grant AYA2002-01379.References
- (1) Cedrés, B. 2003, Ph.D. Thesis, Universidad de La Laguna
- (2) Cedrés, B., & Cepa, J. 2002, A&A, 391, 809
- (3) de Vaucouleurs, G., de Vaucouleurs, A., Corwin, H. G., Buta, R. J., Paturel, G., & Fouque, P. 1991, Third Reference Catalog of Bright Galaxies, University of Texas Press
- (4) Dopita, M. A., & Evans, I. N. 1986, ApJ, 307, 431
- (5) Edmunds, M. G., & Pagel, B. E. J. 1984, MNRAS, 211, 507
- (6) Garnett, D. R., & Kennicutt, R. C. 1994, ApJ, 426, 123
- (7) Kennicutt, R. C., Bresolin, F., & Garnett, D. R. 2003, ApJ, 591, 801
- (8) Kennicutt, R. C., Garnett, D. R. 1996, ApJ, 504, 518
- (9) Kewley, L. S., & Dopita, M. A. 2002, ApJSS, 142, 35
- (10) McCall, M. L., Rybski, P. M., & Shields, G. S. 1985, ApJS, 57, 1
- (11) McGaugh, S. S. 1991, ApJ, 380, 140
- (12) Monteverde, M. I., Herrero, A., & Lennon, D. J. 2000, ApJ, 545, 813
- (13) Pagel, B. E. J., Edmunds, M. G., Blackwell, D. E., Chun, M. S., & Smith, G. 1979, MNRAS, 189, 95
- (14) Pilyugin, L. S. 2001a, A&A, 369, 594
- (15) Pilyugin, L. S. 2001b, A&A, 373, 56
- (16) Rosa, M., 1981, PhD thesis, Landessternwarte Heidelberg/Königstulh
- (17) Searle, L. 1971, ApJ, 168, 327
- (18) Smartt, S. J., Crowther, P. A., Dufton, P. L., Lennon, D. J., Kudritzki, R. P., Herrero, A., McCarthy, J. K., & Bresolin, F. 2001, MNRAS, 325, 257
- (19) Trundle, C., Dufton, P. L., Lennon, D. J., Smartt, S. J., & Urbaneja, M. A. 2002, A&A, 395, 519
- (20) Zaritsky, D., Kennicutt, R. C., & Huchra, J. P. 1994, ApJ, 420, 87