The Properties and the Evolution of the Highly Ionized Gas in MR 2251178
Abstract
We present the first XMM-Newton observations of the radio-quiet quasar MR 2251178 obtained in 2000 and 2002. The EPIC-pn spectra show a power-law continuum with a slope of at high energies absorbed by at least two warm absorbers (WAs) intrinsic to the source. The underlying continuum in the earlier observation shows a “soft excess” at low X-ray energies which can be modeled as an additional power-law with . The spectra also show a weak narrow iron K emission line. The high-resolution grating spectrum obtained in 2002 shows emission lines from N VI, O VII, O VIII, Ne IX, and Ne X, as well as absorption lines from the low-ionization ions of O III, O IV, and O V, and other confirmed and suspected weaker absorption lines. The O III—O V lines are consistent with the properties of the emission line gas observed as extended optical [O III] emission in this source. The signal-to-noise of the 2000 grating data is too low to detect any lines. We suggest a model for the high-resolution spectrum which consist of two or three warm-absorber (WA) components. The two-components model has a high-ionization WA with a column density of – cm-2 and a low-ionization absorber with a column density of cm-2. In the three-components model we add a lower ionization component that produce the observed iron M-shell absorption lines. We investigate the spectral variations in MR 2251178 over a period of 8.5 years using data from ASCA, BeppoSAX, and XMM-Newton. All X-ray observations can be fitted with the above two power laws and the two absorbers. The observed luminosity variations seems to correlate with variations in the soft X-ray continuum. The 8.5 year history of the source suggests a changing X-ray absorber due to material that enters and disappears from the line-of-sight on timescales of several months. We also present, for the first time, the entire FUSE spectrum of MR 2251178. We detect emission from N III, C III, and O VI and at least 4 absorption systems in C III, H I, and O VI, one at 580 km s-1 and at least 3 others which are blended together and form a wide trough covering the velocity range of 0 to 500 km s-1. The general characteristics of the UV and X-ray absorbers are consistent with an origin in the same gas.
Subject headings:
galaxies: active — galaxies: individual (MR 2251178) — galaxies: nuclei — galaxies: Quasars — techniques: spectroscopic — X-rays: galaxies1. Introduction
MR 2251178 was the first quasar detected by X-ray observations (by Ariel V and SAS-3; Cooke et al. 1978, Ricker et al. 1978), and also the first quasar where a warm absorber (WA) was suggested to explain the X-ray spectrum based on Einstein observations (Halpern 1984). The X-ray flux of the source is variable on timescales of days, e.g., the EXOSAT observations reported by Pan et al. (1990). These authors found the column density of the WA to vary and to correlate with the X-ray flux. Mineo & Stewart (1993) combined the earlier EXOSAT observations with a GINGA observation from 1989 and argued that the spectrum could be described by a power law with photon index and a WA model with a column density of cm-2. Using this model they found the ionization parameter to be strongly correlated with the source luminosity.
A deep ROSAT/PSPC observation from 1993 was reported by Komossa (2001) who modeled the 0.1–2.4 keV spectrum using a WA with a column density of cm-2. MR 2251178 was observed with ASCA ten times during 1993 and 1996. These observations seem to be consistent with a WA with a column density of about cm-2 (e.g., Reynolds 1997, Otani et al. 1998, Reeves & Turner 2000, Morales & Fabian 2002). MR 2251178 was also observed twice with BeppoSAX during 1998. The two observations are separated by 5 months and show identical spectral shape and flux. The WA column was found to be cm-2 and the difference from previous observations was attributed to the motion of the absorber across our line-of-sight (Orr et al. 2001). In summary, the observed 2–10 keV flux of MR 2251178 covers the range of – erg cm-2 s-1 which translates to a 2–10 keV luminosity of – erg cm-2 s-1 (H km s-1 Mpc-1, , and assuming a power law). The Galactic hydrogen column density towards MR 2251178 has been derived from 21 cm measurements to be cm-2 (Lockman & Savage 1995).
| Mission | Sequence Number | Date | Time (ks)aaTotal effective exposure times determined from: SIS0 selected data for ASCA, MECS data for BeppoSAX, and EPIC-pn data for XMM-Newton. | Rate (count s-1)bbCount rates determined from: SIS0 over the 0.5–10 keV band for ASCA, MECS over the 2–10 keV band for BeppoSAX, and EPIC-pn over the 0.2–11 keV band for XMM-Newton. |
|---|---|---|---|---|
| ASCA | 71035000 | 1993 Nov 11 | 3.6 | |
| ASCA | 71035010 | 1993 Nov 16 | 6.9 | |
| ASCA | 71035040 | 1993 Dec 12 | 9.9 | |
| ASCA | 71035060 | 1993 Dec 14 | 5.8 | |
| ASCA | 71035020 | 1993 Dec 19 | 6.7 | |
| ASCA | 71035050 | 1993 Dec 24 | 7.5 | |
| ASCA | 74028000 | 1996 May 26 | 17.8 | |
| ASCA | 74028010 | 1996 Jun 18 | 16.5 | |
| ASCA | 74028020 | 1996 Nov 27 | 15.9 | |
| ASCA | 74028030 | 1996 Dec 09 | 20.0 | |
| BeppoSAX | 50556001 | 1998 Jun 14 | 47.5 | |
| BeppoSAX | 505560011 | 1998 Nov 12 | 47.5 | |
| XMM-Newton | 0112910301 | 2000 May 29 | 3.5 | |
| XMM-Newton | 0012940101 | 2002 May 18 | 44.7 |
An Fe K line was first suggested in a GINGA observation of MR 2251178, with an equivalent width (EW) of eV (Mineo & Stewart 1993). This was later confirmed by the ASCA and BeppoSAX observations with EW of eV (Reynolds 1997; cf., Reeves & Turner (2000) found EW of eV) and eV (Orr et al. 2001), respectively.
The redshift of MR 2251178 was determined by using nine optical narrow emission lines (Bergeron et al. 1983) to be (we note that a few catalogs listed incorrect values, which has resulted in a variety of values quoted in the literature). The host galaxy has a gaseous component with temperature of K (derived from the [O III] line ratio) and indications of low abundances of Ne, O, and N (Bergeron et al. 1983). The galaxy is surrounded by a giant H II envelope which is observed via [O III] 5007 emission. MR 2251178 was observed by HST at three epochs (Monier et al. 2001 and references therein). The spectrum shows clear Ly and C IV absorption. Ganguly, Charlton, & Eracleous (2001) found the C IV doublet absorption to vary with time, suggesting an intrinsic origin for this absorption. The quasar is radio quiet with a radio flux of 16.20.7 mJy (NVSS catalog – Condon et al. 1998).
This paper presents new XMM-Newton and Far Ultraviolet Spectroscopic Explorer (FUSE) observations of MR 2251178. We also carry out an in-depth analysis of the 10 available ASCA observations and the two BeppoSAX observations. We describe the data in § 2, perform an X-ray data temporal analysis in § 3, and discuss the X-ray spectral analysis in § 4 and the UV spectral analysis in § 5. In § 6 we elaborate on the implications of our results.
2. Observations and Data Reduction
This paper includes an extensive analysis of the historical UV and X-ray spectra of MR 2251178. The basic X-ray observations are listed in Table 1 and the data analysis is described in this section.
2.1. XMM-Newton Observations
MR 2251178 was observed with XMM-Newton during 2002 May 18–19 for 64 ks. Data were reduced using the Science Analysis System (SAS v5.3.0) in the standard processing chains as described in the data analysis threads and the ABC Guide to XMM-Newton Data Analysis.111http://heasarc.gsfc.nasa.gov/docs/xmm/abc Source data were extracted from circular regions of radius 30 and 40 for the EPIC-pn and EPIC-MOS, respectively. The EPIC-pn was operated in the small window mode resulting with good exposure time of 45 ks. The observed count rate (7.3 counts s-1 before background subtraction) was well below the pileup threshold (130 counts s-1, see XMM-Newton Users’ Handbook). For statistical purposes we binned the spectra to have at least 25 counts per bin. MOS CCDs were used in the large window mode and the observed count rate (2.0 counts s-1 before background subtraction) was just above the pileup threshold (1.8 counts s-1). The MOS observations will not be discussed here.
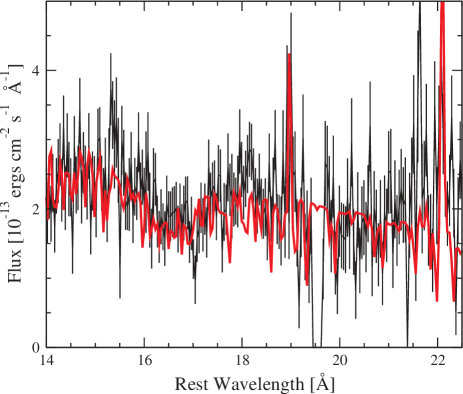
The RGS1 and RGS2 were operated in the standard spectroscopy mode resulting in a good exposure time of 63 ks for each. Background extraction is performed with the SAS using regions adjacent to those containing the source in the spatial and spectral domains. The spectra were extracted into bins of 0.04 Å in width (4 times the default bin width) in order to increase the signal-to-noise ratio. To flux calibrate the RGS spectra we divided the counts by the exposure time and by the effective area at each wavelength. Each flux-calibrated spectrum was also corrected for Galactic absorption and the two spectra combined into an error-weighted mean. At wavelengths where the RGS2 bins did not match exactly the wavelength of the RGS1 bins, we interpolated the RGS2 data to enable the averaging. This final spectrum is shown in Figure 1.
MR 2251178 was also observed with XMM-Newton during the validation and verification phase of the telescope during 2000 May 29. We retrieved the data from the XMM-Newton archive and reduced it in the same way as described above for the 2002 observation. Unfortunately, due to the operating modes used, neither of the EPIC-MOS detectors contain any useful data from MR 2251178 during this observation. The EPIC-pn was operated in the small window mode resulting in good exposure time of 3.5 ks. The observed count rate (18.1 counts s-1 before background subtraction) was well below the pileup threshold. The RGS1 and RGS2 were operated in the standard spectroscopy mode during two distinct exposures, each of about 6 ks (which is the same as the good exposure time accumulated).


2.2. ASCA Observations
As listed in Table 1, the ASCA archive contains 10 observations of MR 2251178. The data were screened in the same manner as used for the Tartarus Database (e.g., Turner et al. 1998). We briefly describe this procedure here. ASCASCREEN/XSELECT (v0.45) was used for screening together with the criteria222With the exception of the pixel threshold for each SIS that was automatically calculated on a file-by-file basis within ASCASCREEN. given in Nandra et al. (1997). In the case of the ASCA SIS data, ’hot’ and ’flickering’ pixels were removed using the standard algorithm and only SIS grades 0, 2, 3, and 4 events were included in the analysis. The original pulse-height assignment for each event was converted to a pulse-invariant (PI) scale using SISPI (v1.1). In the GIS data, hard particle flares were rejected using the so-called ’HO2’ count rate, and standard rise-time rejection criteria were employed. The effective exposure times resulting from these criteria are listed in Table 1.
The spectral analysis for each of the 10 ASCA observations was performed on the data from all four instruments simultaneously. Different relative normalizations were allowed to account for (small) uncertainties in the determination of the effective area of each instrument. We also corrected the ASCA 1996 data for the SIS degradation as indicated by Yaqoob et al. (2000). Individual spectra were binned in energy to contain a minimum of 20 counts per bin, and hence allowing meaningful minimization. Fits to the data were carried out with XSPEC using our own models, as described below. Quoted uncertainties on the parameters refer to the 90% confidence level.
2.3. BeppoSAX Observations
BeppoSAX observed MR 2251178 at two epochs: 1998 June 14–18 and 1998 November 12–16. The observations and their analysis are described in Orr et al. (2001). In the following analysis we use the data and the calibrations supplied by the HEASARC archive. We used only the data obtained with the Low-Energy Concentrator Spectrometer (LECS; 0.1–4 keV) and the Medium-Energy Concentrator Spectrometer (MECS; 1.8–10 keV). Again we use XSPEC, and allow different relative normalizations to account for uncertainties in the effective areas of the instruments.
2.4. FUSE Observations
MR 2251178 was observed with FUSE during 2001 June 20–21. The observation was carried out using the LWRS aperture and is ks in duration. Only a small part of the spectrum around the O VI absorption has been published to date (Wakker et al. 2003). Thus we have extracted the raw data from the FUSE archive, and reduced it using the FUSE software (CalFUSE v2.2.2 and FUSE IDL tools version of 2002 July). The FUSE spectrum is shown in Figure 2.
3. Temporal Analysis of the X-ray Spectra
3.1. ASCA
Light curves were constructed for the source and background regions for all ASCA observations, in several different energy ranges. To increase the signal-to-noise ratio, the light curves from each pair of SIS and GIS detectors were combined. The light curves were then rebinned on a variety of timescales.

The combined SIS light curves in the 0.5–10 keV band are shown in Figure 3. There is no evidence for short timescale variability within any of the observations. This is confirmed by a lack of significant ‘excess variance’ (Turner et al. 1999 and references therein) in any of the observations, with upper limits of typically (at 90% confidence). Such a lack of a short timescale variability is consistent with the anti-correlation between the excess variance and the luminosity found by Nandra et al. (1997). Clear variability is seen between observations, with a maximum flux change of a factor 3 over 3 years. The smallest amplitude variation on the shorter timescale is a 20% flux decrease in 5 days between the fifth and the sixth ASCA observations.
We have also constructed light curves in the 0.5–1.2 keV (XM1), 1.5–3.5 keV (XM2), and 4.0–10.0 (XM3) bands of Netzer, Turner, & George (1994). In the lower panels of Figure 3 we plot the mean XM1/XM3 and XM2/XM3 ratios for each observation. We find no statistically significant variation in softness ratio during each of the three epochs (the apparent decrease in the XM1/XM3 ratio during the 1993 Nov–Dec epoch is significant at only the 75% confidence level). However, both ratios exhibit statistically significant variability (98% confidence) between the epochs in a manner suggesting that the spectrum becomes softer when the source luminosity increases. These variations are discussed in §4.5 and §6.1.
3.2. XMM-Newton and BeppoSAX
We examined the EPIC-pn and the two EPIC-MOS background-subtracted light curves of MR 2251178. No significant flux variation is detected during the 64 ks observation. This is consistent with the ASCA observations which show no variations on timescales of less than a day.
The EPIC-pn count rate from the 2000 observation ( counts s-1) is 2.5 times higher than the EPIC-pn data from 2002 ( counts s-1). Table 2 gives the softness ratios, as defined above, for the two EPIC-pn observations. We find clear variations in both softness ratios.
Orr et al. (2001) examined the light curves for the 1998 June and November BeppoSAX observations as well as the hardness ratios. They find the count rates and hardness ratios to be similar at the two epochs. While the June light curve is well fitted with a constant count rate Orr et al. (2001) find the November observation to better fit with a slowly decreasing linear function (minus % in 70 hours) although a constant count rate cannot be ruled out.
| Date | XM1/XM3 | XM2/XM3 |
|---|---|---|
| 2000 May 29 | ||
| 2002 May 18 |

4. Spectral Analysis of the X-ray Data
We have carried out an extensive spectral analysis of the low resolution ASCA, BeppoSAX and XMM-Newton spectra of MR 2251178 as well as the high resolution RGS spectra. We first consider the high signal-to-noise, broad-band and RGS spectra obtained using XMM-Newton in 2002, and describe a multi-component model that is consistent with the data (§4.1 and 4.2). This model is then compared to the XMM-Newton data obtained during 2000 (§4.3 and 4.4) and to the historical X-ray datasets in §4.5.
4.1. Analysis of the 2002 Broad Band X-ray Spectrum
We first fitted the 0.2–11 keV EPIC-pn spectrum of MR 2251178 obtained in 2002 with a single Galactic absorbed power law. This gives a poor description of the data () in agreement with previous analysis of the source. The main discrepancy is at low energies, hence we repeated the fit for only the 3–11 keV band (excluding the 4.5–7.5 keV rest-frame band where contamination from the Fe K line might be present). We find and normalization of photons cm-2 s-1 keV-1 with . We show an extrapolation of this continuum to lower energies in Figure 4. The presence of an excess absorption around the O VII and O VIII edges, at 0.7–0.9 keV, is clear and indicates a WA component. Excess absorption is also evident at energies below 0.5 keV, which is indicative of an additional, less-ionized absorber.
| Mission name | Date | ColumnaaLog of the column density in units of cm-2. | bbIonization parameter, , defined over the 0.538–10 keV range. | Norm (ccNormalization at 1 keV in units of photons cm-2 s-1 keV-1 for the power law with photon index fixed to . | Norm (ddNormalization at 1 keV in units of photons cm-2 s-1 keV-1 for the power law with photon index fixed to . | FluxeeObserved 4–10 keV flux in units of erg cm-2 s-1. | |
|---|---|---|---|---|---|---|---|
| (1) | (2) | (3) | (4) | (5) | (6) | (7) | (8) |
| Fits to the 0.1–10.0 keV band | |||||||
| BeppoSAX | 1998 Jun 14 | 21.8 | 2.04 | 1.25 | |||
| BeppoSAX | 1998 Nov 12 | 21.8 | 2.22 | 1.24 | |||
| XMM-NewtonffFits for these XMM-Newton observations are over the 0.2–11 keV band. | 2000 May 29 | 21.5 | 2.27 | 1.15 | |||
| XMM-NewtonffFits for these XMM-Newton observations are over the 0.2–11 keV band. | 2002 May 18 | 21.5 | 1.28 | 1.21 | |||
| Fits to the 0.5–10.0 keV band | |||||||
| ASCA | 1993 Nov 11 | 21.5 | 3.39 | 0.96 | |||
| ASCA | 1993 Nov 16 | 21.5 | 2.72 | 0.99 | |||
| ASCA | 1993 Dec 12 | 21.5 | 3.17 | 0.98 | |||
| ASCA | 1993 Dec 14 | 21.5 | 2.85 | 1.02 | |||
| ASCA | 1993 Dec 19 | 21.5 | 2.65 | 0.92 | |||
| ASCA | 1993 Dec 24 | 21.5 | 2.20 | 0.96 | |||
| ASCA | 1996 May 26 | 21.8 | 1.74 | 0.96 | |||
| ASCA | 1996 Jun 18 | 21.8 | 2.14 | 1.03 | |||
| ASCA | 1996 Nov 27 | 22.1 | 1.82 | 1.01 | |||
| ASCA | 1996 Dec 09 | 22.1 | 1.95 | 1.00 | |||
| BeppoSAX | 1998 Jun 14 | 21.8 | 2.03 | 1.26 | |||
| BeppoSAX | 1998 Nov 12 | 21.8 | 2.27 | 1.23 | |||
| XMM-Newton | 2000 May 29 | 21.5 | 2.27 | 1.12 | |||
| XMM-Newton | 2002 May 18 | 21.5 | 1.28 | 1.16 | |||
Note. — Fits use two power laws with fixed slopes of (normalization given in column 6) and (normalization given in column 5), a photoionized WA with ionization parameter as given in column (4) and column density fixed to the value given in column (3), Galactic neutral absorber fixed at cm-2 and intrinsic neutral absorber with column density of cm-2. All fits are over the noted band, excluding the rest frame 5.0–7.5 keV band. Quoted uncertainties on the parameters are at the 90% confidence level. Several of these fits are presented in Figure 7 and 8. The fits are discussed in § 4.5 which also explain how the column densities for the observations were determined.
We used ION2003, the 2003 version of the ION photoionization code (Netzer 1996; Netzer et al. 2003) in order to model the WA. For simplicity, in all calculations we assume constant density gas with a density of cm-3, which is low enough to avoid complications due to collisional de-excitation and line transfer yet large enough to assume “thin-shell” geometry. The relevant parameters of the model are (the oxygen ionization parameter defined over the range of 0.538–10 keV), the column density (in units of cm-2), the gas composition (assumed to be solar and specified in Netzer et al. 2003 Table 2), and the covering fraction.
We used ION2003 to fit the 2002 EPIC-pn data assuming power law, with a slope fixed to the value found earlier (), attenuated by the Galactic column density, and two generic absorption components: one with a “typical” WA properties and one which is much less ionized. Fitting the spectrum with this model yields some excess emission around 0.5 keV regardless of the exact values of and . We interpret this excess as due to emission of the O VII triplet and the O VIII Ly lines. Hence, we added to the model an emission component constrained to have the WA ionization parameter and column density. Having all these components, we obtained the following solution: For the WA component we find log(, cm-2 and a line-of-sight covering factor of 0.8. For the emission we find a global covering factor of 0.3. For the less ionized absorber we find that it can be fitted by a neutral absorber (in addition to the Galactic one) with cm-2. Since MR 2251178 is at low redshift this column can be interpret either as an additional galactic absorber or as neutral gas intrinsic to the source. The low ionization absorber can also be modeled as a combination of low ionization absorber with log( and cm-2 and a neutral absorber of cm-2(we show below that such low ionization component is required by the RGS data). Both cases give equally good fits and the statistical analysis for all absorbers and emitters yield for both.
4.1.1 Fe K Line
The 2002 XMM-Newton EPIC-pn data suggest a very weak Fe K line. Using the continuum from Table 3, and fixing the line energy to 6.4 keV, we find a narrow line with a width of keV and a flux of photons cm-2 s-1. The EW of the line is eV, consistent with previous studies of this source (see § 1). We found no indication for a broad component to the Fe K line. This line will not be discussed any further.
We note on a narrow absorption feature at around rest frame energy of keV (see Figure 4). We fitted this feature with a Gaussian with a width fixed to the instrumental resolution and find its rest frame energy to be keV and a normalization of photons cm-2 s-1. The EW of this Gaussian is eV. The energy of this feature is consistent with the Fe XXVI Ly line.
4.2. Analysis of the 2002 RGS Spectrum
The 2002-RGS spectrum of MR 2251178 shows several absorption and emission lines with wavelengths that are consistent with the systemic velocity, given the RGS resolution (0.04 Å, corresponding to 1000 km s-1 at 12 Å and 400 km s-1 at 30 Å). Despite the low signal-to-noise ratio (S/N; of order 3–4 at around 20 Å) evidence can be seen for emission lines from N VI, O VII, O VIII, Ne IX, and Ne X. Absorption lines are seen from the low ionization ions of O III, O IV, and O V as well as many higher ionization species. The strongest of these lines are marked in Figure 1 together with many other lines whose detection is less certain due to the low S/N. The wavelengths of the O III–O VI lines are those used by Netzer et al. (2003). A full line list is given in Table 4 where we differentiate between lines that are identified with high certainty and these that we regard as possible identification, due to the poor S/N. We also detect bound-free absorption due to the O VII and O VIII edges and a noticeable curvature of the spectrum over the wavelength band of 15–17Å.
The RGS spectrum also shows several features which we suspect to be artifacts. The strong emission-like feature at Å is probably an artifact caused by high background level and the proximity to the edge of the CCD. Several absorption-like features, at around 10–11 Å, are similar in shape and intensity to other absorption features and we suspect that some of those are due to Fe XVII–Fe XIX. However, in this part of the spectrum there is only one CCD (RGS2) and we cannot confirm their reality by comparing the two RGS spectra.
Modeling of the 2002 RGS spectrum was done in two steps. First we experimented with a two component absorber, similar to the one discussed in § 4.1. This involves a highly-ionized absorber and a second absorber of much lower-ionization. The highly-ionized WA has a large column density and is responsible for the bound-free absorption edges and the O VII and O VIII emission lines. The less ionized component has a lower column density and is responsible for the O III and O IV absorption lines. The absorption lines in both components are probably narrower than the instrumental resolution and we assumed that they can be characterized by a turbulent velocity of km s-1. The modeling assumes that each of the components can be represented by a single cloud (“shell”). Thus, the gas on the line of sight produces the absorption features and the gas outside the line of sight produces the emission lines.
| Ion | Rest wavelength [Å] | ConfidenceaaConfidence mark for the identified lines: 1 – line identified with high confidence; 2 – line identified with low confidence. |
|---|---|---|
| C VI | 33.737 | 2 |
| N V | 29.747 | 2 |
| N VI | 29.541 | 1 |
| N VI | 28.787 | 2 |
| C VI | 28.465 | 2 |
| C VI | 26.990 | 2 |
| N VII | 24.782 | 2 |
| N VI | 23.771 | 1 |
| O III | 23.051 | 1 |
| O IV | 22.729 | 1 |
| O V | 22.334 | 1 |
| O VII | 22.101 | 1 |
| O VI | 22.007 | 1 |
| O VI | 21.788 | 1 |
| O VII | 21.602 | 1 |
| N VII | 19.826 | 2 |
| O VIbbBlended with N VII at 19.361 Å. | 19.341 | 2 |
| O VI | 19.135 | 1 |
| O VIII | 18.966 | 1 |
| O VII | 18.627 | 2 |
| O VIII | 16.006 | 2 |
| Fe XVIII | 14.208 | 1 |
| Ne IX | 13.700 | 1 |
| Ne IX | 13.447 | 1 |
| Ne X | 12.134 | 1 |
| Fe XVIII | 10.579 | 1 |
| Ne X | 10.238 | 2 |
| Na XI | 10.025 | 1 |
| Fe XIX | 9.695 | 1 |
| Mg XI | 9.231 | 2 |
We first used the model parameters derived form the EPIC-pn data and calculated theoretical spectra for this gas. We note that according to Kirsch (2003) the EPIC and RGS agree within % in the normalization, and individual fitting shows a significant steeper slope for the EPIC (see also den Herder et al. 2003 and Blustin et al. 2002). This effect seems to be present in our data and hence we do not require complete agreement between the slopes derived from fitting the RGS and the PN spectra. Given those uncertainties, we found a good fit for the RGS continuum with our two-component model for a power law of photon index .
We experimented with a range of parameters around the values found for the EPIC-pn. The parameters we found to fit best for the two absorbers in the RGS spectrum are: log( and in the range of – cm-2 for the high-ionization WA component and log( and cm-2 for the low-ionization component. We also assume, based on the UV measurement (see §6.3) and in agreement with the EPIC-pn model, a line of sight covering factor of 0.8 and an undetermined outflow velocity which is taken to be 300 km s-1. We note that the less-ionized gas does not contribute anything to the observed X-ray emission lines and the required global () covering factor for the emitting gas is .
The two-component model fits the general continuum shape, the Ne IX triplet, the O VIII Ly, the O VII forbidden line, and the absorption of O IV and O III. A major discrepancy is the underestimation of the O VII resonance emission line at 21.6 Å. A similar phenomenon has been observed in NGC 3783 where the O VII line is underpredicted in the best-fitting model of Netzer et al (2003). A possible explanation may be a complex optical depth structure for this optically thick line. For example, the lateral optical depth (which cannot be observed and is a function of the geometry) may be smaller than the line-of-sight optical depth used in the calculations. As a results, line photons can escape more easily in some directions increasing, in this way, the emission line intensity. Such a situation may arise in conical type flows where the cone lateral dimension is smaller than its height. The two-component fit is severely limited by the poor S/N of the grating observations. Nevertheless, it shows that the ionized (line-of-sight) absorber and the ionized emitter are consistent with being the same gas.
The next step includes a three component absorber. The main motivation for this is the fact that the RGS data around 16–17 Å clearly falls below the two-component model. The excess absorption is probably caused by the unresolved transition array (UTA) of iron M-shell lines (Behar, Sako, & Kahn 2001) which has been observed in several other AGNs (see, e.g., Netzer et al. 2003 for the case of NGC 3783 and Netzer 2004 for a general discussion). Our photoionization code includes all these lines but the two-component WA produces too shallow a feature at too short a wavelength. We find that an additional shell with a column density of cm-2 and log can significantly improve the fit. This component produces a noticeable UTA feature and contributes also to the observed O VII emission. This requires lowering the emission from the high-ionization component by about 20% to produce an adequate fit to all emission lines. Adding this component force us to increase the ionization parameter of the highly ionized gas (the one with column density of cm-2) to log. We note that the mean of these two WA components is the same as the one found earlier in the two-component model. The three-component model is compared with the RGS data in Figure 1 on a wavelength scale where all the features can be seen. In Figure 5 we show a comparison on a reduced wavelength scale to emphasize the UTA range. The UTA fit utilizes the improved dielectronic recombination rates of Netzer (2004) and is in good agreement with the 15–17 Å spectrum.
There are two problems with the three-component model related to its agreement with the EPIC-pn data. First, we could not find a model which explains the UTA feature and is also consistent with the EPIC-pn spectrum. In particular, while we are convinced in the presence of a UTA feature, there is no way to assess the exact column density of the relevant ions (Fe VII–Fe XII and O VII), in the intermediate component, given the S/N of the present data. Second, the chosen column of cm-2 for the high component is about the maximum which is still consistent with the EPIC-pn observation. Yet, some strong features in the RGS spectrum seem to require even a larger absorbing column density.
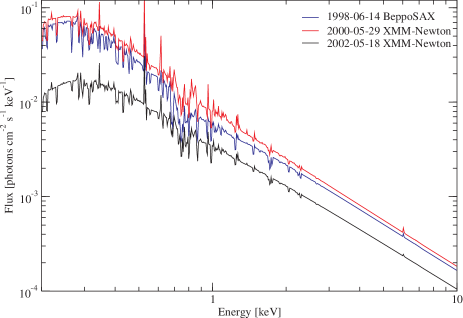
4.3. Analysis of the 2000 Broad Band X-ray Spectrum
As argued above, a full model for the X-ray spectrum of MR 2251178 obtained by XMM-Newton in 2002 requires a a power law continuum attenuated by (neutral) Galactic absorption and at least two absorbers. In Figure 6 we plot the EPIC-pn 2000 data divided by the scaled 2002 model. The scaling is done by multiplying the power law continuum flux and the ionization parameter of the WA by the same factor of 1.9 (which is the hard flux ratio between the two observations). The plot shows a large excess at low energies indicating the presence of an additional continuum component. We denote this continuum the “soft excess”. We have re-visited the 2002 observation in attempt to look for this component but the data do not require its presence in this observation.

Next we attempted to determine the shape of the high energy continuum during the 2000 observation. For this we first fitted the 3–11 keV band (excluding the 4.5–7.5 keV rest-frame band) with a Galactic absorbed power law. We find and normalization of photons cm-2 s-1 keV-1 with . Fixing the hard continuum at these values, we re-fitted the data adding this time the ionized and the neutral absorbers, and the ionized emission constrained to the ionized absorber. We have also included the additional soft excess component assuming it can be fitted by a second power law. The fit results with a and the following parameters: A soft excess component with and normalization of photons cm-2 s-1 keV-1, an ionized absorber with log( and , and a neutral absorber with a column density of cm-2.
4.4. Analysis of the 2000 RGS Spectrum
Although the source flux during the 2000 XMM-Newton observation was a factor of larger than the flux during the 2002 observation, the integration time is much shorter (by a factor of 5). Thus, we were unable to obtain any useful constraints from the RGS data obtained in 2000. More specifically, we could not identify any emission or absorption lines in this spectrum (if any such lines are present in this spectrum and have the same EWs as the lines in the 2002 observation, they are consistent with the noise level).
| Mission name | Date | NormalizationaaPower law normalization at 1 keV in units of ph cm-2 s-1 keV-1. | |
|---|---|---|---|
| ASCA | 1993 Nov 11 | ||
| ASCA | 1993 Nov 16 | ||
| ASCA | 1993 Dec 12 | ||
| ASCA | 1993 Dec 14 | ||
| ASCA | 1993 Dec 19 | ||
| ASCA | 1993 Dec 24 | ||
| ASCA | 1996 May 26 | ||
| ASCA | 1996 Jun 18 | ||
| ASCA | 1996 Nov 27 | ||
| ASCA | 1996 Dec 09 | ||
| BeppoSAX | 1998 Jun 14 | ||
| BeppoSAX | 1998 Nov 12 | ||
| XMM-Newton | 2000 May 29 | ||
| XMM-Newton | 2002 May 18 |
Note. — Fits to the hard X-ray continuum (3–10 keV, excluding the rest frame 5.0–7.5 keV band) using a simple power law.
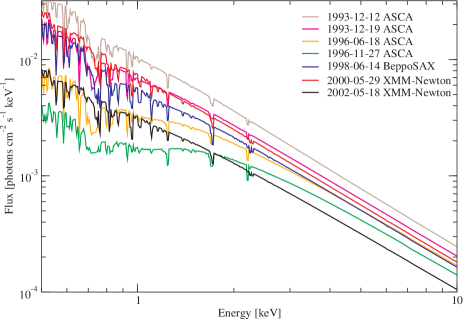
4.5. Historical Variations of the X-ray Spectrum of MR 2251178
The 2000 and 2002 EPIC-pn observations of MR 2251178 show that a full model for the X-ray spectrum must include a high energy power law continuum, a soft excess power law component and two absorbers. This combination was used to fit also the earlier BeppoSAX and ASCA spectra of the source and the results are discussed in this section. We note that the low resolution BeppoSAX and ASCA data are not sensitive to the inclusion of the emission component in our model. These data are also not sensitive to the differences between the two and the three absorption components discussed in § 4.2. Thus in the fit below we include only one highly ionized WA component which represent an average of two such components.
Our initial assumption is that the absorbers’ column densities are constant and that the only changes are in the value of the ionization parameter which is proportional to the source luminosity. We fixed the power law slopes of the soft excess and the hard continuum to be and , respectively, and we only allow changes in their relative normalization. The value for the hard X-ray slope is consistent with all previous X-ray observations of MR 2251178 and is in accord with earlier findings of Reeves & Turner (2000), Orr et al. (2001), and Morales & Fabian (2002). In Table 5 we show power-law fits for the 3–10 keV band (excluding the rest frame 5.0–7.5 keV band) for all data sets in order to determine hard X-ray slope in each observation. As seen from the table, a continuum is in good agreement with all data sets. We also fixed the Galactic absorption to the value found earlier. In the following fits we excluded the rest frame 5.0–7.5 keV band to avoid complications due to the Fe K line. The bound-free opacity of the low-ionization absorber is very similar to a totally neutral absorber, and cannot be distinguished from such an absorber in the data collected with low spectral resolution. Indeed no useful constraints regarding changes in the ionization state of this component can be obtained. Thus, in this section we simply approximate the effects of the low-ionization absorber by a neutral absorber with a column density to cm-2 (as found above). Constraints can, however, be obtained by the study of variations in the high-ionization absorber and underlying continuum, and these are considered in the remainder of this section.
We first fit the BeppoSAX data, and re-fitted the XMM-Newton data, with the same model and the fixed parameters as described above. The results of these fits are tabulated in the upper part of Table 3 and are plotted in Figure 7. The fits to the XMM-Newton observations indicate that the flux decrease from 2000 to 2002 was associated with the disappearance of the soft excess component. On the other hand, there is no change, within the data and model uncertainties, in the column density () and the ionization parameter of the high-ionization WA. Thus, there seems to be no connection between the ionization parameter and the X-ray luminosity of the source during this two year period. For the two BeppoSAX observations, we found that the required WA column density is cm-2. This is consistent with the column density reported by Orr et al. (2001) and gives a better fit ( is lower by 0.3) than the column of cm-2. This is significant at an F-test probability of . Fitting the 0.1–11 keV BeppoSAX observations we find that they also require the presence of a soft excess component. The two observations are entirely consistent with each other (as reported also by Orr et al. 2001) despite the 5 months separation. The high energy flux level of the BeppoSAX and the 2000 XMM-Newton observations are similar but the soft excess component contribution to the BeppoSAX observation is lower by a factor of (see Figure 7). The WA properties of the BeppoSAX observations are not consistent with those of the XMM-Newton observations, indicating again that the absorber in MR 2251178 is changing on timescales of years. In general, we find a weakening in the soft excess as the source luminosity decreases, however, the dependence between the two is not simple.
We now consider the ASCA data, which are limited to the 0.5–10.0 keV band. Therefore we re-fitted the BeppoSAX and XMM-Newton data over the same energy range thus enabling a more meaningful comparison between the various observations. The lower part of Table 3 summarizes the fit results and Figure 8 shows selected models. In Figure 9 we show selected ASCA SIS0 data sets.
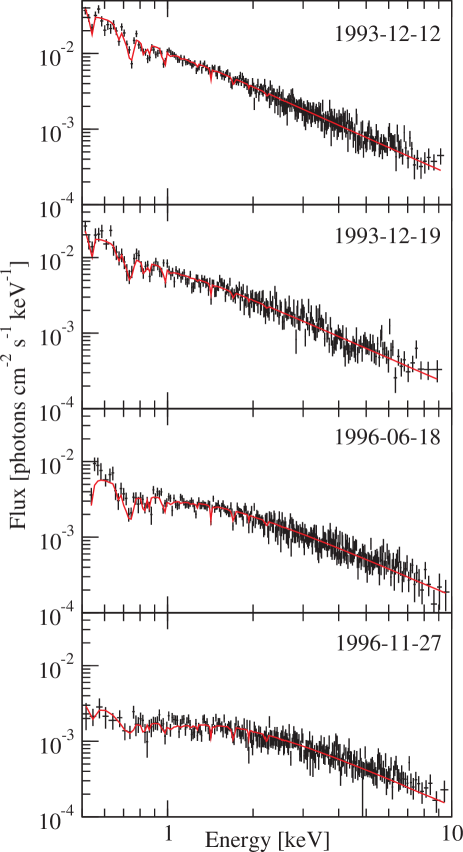
We were able to fit the first 6 ASCA observations (taken during 6 weeks on 1993 Nov–Dec) with the same column density high-ionization WA ( cm-2) changing only the ionization parameter (see Table 3). However, the 1996 Nov-Dec observation requires a larger column density of cm-2 which gives . When fixing the column density to cm-2 the best fit gives , i.e., the change in column density is highly significant (an F-test probability of practically 0). The best fit to the May-June 1996 observations also requires a larger column density absorber ( cm-2) which gives (when fixing the column density to or cm-2 the is increased by over the 1020 degrees of freedom). This suggests that the properties of the WA have changed between 1993 and the end of 1996. The four observations of 1996 can be divided into two groups: two observations dating 1996 May–Jun and two in 1996 Nov–Dec. Within each group the spectra are indistinguishable. However, we could not find a consistent model for the two epochs together.
The differences between 1993 and 1996, and the differences during 1996, all indicate that there are real changes in the absorbing column on timescales of several months to several years and there are no differences on timescales of two months or less. The ASCA data are limited to energies above 0.5 keV and thus poorly constrain the soft excess component. This also introduces some uncertainty concerning the WA properties since we cannot unambiguously determine the contribution of the soft excess component. Like the XMM-Newton and the BeppoSAX results, the ASCA fits also indicate a general trend where the soft excess is stronger when the hard flux is higher.
5. Spectral Analysis of the UV Data
5.1. The High Resolution FUSE Spectrum
The FUSE spectrum of MR 2251178 (Figure 2) shows broad emission lines of O VI1032,1038 and C III 977. All these lines show significant blueshifted absorption. We also detect blueshifted absorption from at least 10 lines of the H I Lyman series starting with Ly and going up to the Lyman edge, where the lines are blended together. The Ly absorption is outside the FUSE wavelength range and was observed, independently, by HST.

| Gaussian | NormalizationaaThe O VI1032 line normalization in units of erg cm-2 s-1 Å-1. The O VI1038 line normalization was set to half the O VI1032 line normalization. | bb and the FWHM are the same for the two lines of the doublet. [Å] | FWHMbb and the FWHM are the same for the two lines of the doublet. [km s-1] |
|---|---|---|---|
| I | 1.240 | 0.782 | 530 |
| II | 0.518 | 3.667 | 2500 |
| III | 0.160 | 13.096 | 8950 |
Note. — All Gaussian centers were set to the same velocity. In the rest frame spectrum the source they correspond to 1031.15 Å and 1036.84 Å, i.e., the fitted O VI emission lines are blueshifted by 240 km s-1 relative to the optical lines.
In order to study the intrinsic absorption spectrum we first fitted the O VI doublet emission lines. Each of the two emission lines (1032,1038) was fitted with three kinematic components represented by Gaussians with the same kinematic width, and had their flux ratio fixed at the ratio of oscillator strengths (2:1). The results are shown in Figure 10 and are listed in Table 6. The observed spectrum was then divided by this emission model and the resulting normalized spectrum was used to obtain the absorption velocity spectra shown in Figure 11a. We note that the continuum shown in Figure 10 does not match very well the continuum on the blue side of the Ly line around 1021 Å. To produce the velocity spectrum of Ly (shown in Figure 11a), we fitted the continuum on both sides of the line with a spline curve and divided the observed spectrum by this continuum. Figure 11b shows the C III absorption and two more Lyman absorption lines. The C III line region contains many Galactic features which do not allow a proper continuum fit. Therefore, this region was not normalized. Nevertheless, there is a clear C III absorption which matches in its velocity range the blueshifted absorption seen in Figure 11a.

Figures 11a and 11b suggest that the intrinsic absorption in MR 2251178 is arising in at least 4 absorption systems: one at 580 km s-1 and at least 3 others which are blended together and form a wide trough covering the velocity range 0 to 500 km s-1. The 3 centroid velocities in the trough are at about , and km s-1.
5.2. The HST UV Spectrum
UV spectra of MR 2251178 were taken by HST at three epochs (Monier et al. 2001 and references therein): 1996 August 2 with the FOS, 1998 December 19 and 2000 November 5 with STIS. To produce the velocity spectrum of the Ly absorption line, we fitted the 1998 STIS spectrum with a spline curve and divided the observed spectrum by this continuum. The Ly absorption line shows a similar profile to the Ly profile observed with FUSE 2.5 years later (see Figure 11c). The similarity is mainly in the center of the lines while the later spectrum suggesting the absorption got narrower (though this could be an artifact of the continuum fitting). The similarity in the lines centers indicates they are saturated. However, the lines are not completely black indicating the absorber does not completely cover the continuum source. The line profile suggests a covering factor of 90% for the absorbing material. This value is consistent with the covering factor fitted to the X-ray data. The exception is the narrow trough at which has a different depth in the two lines. One possibility is that, in this system, the H I lines are not saturated. The alternative explanation is that the system is saturated but it lies under the blue wing of the main broad absorption trough and this broader absorption is not saturated, resulting in a different depth to the blue wing.
Ganguly, Charlton, & Eracleous (2001) suggested that the C IV doublet absorption line that was detected in the FOS observation, in 1996 with EW of 1.090.09 Å, was not detected in the STIS spectrum taken 4 years later (down to a 3 limit corresponding to EW=0.19 Å). The C IV absorption system detected in the FOS spectrum has a width of km s-1 (Monier et al. 2001), consistent with the large trough seen in the FUSE spectrum. The resolutions of the two spectra are too poor (230 and 600 km s-1 for the FOS and STIS, respectively) to detect the narrow absorption system at km s-1 (which has a width of order 100 km s-1).
6. Discussion
6.1. The Highly Ionized Gas in MR 2251178
The new XMM-Newton data presented in this paper clearly show the presence of ionized gas seen in both emission and absorption in MR 2251178. The spectral analysis is severely limited by the poor S/N of the grating observations but several interesting results clearly emerge. In the grating data we identified X-ray emission lines from N VI, O VII, O VIII, Ne IX, and Ne X. We also identify, with high certainty, absorption lines from the low ionization ions of O III, O IV, and O V, as well as the signature of absorption edges due to O VII and O VIII. Many other absorption lines are probably detected (Table 4) but their reality and intensities are highly uncertain, because of the limited S/N.
For the 2002 RGS data we suggest one of two possible models. The first model consists of two absorbers: a highly ionized absorber with a column density of cm-2 and log(, and a low ionization absorber with a column density of cm-2 and log(. The second possibility is a three-component model where we split the highly ionized absorber from the above model into two components: one with log( and the other with log(. The ionized (line-of-sight) absorber and the ionized emitter in both cases are consistent with being the same gas with a global covering factor of 0.4. The highly ionized absorption lines are probably narrower than 200 km s-1, a limit which is imposed by the equivalent width of the strongest predicted lines, given the column density, the ionization parameter, and the S/N of the observations.
More interesting conclusions are derived from analyzing the historical light curve of the source combining 8.5 years of observations by XMM-Newton, ASCA and BeppoSAX. The main findings are:
-
1.
All X-ray observations are consistent with a two-component continuum: a high energy power law of slope and a low energy soft excess component with . Both components are absorbed by the WA and by the intrinsic neutral gas.
-
2.
The WA observed during the 6 weeks of ASCA observations in 1993 is consistent with being a single absorber with a column density of cm-2. Less conclusive results are obtained for the short timescales behavior due to the poor S/N. The data are consistent with a scenario in which the decrease in flux caused a corresponding decrease in the ionization parameter. Such a behavior has been suggested in the past for several other sources (e.g., MCG630 – the ASCA observation of Otani et al. 1996; NGC 3516 – the Chandra observation of Netzer et al. 2002). This interpretation is not unique and the data also supports a more complex case where the source luminosity is not simply correlated with the ionization parameter (e.g., MCG630 – Orr et al. 1997; NGC 3783 – Behar et al. 2003; Netzer et al. 2003)
-
3.
On timescales of years, the WA properties are different and our model requires that the absorbing gas properties are changing in time. For example, the ASCA 1996 observations clearly indicate a larger column density ( cm-2 vs. cm-2) and a smaller ionization parameter (log vs. ) absorber compared with the one observed in 1993. This could indicate new material entering our line-of-sight, between 1993 and 1996, adding to or replacing the earlier gas. The two groups of observations taken in 1996, that are separated by 5 months, are also not consistent with the notion of having the same WA. Comparing these two periods we find that the luminosity is about the same while the ionization parameter dropped by about a factor of 3. We suggest, again, a physical motion of the gas which resulted in a higher column density of material at about the same distance. Thus, a real change in the absorber properties can take place over time scales of only a few months.
The comparison of the 1993 ASCA observations and the 2002 XMM-Newton observation suggest a different change. In 2002, the AGN flux is smaller by a factor of 2 compared with 1993, yet the column density and the derived ionization parameter are about the same as in 1993. Similarly, a comparison between the two XMM-Newton observations indicates that the source luminosity decreased significantly from 2000 to 2002 yet the derived WA properties remained about the same. This might mean that the absorbing material properties have changed between the two epochs (the SED in both is very similar but the luminosity decrease between 2000 and 2002 was not accompanied by a corresponding decrease in ionization parameter). An alternative explanation is that the absorbing material is very far from the central source and of low enough density such that it did not respond to the continuum luminosity variations.
-
4.
The soft excess continuum luminosity is positively correlate with the hard continuum luminosity.
The overall picture which emerges from this study is of a changing absorber made of material that enters and disappear from the line-of-sight on timescales of several months. On shorter timescales, of several weeks, the models are consistent with a picture in which the absorbing material responds instantly to the continuum luminosity variations. Due to the data quality and the model complexity (two power laws and several absorbers) we cannot unambiguously determine those properties.
6.2. The “Neutral” Absorber
The 2002 XMM-Newton observation show the presence of a low-ionization/neutral absorber intrinsic to MR 2251178. We derived the column density of this gas ( cm-2) from the shape of the soft X-ray continuum below 0.6 keV. The RGS data show evidence for O III and O IV absorption lines which allow us to constrain its level of ionization (log).
Macchetto et al. (1990) find evidence for circumnuclear gas on distances between 3 and 6 kpc and of gaseous filaments farther out at distances of 30–50 kpc. Their lower limits on the [O III] density (e.g., their table 4) implies a column densities of cm-2. This is entirely consistent with the properties of the low ionization absorber found in our analysis. Thus, it is possible that the same gas responsible for the [O III] emission is detected in absorption via O III and O IV X-ray absorption lines. This means that parts of the emission line nebula observed in MR 2251178 lie in our line of sight to the central source.
6.3. Ultraviolet Emission and Absorption
This paper presents the first FUV spectrum of MR 2251178. We detect emission from O VI, N III, and C III. We also detect at least 4 absorption systems in O VI, C III, and H I, three of which are blended together. The three blended systems are best seen in C III (Figure 11b) and are definitely suggested in the other absorption lines (the main absorption system at km s-1 looks like 3 systems blended together, see Figure 11a).
The H I Lyman absorption lines are seen all the way to the Lyman edge (Figure 2). The lower series lines have similar EWs which suggests saturation. However, the lines are not completely black which means incomplete line of sight coverage.
Figure 11a demonstrate that the O VI absorption system with the largest blueshift might not be saturated since the depth of the 1038 Å line is about half the depth of 1032 Å, as expected from their oscillator strength ratios. On the other hand, the three blended absorption systems have the same depth in both lines of the O VI doublet, indicating that these systems are saturated. The similarity of the H I and the O VI absorption profiles suggests that all blended lines of the two ions are saturated and have the same covering fraction. Our spectral analysis indicates a covering factor between 60% and 90% for these systems.
The total depth in all the FUV and UV absorption lines is larger than the underlying continuum, thus the broad emission lines are absorbed by the UV absorber. This indicates that the UV absorber lies outside of the BLR. Using MR 2251178 continuum flux at 5100 Å ( erg cm-2 s-1 Å-1; Bergeron et al. 1983) and the relation between the BLR size and the object’s luminosity (equation 6 of Kaspi et al. 2000) we find the BLR size to be cm. We take this to be a lower limit on the distance of the UV absorber from the central black hole.
6.4. The Ultraviolet — X-ray Connection
Several studies suggested a link between the UV and X-ray absorber in AGNs (e.g., Mathur et al 1994; Mathur, Elvis, & Wilkes 1995; Shields & Hamann 1997; Crenshaw et al. 1999). The data presented in this paper enables us to study this connection in MR 2251178.
As explained, the resolution and S/N of the RGS spectrum does not allow the exact measurement of the X-ray absorption systems. We can only confirm that the velocity shifts and the FWHM of the UV absorption systems are consistent with the ones observed in the X-ray absorber. We found that the FUV absorption lines (in H I, C III, and O VI) are blends of at least 4 absorption systems, all blueshifted with respect to the emission line by 0 to -600 km s-1. The HST spectra (§ 5.2) show a Ly absorption line which is consistent with the FUSE H I absorption lines. It also shows a C IV absorption which has a width of 400 km s-1 and about the same blueshift range as seen in the FUV. The resolution of the RGS spectrum at 22 Å is 550 km s-1 hence any absorption lines which are similar in width to the UV absorption lines are predicted to be one pixel wide. In the X-ray spectrum we identify O III, O IV, and O V which are consistent with the widths and blueshifts of the UV absorption lines, as well as hints for absorption from O VI. We identify few absorption lines from highly ionized species with lines at wavelength shorter than 19 Å (see Table 4). Given the poor S/N, this is consistent with the absorption seen in the UV spectra. The consistency between the UV and X-ray absorption suggests that they could arise in the same gas.
We have set a lower limit of cm on the distance of the UV absorber from the source using the BLR distance. If the UV and X-ray absorptions are the same, this is also a lower limit on the distance of the X-ray absorber.
References
- Behar, Sako, & Kahn (2001) Behar, E., Sako, M., & Kahn, S. M. 2001, ApJ, 563, 497
- Behar et al. (2003) Behar, E., Rasmussen, A. P., Blustin, A. J., Sako, M., Kahn, S. M., Kaastra, J. S., Branduardi-Raymont, G., & Steenbrugge, K. C. 2003, ApJ, 598, 232
- Bergeron, Dennefeld, Boksenberg, & Tarenghi (1983) Bergeron, J., Dennefeld, M., Boksenberg, A., & Tarenghi, M. 1983, MNRAS, 202, 125
- Blustin et al. (2002) Blustin, A. J., Branduardi-Raymont, G., Behar, E., Kaastra, J. S., Kahn, S. M., Page, M. J., Sako, M., & Steenbrugge, K. C. 2002, A&A, 392, 453
- Cooke et al. (1978) Cooke, B. A. et al. 1978, MNRAS, 182, 489
- Condon et al. (1998) Condon, J. J., Cotton, W. D., Greisen, E. W., Yin, Q. F., Perley, R. A., Taylor, G. B., & Broderick, J. J. 1998, AJ, 115, 1693
- Crenshaw et al. (1999) Crenshaw, D. M., Kraemer, S. B., Boggess, A., Maran, S. P., Mushotzky, R. F., & Wu, C. 1999, ApJ, 516, 750
- den Herder (2002) den Herder, J. W. 2003, in the Proceedings of the Symposium on New Visions of the X-ray Universe in the XMM-Newton and Chandra Era, 26-30 November 2001, ESTEC, The Netherlands, in press
- Ganguly, Charlton, & Eracleous (2001) Ganguly, R., Charlton, J. C., & Eracleous, M. 2001, ApJ, 556, L7
- Halpern (1984) Halpern, J. P. 1984, ApJ, 281, 90
- Kaspi et al. (2000) Kaspi, S., Smith, P. S., Netzer, H., Maoz, D., Jannuzi, B. T., & Giveon, U. 2000, ApJ, 533, 631
- Kirsch (2003) Kirsch M. 2003, “XMM-EPIC status of calibration and data analysis”, XMM-SOC-CAL-TN-0018, http://xmm.vilspa.esa.es/docs/documents/CAL-TN-0018-2-1.pdf, p. 21
- Komossa (2001) Komossa, S. 2001, A&A, 367, 801
- Lockman & Savage (1995) Lockman, F. J. & Savage, B. D. 1995, ApJS, 97, 1
- Macchetto et al. (1990) Macchetto, F., Colina, L., Golombek, D., Perryman, M. A. C., & di Serego Alighieri, S. 1990, ApJ, 356, 389
- Mineo & Stewart (1993) Mineo, T. & Stewart, G. C. 1993, MNRAS, 262, 817
- Monier, Mathur, Wilkes, & Elvis (2001) Monier, E. M., Mathur, S., Wilkes, B., & Elvis, M. 2001, ApJ, 559, 675
- Morales & Fabian (2002) Morales, R. & Fabian, A. C. 2002, MNRAS, 329, 209
- Mathur, Elvis, & Wilkes (1995) Mathur, S., Elvis, M., & Wilkes, B. 1995, ApJ, 452, 230
- Mathur, Wilkes, Elvis, & Fiore (1994) Mathur, S., Wilkes, B., Elvis, M., & Fiore, F. 1994, ApJ, 434, 493
- Nandra et al. (1997) Nandra, K., George, I. M., Mushotzky, R. F., Turner, T. J., & Yaqoob, T. 1997, ApJ, 476, 70
- Netzer (1996) Netzer, H. 1996, ApJ, 473, 781
- Netzer, Turner, & George (1994) Netzer, H., Turner, T. J., & George, I. M. 1994, ApJ, 435, 106
- Netzer et al. (2002) Netzer, H., Chelouche, D., George, I. M., Turner, T. J., Crenshaw, D. M., Kraemer, S. B., & Nandra, K. 2002, ApJ, 571, 256
- Netzer et al. (2003) Netzer, H. et al. 2003, ApJ, 599, 933
- Netzer (2004) Netzer, H. 2004, ApJ, 604, 551
- Orr et al. (1997) Orr, A., Molendi, S., Fiore, F., Grandi, P., Parmar, A. N., & Owens, A. 1997, A&A, 324, L77
- Orr et al. (2001) Orr, A., Barr, P., Guainazzi, M., Parmar, A. N., & Young, A. J. 2001, A&A, 376, 413
- Otani et al. (1996) Otani, C. et al. 1996, PASJ, 48, 211
- Otani, Kii, & Miya (1998) Otani, C., Kii, T., & Miya, K. 1998, IAU Symp. 188: The Hot Universe, 188, 436
- Pan, Stewart, & Pounds (1990) Pan, H. C., Stewart, G. C., & Pounds, K. A. 1990, MNRAS, 242, 177
- Reeves & Turner (2000) Reeves, J. N. & Turner, M. J. L. 2000, MNRAS, 316, 234
- Reynolds (1997) Reynolds, C. S. 1997, MNRAS, 286, 513
- Ricker et al. (1978) Ricker, G. R., Clarke, G. W., Doxsey, R. E., Dower, R. G., Jernigan, J. G., Delvaille, J. P., MacAlpine, G. M., & Hjellming, R. M. 1978, Nature, 271, 35
- Shields & Hamann (1997) Shields, J. C. & Hamann, F. 1997, ApJ, 481, 752
- Turner, George, Nandra, & Turcan (1999) Turner, T. J., George, I. M., Nandra, K., & Turcan, D. 1999, ApJ, 524, 667
- Turner, Nandra, Turcan, & George (1998) Turner, T. J., Nandra, K., Turcan, D., & George, I. M. 1998, Abstracts of the 19th Texas Symposium on Relativistic Astrophysics and Cosmology, Eds.: J. Paul, T. Montmerle, and E. Aubourg (CEA Saclay)
- Wakker et al. (2003) Wakker, B. P. et al. 2003, ApJS, 146, 1
- Yaqoob et al. (2000) Yaqoob, T. & ASCATEAM, 2002, ASCA GOF Calibration Memo, ASCA-CAL-00-06-01, V1.0(06/05/00)