The (n,) cross sections of short-living -process branching points
Abstract
An experimental method to determine the (n,) cross section of short-living -process branching points using data of the inverse (,n) reaction is presented. The method was used to observe the branching point nucleus 95Zr because the elemental abundance patterns corresponding to this branching point cannot be reproduced by full stellar models and a possible error source is the neutron capture cross section of 95Zr. The analysis of the experiment is still under progress, we will outline the current status in this manuscript.
1 Introduction
The nucleosynthesis of the elements heavier than iron is today mainly explained by three processes: -, -, and -process. - and -process are based on neutron-capture reactions with adjacent -decays while the -process is governed by photodisintegration reactions such as (,n), (,p), or (,).
The distinction between - and -process is due to the different neutron densities involved. During -process nucleosynthesis is in the order of while typical -process sites deal with Beer (2000). Hence, the neutron capture rates are larger than typical -decay rates during -process nucleosynthesis (, : rapid). In the -process the situation is the other way round (, : slow) and the involved nuclei are close to the valley of -stability.
However even in a -prozess scenario, if the half-life is long enough and the neutron capture cross section high enough another neutron capture might take place and the path “branches” out. Therefore, these nuclides are called branching points of the -process. The branching ratio – i.e. how often each of the paths is taken – determines the corresponding elemental abundance patterns. Using a model for -process nucleosynthesis and knowing precisely the nuclear physics input (half-life and Maxwellian averaged capture cross section (MACS) at typical -process temperatures ) it is possible to determine the astrophysical parameters temperature and neutron density .
In the so-called classical approach temperature and neutron density are considered to be constant. Thus, three different components produced with different astrophysical parameters are needed to reproduce the observed abundances of -only nuclei: the weak component corresponds to mass numbers while the strong component only describes the termination of the -process path at lead and bismuth. In between these borders the isotopes belong to the so-called main -process Käppeler (1999). The abundances of -only isotopes that are not affected by a branching can be reproduced with a mean square deviation of about 3% using this simple model Käppeler et al. (1990).
A more realistic approach is a full stellar model, e.g. the AGB star model described in Ref. Lugaro et al. (2003a). These models need very precise nuclear physics input data to reproduce the -only abundances. Especially the MACS of several branching points hamper the reliability of the predictions: due to the lack of experimental data the theoretical predictions of the MACS sometimes show a broad spread (see Bao et al. (2000)).
A direct measurement of the MACS of the branching points is only possible if their half-lives are in the order of years (e.g. 147Pm with Reifarth et al. (2003)). In the case of short-living branching points with half-lives of about a dozen days or even less, adequate samples are not available. Thus, direct measurements are possible.
To solve this problem we have investigated an experimental method using the data of the inverse (,n) reaction as described in Section 2. Section 3 presents 95Zr focusing on astrophysical aspects as well as on the constraints of our experimental method for this nuclide. The present status of the analysis is summarized in Section 3.3. In Section 4 we describe the next step in the data evaluation.
2 Experimental method
The aim of our experimental method is to constrain the theoretical predictions of the MACS of short-living -process branching nuclei. Short-living under -process conditions denotes half-lives of about a dozen days or less, i.e. direct measurements are not possible due to the lack of adequate samples. Therefore, our method is based on data of the inverse (,n) reaction.
The first step is to measure the so-called energy-integrated cross section using the photoactivation technique:
| (1) |
with being the (,n) cross section and the experimental photon flux.
We use the monoenergetic electron beam provided by the S–DALINAC Richter (2000) to produce a continuous bremsstrahlung spectrum by fully stopping the beam in a thick rotating copper target. The spectrum ranges from to , so that of Eq. (1) equals . Due to the location of our setup directly behind the injector of the S–DALINAC, our maximum energy is limited to about presently Mohr et al. (1999). While the shape of is well known the absolute value has to be determined by a relative measurement with gold as a calibration standard.
After irradiating the targets the yield of the activation is measured by counting the -rays emitted in the decay of the produced radioactive nuclei with a HPGe-detector that is well-shielded against background by several layers of lead. The yield is proportional to the energy-integrated cross section with the constant of proportionality being explained in detail in Ref. Vogt et al. (2001).
Because the (,n) cross section of 197Au is known to behave like
| (2) |
near threshold Vogt et al. (2002), a predicted energy dependence of the target’s cross section can be normalized to the observed ratio by a correction factor for each measured energy . In doing so, either a parametrization or a theoretical calculation of can be used. If depends on the shape of is not accurately described (compare Eq. 1) and can not be used for the further procedure without modifications.
Although the photoactivation technique is very sensitive, several limitations concerning the activation reaction AX(,n)A-1X and the following decay of A-1X have to be taken into account. To test the energy dependece of the cross section it is necessary to measure at different energies . Because our present setup is limited to 10 MeV, isotopes with neutron thresholds cannot be checked.
If one wants to use naturally composed targets, the fraction of the isotope of interest must not be too small and the activation of other isotopes should not produce too much background radiation when the decay of A-1X is observed. To reach a good peak-to-background ratio in the measured spectra only a few -rays with high branchings should be emitted in the decay of A-1X. Furthermore, the analyzed -decays should not be part of a multi-level decay and their energies should not allow self-absorption in the target to avoid additional uncertainties in the analysis.
If the normalization of a theoretical prediction of yields a constant factor , we use to correct the MACS predicted in the same model with equal parameters. This second step of using the correction factor for the inverse reaction is based on the detailed balance assumption. In our case, scaling the MACS with a constant factor equals scaling the -ray strength function. For further discussion see Sonnabend et al. (2003a).
Although the corrected MACS is still based on a theoretical prediction, its value is constrained by experimental knowledge of the inverse reaction due to the determination of . Thus, it is more reliable than a value purely based on theory.
3 The branching point 95Zr
3.1 Position on the -process path
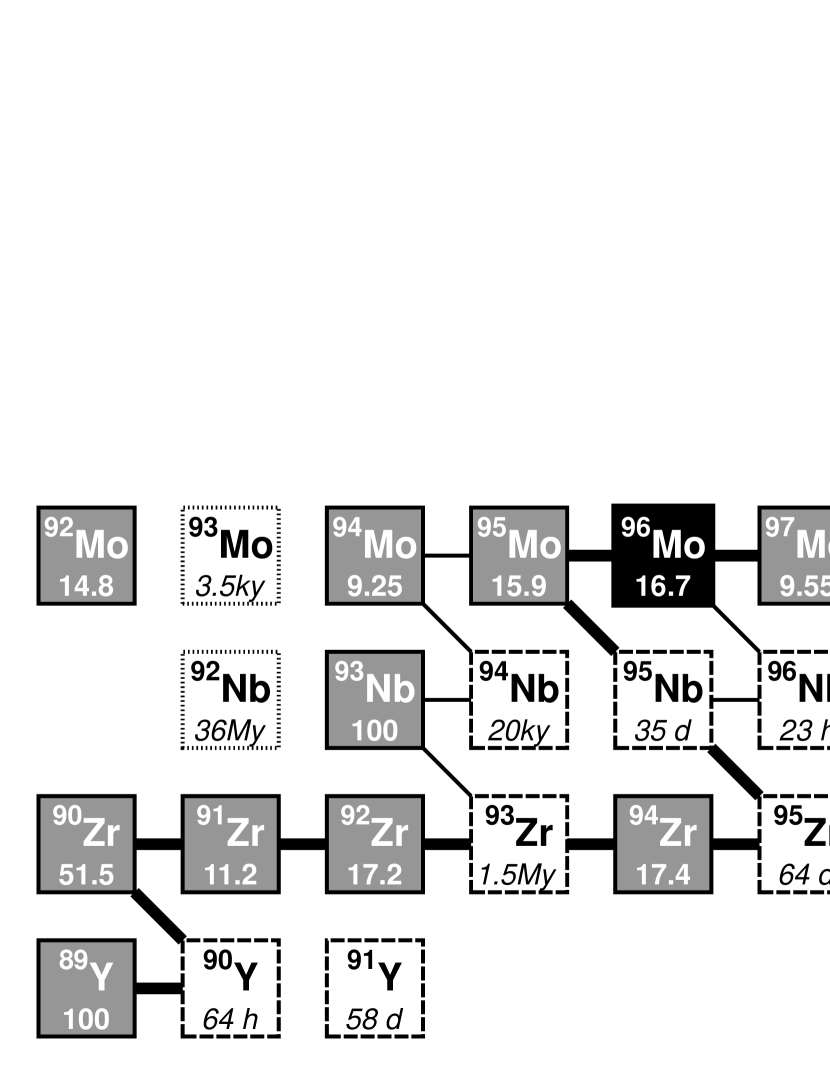
The branching point 95Zr is located near the borderline between the weak and the main component of the -process Käppeler (1999). Therefore, the prediction of the elemental abundance patterns corresponding to this branching is a crucial test for the validity of a full stellar model described in Lugaro et al. (2003a).
Several problems concering the prediction of the zirconium abundance patterns measured in SiC grains are reported in Ref. Lugaro et al. (2003b). The uncertainty in the predicted MACS of 95Zr is mentioned as one of the possible error sources due to the wide range of predicted values from 23 mb to 126 mb at (see Holmes et al. (1976), Toukan and Käppeler (1990), Rauscher and Thielemann (2000), and Goriely (2003)). Another reason for the deviation between the measured and predicted abundance patterns might be the uncertainty in the half-life of 95Zr at -process temperatures. However, as confirmed by a recent measurement Sonnabend et al. (2003b) the first excited level is at and thus, is not significantly populated at . Hence, the half-life of 95Zr does not depend on temperature under -process conditions and can be omitted as an error source because of its small error: ens (2003).
3.2 Constraints of the experiment
To use our experimental method the constraints described in Section 2 have to be fullfilled for the activation reaction 96Zr(,n)95Zr. The threshold of this reaction is , which can be easily reached at our setup providing energies up to 10 MeV. The abundance of 96Zr in a naturally composed target is 2.8% and thus, high enough for the activation method.
The properties of the decay of 95Zr are summarized in Fig. 2. The characteristics claimed in Section 2 are achieved for and .
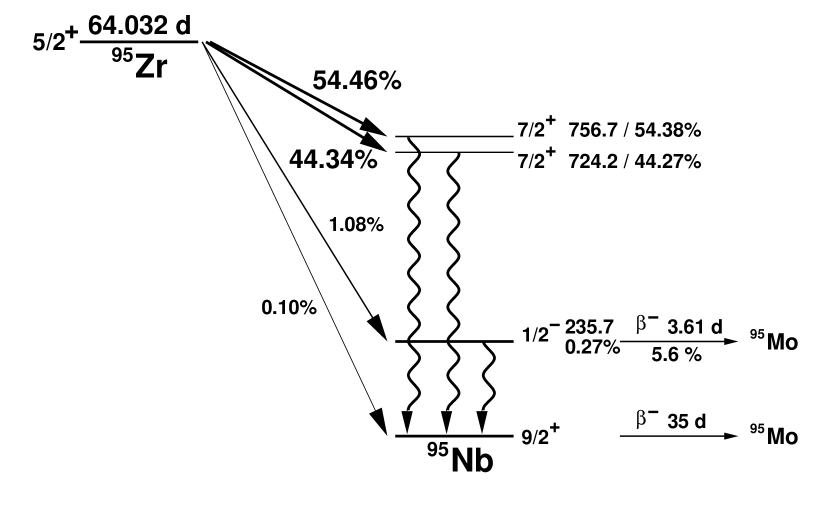
Due to the half-life of 95Zr of about 64 days it is mandatory to observe the decay for several hours to reach good statistics. During this time the -decay of the daughter nucleus 95Nb also starts to take place. The assignment of the measured -rays to the decays of 95Zr or 95Nb can either be done by a determination of the observed half-life or by comparing their different behaviour in time. As shown in Fig. 3 the ratio of the two peaks at 724.2 and 756.7 keV remains unchanged if the measurement takes place different times after activation. Thus, both lines correspond to the same decay and are identified to be the most prominent lines of the decay of 95Zr. In contrast, the peak at 765.8 keV becomes more and more dominant with time. This behaviour is consistent with the one expected of a line corresponding to the decay of the daughter nucleus 95Nb.

Actually, the energy is exactly the energy supposed for the most prominent line of this decay.
3.3 Current status of analysis
The photoactivation of zirconium has been done at six different energies ranging from 8325 to 9900 keV. The lower limit is due to the separation energy of the used calibration standard: . In a first approach, we used a parametrization that describes the energy dependence of the (,n) cross section near threshold:
| (3) |
In this case, the exponent changes the shape of the energy dependence, whereas the factor is responsible for the absolute value of . Therefore, corresponds to the correction factor of Section 2. Due to the fact that this parametrization is derived from the time reversal symmetry of (n,) and (,n) reactions, the exponent is connected to the wave-character of the emitted neutron: an exponent of corresponds to an -wave decay. Thus, exponents less than 0.5 cannot be explained in this basic approach.
However, if a least-mean-square-fit of our data to this parametrization is carried out using and as free parameters, we obtain and as shown in Fig. 4. The single results fluctuate around the mean value, thus, the overall energy dependence of seems to be described accurately.

The result can be explained by assuming a resonance on top of the smooth behaviour described by Eq. (3). We measure the energy integrated cross section and compare it with the result of Eq. (1) using of Eq. (3). Thus, we average the measured (,n) cross section over the energy interval ranging from to . A resonance in this energy region would yield the measured bigger .
The smaller , the steeper is the rise of the cross section at the threshold energy . Hence, the calculated becomes bigger and suits the measured value. Thus, we accept the derived values for and as a description of the mean energy dependence of the (,n) cross section: .

Fig. 5 shows the mean and a theoretical prediction of the (,n) cross section based on Hauser-Feshbach calculations Wolfenstein (1951); Hauser and Feshbach (1952).If the shapes of the two energy dependences are compared, a significant deviation is obvious: the theoretical prediction rises very steeply close to the threshold, but its slope becomes flatter 50 keV above threshold. In contrast, our parametrization is not so steep near threshold but more continuously rising.
Although the parametrization of describes only a mean energy dependence of the cross section, the different behaviour illustrates that the energy dependence of the theoretical prediction does not suit the data as well. Obviously, no resonances are predicted by theory. A correction factor , derived as explained in Section 2, is only a mean correction. can compensate the absence of resonances in theory. Furthermore, is a function of . Therefore, the MACS of 95Zr predicted by this theory cannot simply be corrected by this mean value of but the (n,) cross section must be corrected by before calculating the MACS. can be calculated weighting by . For this purpose, it is necessary to measure the (,n) cross section as close as possible to the reaction threshold to locate the position of the resonances.
So far, the experiment was limited by the threshold of the calibration standard. The lowest measured energy was i.e. still about 500 keV above the threshold of 96Zr. In order to measure as close as possible near the target’s threshold the neutron separation energy of a new calibration standard has to be lower.
In addition to a low neutron separation energy the calibration standard has to fullfill other characteristics: despite the general features mentioned in Section 2, the half-life of the produced radioactive isotope has to be short so that the counting can be done in short times with good statistics.
We decided to use 187Re with a neutron separation energy of only and a natural abundance of 62.6%. The half-life of the produced 186Re is and allows short measuring times although the branching of the two dominant -decays is quite low: with 9.42% and with 0.6%. Self-absorption in the rhenium target limits the amount of material, however, based on experience of former experiments Sonnabend et al. (2003a) very thin rhenium targets with a thickness of should provide enough activity after a typical activation.
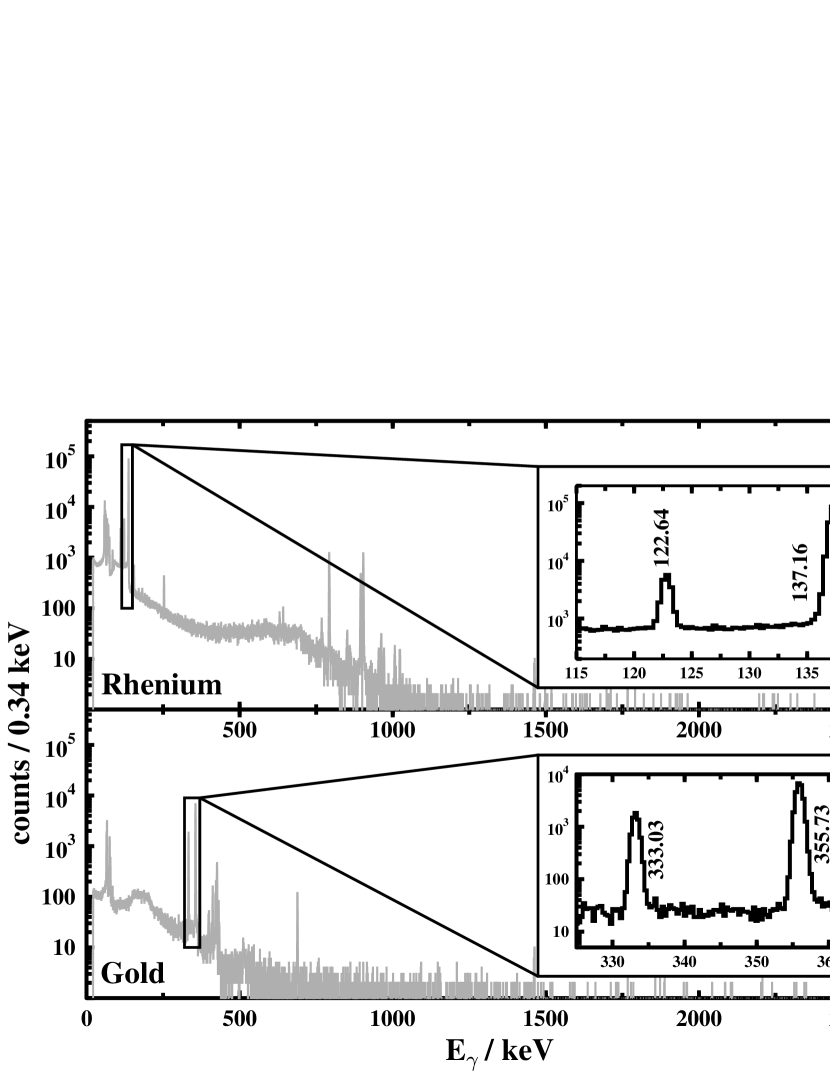
187Re was measured in May 2003 and the analysis is still under progress. Fig. 6 compares the spectra of rhenium and gold measured after an activation at . The upper panel shows the spectrum of rhenium measured for three hours directly after the activation. The peaks between 750 and 1000 keV correspond to the decay of 184Re that is produced by 185Re(,n). Due to these lines the two peaks of the decay of 186Re at and are located above a high background. However, as shown in the inlay the peak-to-background ratio of both lines is good enough to analyze the peak volumina with a low statistical error. For comparison the inlay in the lower panel shows the two most prominent lines of a gold spectrum also measured for three hours. The peak-to-background ratio is in the same order of magnitude.
4 Summary and Outlook
The precise knowledge of the (n,) cross section of the -process branching point 95Zr is a crucial input parameter to test the reliability of the AGB star model. Due to the very wide range of the theoretically predicted values a measurement observing the inverse reaction with the photoactivation technique was carried out at the S–DALINAC in June 2002.
During the analysis of the data several problems occured: The energy dependence of the (,n) cross section of 96Zr extracted from the data differs significantly from the theoretical prediction. In our opinion, the deviation is due to resonances that are not included in the used theory. Therefore, the experimental method described in Section 2 determines an energy dependent correction factor that cannot be used to correct the predicted MACS of 95Zr without further studies.
Hence, the experiment was extended in May 2003 by measuring the (,n) cross section of 96Zr closer to the reaction threshold. Therefore, a new calibration standard with lower neutron separation energy was measured during the same beam-time. The analysis of the new standard 187Re is still under progress, preliminary results like the spectrum shown in Fig. 6 are encouraging that it will work as well as our first standard 197Au.
Once a description of the (,n) cross section of 187Re near threshold is available the new data point of 96Zr taken at has to be added to the existing analysis. Therewith, the discrepancy between the experimental result and the theoretical prediction will hopefully disappear or at least become explainable. The outcome of the whole analysis that is the experimentally confirmed MACS of 95Zr can then be used in the AGB star model and might solve the problems in explaining the observed zirconium abundance patterns in SiC grains.
In future, we will take more data points at different energies in order to reduce difficulties due to resonances on top of the cross section. If the distance between two data points is smaller, the determination of the location of a resonance is possible with higher precision.
References
- Beer (2000) Beer, H., Encyc. Astron. Astroph. 2, 1866 (2000).
- Käppeler (1999) Käppeler, F., Prog. Part. Nucl. Phys. 43, 419 (1999).
- Käppeler et al. (1990) Käppeler, F., Gallino, R., Busso, M., Picchio, G., and Raiteri, C., Astrophys. J. 354, 630 (1990).
- Lugaro et al. (2003a) Lugaro, M., Herwig, F., Lattanzio, J., Gallino, R., and Straniero, O., Astrophys. J. 586, 1305 (2003a).
- Bao et al. (2000) Bao, Z. Y., Beer, H., Käppeler, F., Voss, F., Wisshak, K., and Rauscher, T., At. Data Nucl. Data Tables 76, 70 (2000).
- Reifarth et al. (2003) Reifarth, R., Arlandini, C., Heil, M., Käppeler, F., Sedyshev, P., Mengoni, A., Herman, M., Rauscher, T., and Gallino, R., Astrophys. J. 582, 1251 (2003).
- Richter (2000) Richter, A., Prog. Part. Nucl. Phys. 44, 3 (2000).
- Mohr et al. (1999) Mohr, P., Enders, J., Hartmann, T., Kaiser, H., Schiesser, D., Schmitt, S., Volz, S., Wissel, F., and Zilges, A., Nucl. Instr. and Meth. A 423, 480 (1999).
- Vogt et al. (2001) Vogt, K., Mohr, P., Babilon, M., Enders, J., Hartmann, T., Hutter, C., Rauscher, T., Volz, S., and Zilges, A., Phys. Rev. C 63, 055802 (2001).
- Vogt et al. (2002) Vogt, K., Mohr, P., Babilon, M., Bayer, W., Galaviz, D., Hartmann, T., Hutter, C., Rauscher, T., Sonnabend, K., Volz, S., and Zilges, A., Nucl. Phys. A707, 241 (2002).
- Sonnabend et al. (2003a) Sonnabend, K., Mohr, P., Vogt, K., Zilges, . A., Mengoni, A., Rauscher, T., Beer, H., Käppeler, F., and Gallino, R., Astrophys. J. 583, 506 (2003a).
- Lugaro et al. (2003b) Lugaro, M., Davis, A., Gallino, R., Pellin, M., Straniero, O., and Käppeler, F., Astrophys. J. 593, 486 (2003b).
- Holmes et al. (1976) Holmes, J., Woosley, S., Fowler, W., and Zimmermann, B., At. Data Nucl. Data Tables 18, 305 (1976).
- Toukan and Käppeler (1990) Toukan, K., and Käppeler, F., Astrophys. J. 348, 357 (1990).
- Rauscher and Thielemann (2000) Rauscher, T., and Thielemann, F.-K., At. Data Nucl. Data Tables 75, 1 (2000).
- Goriely (2003) Goriely, S., Nuclear astrophysics data base, http://www.astro.ulb.ac.be/Nucdata/ (2003).
- Sonnabend et al. (2003b) Sonnabend, K., Mohr, P., Zilges, A., Hertenberger, R., Wirth, H.-F., Graw, G., and Faestermann, T., Phys. Rev. C 68, 048802 (2003b).
- ens (2003) NNDC Online Data Service, ENSDF database, http://www.nndc.bnl.gov/nndc/ensdf/ (2003).
- Wolfenstein (1951) Wolfenstein, L., Phys. Rev. 82, 690 (1951).
- Hauser and Feshbach (1952) Hauser, W., and Feshbach, H., Phys. Rev. 87, 366 (1952).