Chandra Observations of Radio-Loud Quasars at :
X-rays from the Radio Beacons of the Early Universe
Abstract
We present the results of Chandra observations of six radio-loud quasars (RLQs) and one optically bright radio-quiet quasar (RQQ) at 4.1–4.4. These observations cover a representative sample of RLQs with moderate radio-loudness ( 40–400), filling the X-ray observational gap between optically selected radio-quiet quasars (predominantly –10) and the five known blazars at ( 800–27000), where = (rest frame). We study the relationship between X-ray luminosity and radio-loudness for quasars at high redshift and constrain RLQ X-ray continuum emission and absorption. From a joint spectral fit of nine moderate- RLQs observed by Chandra, we find tentative evidence for absorption above the Galactic , with a best-fit neutral intrinsic column density of cm-2, consistent with earlier claims of increased absorption toward high-redshift RLQs. We also search for evidence of an enhanced jet-linked component in the X-ray emission due to the increased energy density of the cosmic microwave background (CMB) at high redshift, but we find neither spatial detections of X-ray jets nor a significant enhancement in the X-ray emission relative to comparable RLQs at low-to-moderate redshifts. Overall, the 4–5 RLQs have basic X-ray properties consistent with comparable RLQs in the local universe, suggesting that the accretion/jet mechanisms of these objects are similar as well.
Accepted to AJ April 15, 2004
1 Introduction
The study of the universe has become a major theme in astronomy over the past decade. In particular, X-ray observations of quasars at reveal the physical conditions in the vicinities of the first massive black holes to form in the Universe. Prior to 2000, there were only six published X-ray detections of quasars at (see Kaspi, Brandt, & Schneider 2000; hereafter KBS00). In the last four years, through the unprecedented sensitivities of Chandra and XMM-Newton as well as optical wide-area surveys such as the Sloan Digital Sky Survey (SDSS; York et al. 2000), the number has risen to nearly one hundred.
Equally important are wide-area radio surveys, such as Faint Images of the Radio Sky at Twenty Centimeters (FIRST; e.g., Becker et al. 1995) and the NRAO VLA Sky Survey (NVSS; Condon et al. 1998), to constrain the properties of radio cores, jets, and lobes. Radio-selected samples of radio-loud quasars (RLQs), although sampling a minority of the total quasar population, are less prone to selection effects than optical surveys, as radio emission is not affected by absorption due to dust. The radio-loudness parameter, as defined by Kellermann et al. (1989), is given by = (rest frame), where quasars with are RLQs and those with are radio-quiet quasars (RQQs).
Some of the first quasars studied in X-rays were a small group of highly radio-loud blazars111 The term “blazar” is admittedly vague. As defined in §1.3 of Krolik (1999), blazars include BL Lacs and optically violently variable (OVV) quasars. Previous studies have suggested that four of the quasars discussed in this paper be granted blazar status (PMN 05253343, Worsley et al. 2004a; RX J10280844, Grupe et al. 2004; GB 14284217, Worsley et al. 2004b; GB 15085714, Yuan et al. 2003), and we tentatively place GB 17132148 (Vignali et al. 2003a) in the same category based on its extreme radio-loudness. ( 800–27000) in which the X-ray radiation is probably dominated by a jet-linked component. These blazars represent a minority of the RLQ population, however, and so are not suitable for representative statistical studies. Recently, Chandra’s Advanced CCD Imaging Spectrometer (ACIS) has obtained X-ray detections of many RQQs (predominantly with –10), which represent the majority population of quasars in the local universe and so too, apparently, at high redshift (e.g., Schmidt et al. 1995; Stern et al. 2000). Through these studies (e.g., Brandt et al. 2002; Vignali et al. 2001, 2003a,b), the basic X-ray properties of 4–5 RQQs have become reasonably well understood. Perhaps surprisingly, given the strong evolution of the quasar population (e.g., Boyle et al. 2000; Fan et al. 2001b), high-redshift RQQs have remarkably similar X-ray and broad-band properties to RQQs at low-to-moderate redshift (after controlling for luminosity effects; e.g., Vignali, Brandt, & Schneider 2003, hereafter VBS03), suggesting that the accretion mechanism does not dramatically evolve with time. Prior to the current paper, however, there were only four published X-ray detections of RLQs with 10–1000 corresponding to typical RLQs in the local universe (excluding the blazar PMN 05253343 which has ).
Here we report Chandra detections of six 4.1–4.4 radio-selected RLQs and one RQQ (FIRST 0747+2739) which is radio detected and optically bright. These objects have been selected as prime targets for X-ray observations based on their bright optical and radio fluxes, and they have been chosen to represent the majority population of RLQs. Four are FIRST-selected objects published in Benn et al. (2002), two are from the Cosmic Lens All Sky Survey (CLASS; Myers et al. 2003) published in Snellen et al. (2001), and one is from the SDSS, first presented in Anderson et al. (2001). Five of the RLQs have published detections at both 1.4 GHz and 5 GHz and have flat radio spectra with to 0.3 (). In the case of FIRST 13095733, the upper limit on the 5 GHz flux density gives , so it is possible that this object is also a flat-spectrum RLQ. None of the quasars shows any significant structure in the FIRST radio images (these are the best radio images available, with an angular resolution of ′′). While the RQQ FIRST 07472739 is relatively radio-weak compared to our other objects, it is one of the optically brightest quasars at , and an overabundance of C iv absorption in the optical spectrum suggests that it may be a transition Broad Absorption Line (BAL) quasar (Richards et al. 2002). Given that RLQs are often substantially X-ray brighter than RQQs with comparable optical luminosity (e.g., Zamorani et al. 1981; Worrall et al. 1987), these objects are prime targets for Chandra snapshot (e.g., 4–10 ks) observations. Indeed, all seven of our sources are detected with a minimum of 20 counts.
![[Uncaptioned image]](/html/astro-ph/0404543/assets/x1.png)
Radio loudness versus redshift for X-ray detected quasars at . The large symbols represent the moderate- RLQs (triangles), blazars (stars), and RQQs (circles). The filled symbols represent the quasars in the current sample. Arrows show upper limits for radio loudness at the level based on the 1.4 GHz radio flux density. Note that, excluding upper limits, the present sample more than doubles the number of objects with moderate radio-loudness ( 10–1000), filling the X-ray observational gap between the RQQs and the blazars.
This brings the total sample of X-ray detected RLQs to 15, more than doubling the number of moderately radio-loud quasars and filling the gap (as shown in Figure 1) between the many X-ray observations of RQQs and the extreme blazars.222 A regularly updated list of quasars with X-ray detections can be found at http://www.astro.psu.edu/users/niel/papers/highz-xray-detected.dat To date there are known RLQs; thus the objects in our sample comprise % of those known. Our targets have been drawn from surveys covering a significant fraction of the sky (6400 deg2, Snellen et al. 2001; 4030 deg2, Benn et al. 2002) and so are likely to be representative of RLQs as a whole, constituting the first set large enough to serve as a representative sample for reliable statistical evaluations of RLQ X-ray properties.
Recent work (e.g., Cirasuolo et al. 2003; Ivezić et al. 2002, 2004) has sparked new controversy over the existence of bimodality in the radio-loudness distribution of quasars, suggested first by Strittmatter et al. (1980). Current results suggest that, although quasars cover the full range of radio-loudness, the underlying distribution does consist of two regimes with a local minimum in between. As reported by Ivezić et al. (2002) for a sample of 3225 SDSS quasars matched to FIRST sources, of all quasars with 18.5 are radio-loud, apparently independent of optical luminosity or redshift, in the range . Figure 2 shows the radio-loudness distribution for quasars with radio detections or upper limits in FIRST, with the best-fit distribution from Ivezić et al. (2004) overlaid (dashed curve). While the blazars lie on the extreme radio-loud tail of the distribution, the RLQs from this work fall near the peak of the radio-loud regime, likely representing the majority population of RLQs. By integrating the best-fit curve directly, we find that our sample of RLQs with –400 is representative of % of the total RLQ population, while the blazars with represent % of all RLQs.
![[Uncaptioned image]](/html/astro-ph/0404543/assets/x2.png)
Radio-loudness distribution for known quasars with detections or upper limits in the FIRST survey. The solid histogram shows all quasars with radio detections, and the dotted histogram shows all those with radio upper limits. The dashed curve is adapted from the radio-loudness distribution in Ivezić et al. (2004), determined from a sample of objects detected by FIRST and SDSS (with arbitrary normalization). The objects in the current sample (hatched shading) represent the majority population of RLQs, while the blazars (solid shading) lie on the extreme radio-loud tail.
Throughout this paper we adopt =70 km s-1 Mpc-1 in a -cosmology with =0.3 and =0.7 (e.g., Spergel et al. 2003).
| Object | FIRST | FIRST | aafootnotemark: | X-ray | Exp. Time | ||
|---|---|---|---|---|---|---|---|
| Name | (arcsec) | Obs. Date | (ks) | Ref. | |||
| FIRST 07253705 | 4.33 | 07 25 18.26 | 37 05 18.3 | 0.2 | 2002 Dec 17 | 4.89 | (1) |
| FIRST 07472739 | 4.11 | 07 47 11.20 | 27 39 04.0 | 0.9 | 2002 Dec 03 | 4.96 | (1,3) |
| SDSS 08395112 | 4.39 | 08 39 46.20 | 51 12 02.9 | 0.3 | 2003 Jan 23 | 4.90 | (2,4) |
| CLASS J09180637 | 4.19 | 09 18 24.39 | 06 36 53.3 | 0.2 | 2002 Dec 10 | 4.90 | (2) |
| FIRST 13095733 | 4.27 | 13 09 40.69 | 57 33 10.0 | 0.4 | 2003 Jul 07 | 4.64 | (1) |
| CLASS J13251123 | 4.40 | 13 25 12.48 | 11 23 30.0 | 0.5 | 2003 Mar 02 | 4.70 | (2) |
| FIRST 14232241 | 4.32 | 14 23 08.24 | 22 41 58.2 | 0.2 | 2002 Dec 02 | 4.70 | (1) |
Note. —
Radio and optical identifications
of the quasars presented here
can be found in the papers cited in the reference column. Radio
positions are from the FIRST catalog (Becker et al. 1995). Units of right ascension are
hours, minutes, and seconds, and units of declination are degrees, arcminutes, and arcseconds.
a Distance between the radio and X-ray positions.
b The Chandra exposure time has been corrected for detector dead time.
References. — (1) Benn et al. 2002; (2) Snellen et al. 2001; (3) Richards et al. 2002; (4) Anderson et al. 2001.
2 Observations and Data Reduction
2.1 Chandra Observations and Basic Data Reduction
The X-ray observations were acquired by Chandra during Cycle 4, using the Advanced CCD Imaging Spectrometer (ACIS; Garmire et al. 2003) with the S3 CCD at the aimpoint. The observation log is reported in Table 1. Faint mode was used for the event telemetry format, and the ASCA grade 0, 2, 3, 4, and 6 events were used in the analysis. With one exception, the observations are free from background flares. A flare occurred near the end of the observation of SDSS 08395112, resulting in an increased background count rate (by a factor of ) for minutes. Due to the superb imaging capabilities of Chandra, this flare does not have a substantial effect on our data; the count rates used in deriving physical quantities have been background subtracted, and, especially since SDSS 08395112 is the X-ray brightest source of our sample, the additional background does not significantly affect our spectral analysis.
Source detection was carried out with wavdetect (Freeman et al. 2002). For each image, we calculated wavelet transforms (using a Mexican hat kernel) with wavelet scale sizes 1, 1.4, 2, 2.8, and 4 pixels. Those peaks whose probability of being false were less than the threshold of 10-5 were declared real. This threshold is entirely appropriate when, as is the case here, the source position of interest is specified a priori. The Chandra positions of the detected quasars lie within 0.2–0.9′′of their FIRST radio positions (see Table 1), consistent with the expected positional error. Source detection was performed in four energy ranges: the ultrasoft band (0.3–0.5 keV) , the soft band (0.5–2 keV), the hard band (2–8 keV) and the full band (0.5–8 keV). In the redshift range 4.1–4.4 for these objects, the full band corresponds to the 2.5–43 keV rest-frame band.
| X-ray Countsaafootnotemark: | |||||||
|---|---|---|---|---|---|---|---|
| Object | [0.3–0.5 keV] | [0.5–2 keV] | [2–8 keV] | [0.5–8 keV] | Hardness Ratiobbfootnotemark: | Band Ratiobbfootnotemark: | ccfootnotemark: |
| FIRST 07253705 | 21.2 | 4.9 | 26.1 | 0.62 | 0.23 | 2.1 | |
| FIRST 07472739 | 16.8 | 5.0 | 21.7 | 0.54 | 0.30 | 1.8 | |
| FIRST 13095733 | 24.8 | 6.9 | 31.7 | 0.57 | 0.28 | 1.8 | |
| FIRST 14232241 | 16.8 | 2.9 | 19.7 | 0.79 | 0.12 | 2.6 | |
| CLASS J09180636 | 5.0 | 41.6 | 13.7 | 55.4 | 0.50 | 0.33 | 1.8 |
| CLASS J13251123 | 23.7 | 6.8 | 30.6 | 0.55 | 0.29 | 1.8 | |
| SDSS 08395112 | 2.0 | 55.0 | 20.6 | 75.4 | 0.45 | 0.38 | 1.6 |
a Errors on the X-ray counts were computed according to Tables 1 and 2 of Gehrels (1986) and correspond to the 1 level; these were calculated using Poisson statistics. The upper limits are at the 95% confidence level and were computed according to Kraft, Burrows, & Nousek (1991).
b Errors on the hardness ratios [defined as , where is the soft-band (0.5–2 keV) counts and is the hard-band (2–8 keV) counts], the band ratios (), and the effective photon indices are at the level and have been computed following the “numerical method” described in 1.7.3 of Lyons (1991). This avoids the failure of the standard approximate variance formula when the number of counts is small (see 2.4.5 of Eadie et al. 1971).
c The effective photon indices (and errors) have been computed from the band ratios and their respective errors, using the PIMMS software. We have applied a time-dependent correction which accounts for the quantum-efficiency degradation of Chandra ACIS at low energies (see 3).
The wavdetect X-ray photometry is shown in Table 2. We have checked these results against manual aperture photometry and found good agreement between the two methods. Table 2 also lists the hardness ratios [defined as , where is the soft-band (0.5–2 keV) counts and is the hard-band (2–8 keV) counts], the band ratios , and the effective X-ray power-law photon indices () derived from these band ratios assuming Galactic absorption. This derivation has been performed using the Chandra X-ray Center Portable, Interactive, Multi-Mission Simulator (pimms; Mukai 2002) software, and we have applied a time-dependent correction for the quantum-efficiency degradation of Chandra ACIS at low energies (see 3 for details). All of the quasars have effective photon indices consistent, within the significant errors, with previous studies of RLQs at 0–2 ( 1.4–1.9; e.g., Reeves & Turner 2000). We also performed basic spectral analyses for all of the sources using the Cash statistic (Cash 1979) with xspec (Version 11.2.0; Arnaud et al. 1996) in the 0.5–8 keV band. We found general agreement between the two methods. Further spectral analysis is presented in 3.2.
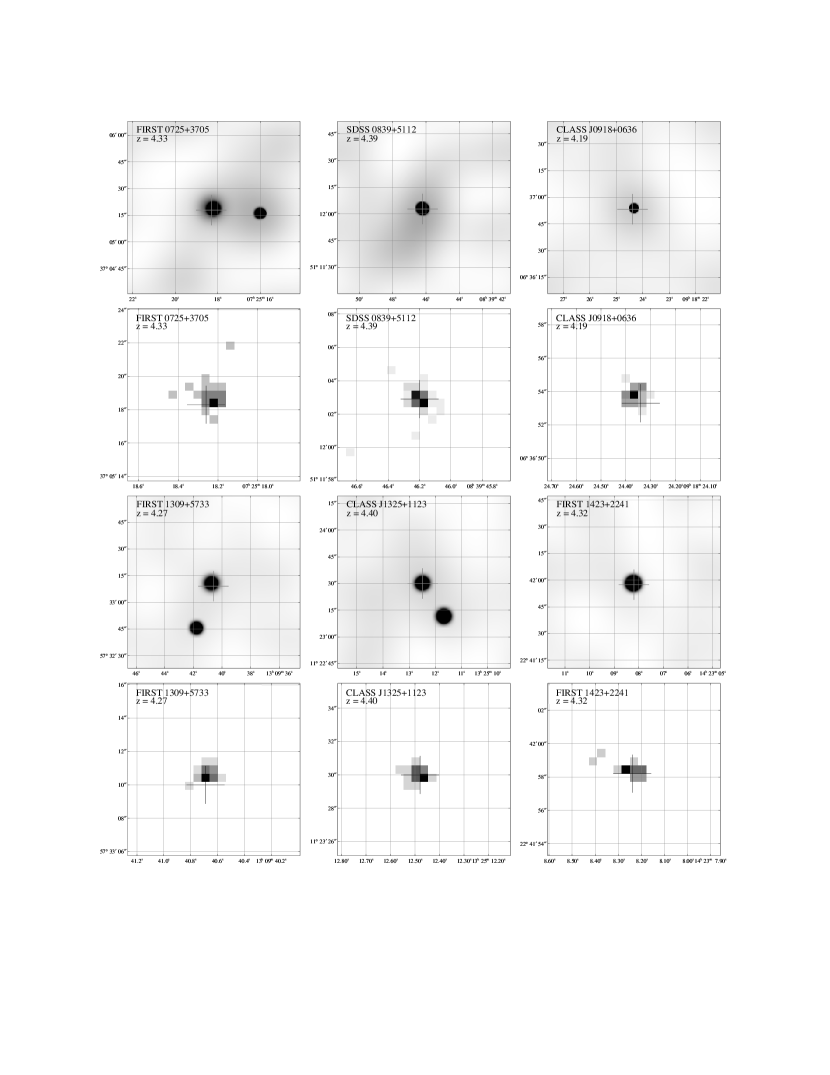
Figure 3 shows the soft-band images (chosen to give the best signal-to-noise ratio) of the six RLQs, both as raw 0.492′′ pixels and adaptively smoothed at the level using the algorithm of Ebeling, White, & Rangarajan (2004).
2.2 Companion X-ray Sources
Powerful X-ray jets have been observed emanating from many RLQs,333 A list of X-ray detected quasar jets is available at http://hea-www.harvard.edu/XJET/ and their presence has been inferred in high-redshift RLQs (particularly the blazars, in which the jet is presumably oriented close to the line of sight) from high luminosity and variability in both the X-ray and radio bands (e.g., Fabian et al. 1997, 1999). At high redshift such investigations are particularly interesting, since if a significant component of the X-ray radiation is a consequence of inverse Compton (IC) scattering of cosmic microwave background (CMB) photons, then the X-ray emission may be significantly enhanced (see 3.3 for details). Additionally, in the favored cosmological models, the angular size increases with redshift beyond such that the sub-arcsecond spatial resolution of Chandra is sufficient to resolve kpc-scale jets at all redshifts. Recently, X-ray jets have been discovered associated with the radio galaxy 4C41.17 (Scharf et al. 2003) and with the blazar GB 15085714 (Siemiginowska et al. 2003; Yuan et al. 2003). Schwartz (2004) also presents convincing evidence for the detection of an IC/CMB enhanced jet associated with the blazar GB 17132148 in a ROSAT HRI observation.
We have searched for possible companions and jets over a region of centered on each quasar (the same regions shown in the smoothed images in Fig. 3). At 4.1–4.4, 100′′ corresponds to a linear scale of kpc. In the seven fields, we found a total of three objects in the soft band, which can be seen in Fig. 3. None of these is sufficiently X-ray bright and close to our targets to contaminate their X-ray emission. The three serendipitous detections visible in Fig. 3 all have -band counterparts in the second Palomar Optical Sky Survey (POSS II) plates,444 Available at http://www.nofs.navy.mil/data/fchpix/ which probably precludes them from being companion objects to the quasars at high redshift. In addition, we detected a faint (3 counts) X-ray source in the hard (2–8 keV) band 34′′ to the southeast of SDSS 08395112, which appears to have faint counterparts in both the POSS II -band and FIRST images (no -band counterpart). However, since no counts were detected at its position in the soft band and jets typically have fairly soft X-ray spectra (–2.3; Harris & Krawczynski 2002), it appears unlikely that the source is a jet from SDSS 08395112.
As a further observational check, we compared the 0.5–2 keV cumulative number counts of the sources detected in the quasar fields (the targeted objects were, of course, excluded) with those presented by Moretti et al. (2003) using a compilation of six different surveys. The surface density of X-ray sources at our observed flux limit ( erg cm-2 s-1) is deg-2, consistent within the errors with the results (490 deg-2 at this flux limit) of Moretti et al. (2003). Thus we find no evidence for an excess of companion objects associated with our quasars.
2.3 X-ray Extension of the Quasars
To constrain the presence of either gravitational lensing (e.g., Wyithe & Loeb 2002; Comerford, Haiman, & Schaye 2002) or X-ray jets close to the sources, we performed an analysis of X-ray extension for all the quasars in the present sample. For each quasar, we created a point spread function (PSF) at 1.5 keV at the source position (using the CIAO tool MKPSF) normalized by the observed number of source counts. Then we compared the radial profile of this PSF with that of the source, finding agreement for each object. To identify a putative jet by this method, we require a minimum of nearby counts offset by from the core, corresponding to a distance of kpc at –4.4. We can exclude significant X-ray extension above this scale for the objects in the present sample.
2.4 X-ray Variability
Given tentative reports of increasing quasar X-ray variability with redshift (in the sense that quasars of the same X-ray luminosity are more variable at ; Manners, Almaini, & Lawrence 2002), we have searched for X-ray variability by analyzing the photon arrival times in the 0.5–8 keV band using the Kolmogorov-Smirnov (KS) test. While no significant variability was detected (the KS probabilities indicate that a constant hypothesis can only be rejected at the 22–92% level), we note that the analysis of X-ray variability for the quasars studied here is limited by both the short X-ray exposures in the rest frame ( 15 min; see Table 1) and the low X-ray fluxes of most of our quasars.
3 X-ray analysis
![[Uncaptioned image]](/html/astro-ph/0404543/assets/x4.png)


The principal X-ray, optical, and radio properties of the fifteen
RLQs with X-ray detections (including those detected prior
to this work) are given in Table 3.
A description is as follows:
Column (1). — The name of the source.
Column (2). — The redshift of the source.
Column (3). — The Galactic column density (from Dickey & Lockman 1990) in units of 1020 cm-2.
Column (4). — The monochromatic rest-frame magnitude (defined in 3b of Schneider et al. 1989), corrected
for Galactic extinction. When spectroscopically determined values
are not available, magnitudes have been derived from the
SDSS -magnitudes assuming the empirical relationship
. For objects without SDSS
detections, we used -band magnitudes from the APM Catalog
(McMahon et al. 2002) and the relationship
. We have compiled a list
of all quasars with similar photometry; this is used in
the analysis throughout this paper.555This list is available from
http://www.astro.psu.edu/users/niel/papers/papers.html All of the
above relationships provide reliable estimates
(within 0.1–0.2 mags)
in the redshift range under consideration.
Columns (5) and (6). — The 2500 Å rest-frame flux
density and luminosity. These were computed from the magnitude assuming an optical power-law slope of
( ; Vanden Berk et al. 2001). The 2500 Å rest-frame flux densities and luminosities
are increased by 15% for an optical power-law slope of
(e.g., Fan et al. 2001a)
as in Vignali et al. (2001, 2003a,b).
Column (7). — The absolute -band magnitude computed
assuming . If is adopted for
the extrapolation,
the absolute -band magnitudes are brighter by 0.35 mag.
Columns (8) and (9). — The observed count rate in the
0.5–2 keV band (for Chandra observations) and the
corresponding flux (), corrected for Galactic
absorption. This flux has been calculated using pimms and a
power-law model with , as derived for samples
of 0–2 RLQs (e.g., Reeves & Turner 2000); see
also 3.2. Changes of the photon index in the range
–1.9 lead to only a few percent change in the
measured X-ray flux. The soft X-ray flux derived from the
0.5–2 keV counts is generally similar (to within –15%) to that derived using the full-band (0.5–8 keV) counts.
The X-ray fluxes reported and used in this paper have been
corrected for the ACIS quantum-efficiency degradation at low energy using
the method described in . The
0.5–2 keV flux correction is 25% for the
Chandra observations presented here.
Columns (10) and (11). — The rest-frame 2 keV flux density and luminosity, computed assuming .
Column (12). — The 2–10 keV rest-frame luminosity, corrected for Galactic absorption.
Column (13). — The optical-to-X-ray power-law slope, , defined as
| (1) |
where and
are the rest-frame flux densities at 2 keV and 2500 Å,
respectively. The errors on have been
computed following the “numerical method” described in
1.7.3 of Lyons (1991). Both the statistical uncertainties on
the X-ray count rates and the effects of possible changes in the
X-ray ( 1.4–1.9) and optical
( 0.5 to 0.9; Schneider et al. 2001)
continuum shapes have been taken into account. Our choice of
and accounts for the slight
differences in , , and values
as compared to those in Vignali et al. (2001, 2003a,b).
Column (14). — The radio power-law slope (
) between 1.4 GHz and 5 GHz (observed
frame). The 1.4 GHz flux density is from FIRST or NVSS (Condon et
al. 1998), and the 5 GHz flux density is from the GB6 (;
Gregory et al. 1996) or PMN (; Griffith & Wright 1993) surveys.
Column (15). — The radio-loudness parameter defined by
Kellermann et al. (1989) as (rest frame). The rest-frame 5 GHz
flux density was computed from the FIRST or NVSS observed 1.4 GHz
flux density and the radio power-law slope given in column 14.
Where a 5 GHz detection was not achieved, we have assumed a flat
spectrum of to be consistent with the other
RLQs. The rest-frame 4400 Å flux density was computed
from the magnitude assuming an
optical power-law slope of .
Column (16). — Recent X-ray references.
3.1 X-ray – Optical Correlations

With nearly one hundred published X-ray detections of quasars at , the typical X-ray fluxes of 4–5 quasars are now well defined. Plots of X-ray flux versus magnitude are often constructed for distant quasars and are useful for planning future observations, as they reflect directly observable quantities. Figure 4a is such a plot, depicting the observed-frame 0.5–2 keV flux versus for quasars at with X-ray detections and upper limits. A strong correlation exists between these quantities, and the best-fit relationship derived in Vignali et al. (2003b) for RQQs is shown as a dotted line. It is immediately apparent that the RLQs in this sample (depicted as filled triangles) are generally brighter in X-rays than RQQs (circles) with comparable optical magnitudes, all lying above the best-fit relationship. The RQQ FIRST 07472739 (filled circle) lies below the best-fit.
Extending much earlier work, VBS03 found that the X-ray and broad-band properties of RQQs do not significantly evolve with redshift. VBS03 found that, independent of redshift in the range –6.3, the X-ray luminosities () of RQQs are highly correlated (9.3 in VBS03) with their ultraviolet (UV) luminosities (). These quantities are plotted for the X-ray detected quasars in Figure 4b, along with the best-fit relationship for RQQs from VBS03 (adapted for an optical slope of ). Clearly, the RLQs (triangles) lie significantly above the best-fit line for RQQs (circles), with systematically higher X-ray luminosities by a factor of . These are the same trends exhibited by samples of RLQs at low-to-moderate redshift, in which the additional X-ray emission is attributed to a jet-linked component. In general, the excess X-ray emission tends to correlate with radio-loudness (see, e.g., Figure 6), lending additional support to this interpretation. We further investigate the implications of these trends and the nature of the jet-linked X-ray emission in 3.3
3.2 Joint Spectral Fitting
To provide tighter constraints on the average X-ray spectral properties of RLQs, we have performed a joint spectral analysis of the nine moderate- (–400) RLQs observed by Chandra; these have an average redshift of . Three of these objects have been previously published: PSS 01210347, Vignali et al. (2003a); SDSS 02100018, Vignali et al. (2001); and SDSS 09135919, Vignali et al. (2003b). Source counts have been extracted from 2′′ radius circular apertures centered on the X-ray position of each quasar. The background has been taken from annuli centered on the sources, avoiding the presence of nearby faint X-ray sources. Only one object is characterized by low counting statistics (SDSS 09135919, which has 6 counts); all of the others have –80 counts in the 0.5–8 keV band. The sample does not appear to be biased by the presence of a few objects with atypically high signal-to-noise ratios (see Table 2), and the removal of any one of these objects does not produce significantly different results.
We have corrected each spectrum for the quantum-efficiency degradation of ACIS at low energies using the correction supplied via the Chandra Calibration Database (caldb), Version 2.26. While the degradation is not severe above keV, it could significantly affect estimates of X-ray absorption if not properly corrected. We have also repeated our analysis using the acisabs correction,666 See http://www.astro.psu.edu/users/chartas/xcontdir/xcont.html based on data from the external calibration source aboard Chandra (the caldb correction is derived from gratings data). Due to differences in the extrapolation of the time-dependent quantum efficiency between the models (see Marshall et al. 2004), the acisabs correction leads to fits with a slightly lower absorption column and photon index, but the results are generally consistent.
The joint spectral fitting of the nine unbinned quasar spectra was carried out using the Cash statistic (Cash 1979), which is well suited to low-count sources (e.g., Nousek & Shue 1989). Since the Cash statistic is applied to the unbinned data, it allows us to retain all available spectral information. We can also assign to each source its own Galactic absorption and redshift. The resulting joint spectrum (in the –40 keV rest-frame band), while derived from only counts, is reasonably good due to the extremely low background of Chandra (there are only background counts in all source cells). Errors in the following analysis are quoted at 90% confidence for one interesting parameter.
Fitting a power-law model with Galactic absorption using xspec, we find a good fit (shown in Figure 5) with an average photon index of . The fitted photon index is consistent with that derived using the band ratios for the six RLQs in Table 2, from which we obtain a weighted mean of . It is also consistent with previous studies of –4 RLQs (e.g., Brinkmann et al. 1997; Reeves & Turner 2000) which have found that core-dominated, flat-spectrum RLQs typically have 1.4–1.9.
To search for evidence of intrinsic X-ray absorption in the above sample of nine moderate- RLQs, we added to the joint spectral model a redshifted neutral absorption component (the xspec model zphabs) with the redshift set to that of each source. With this model, we find tentative evidence (90% confidence) for absorption in excess of the Galactic , with a best-fit value of cm-2 (errors at 90% confidence for one interesting parameter). This fit produces a somewhat higher photon index, , which is still consistent with the typical range for RLQs from above. The confidence contours in the – plane are shown in Figure 5.
From a large sample of ASCA observations, Reeves & Turner (2000) confirmed earlier suggestions by Cappi et al. (1997) and Fiore et al. (1998) of a significant – correlation for RLQs, finding that –4 RLQs have typical column densities of a few cm-2 (see their Figure 9). Also, for two of the blazars, strong intrinsic X-ray absorption (–1023 cm-2) has been suggested by spectral flattening at low energies: PMN 05253344 (Worsley et al. 2004a) and GB 14284217 (e.g., Fabian et al. 2001; Worsley et al. 2004b). Our findings are generally consistent with these claims and extend this result to the majority of RLQs with moderate radio-loudness (the average radio-loudness of the objects in the above samples is , while that for the present sample is ).
3.3 The Nature of the Jet-Linked Component
The enhanced radio and X-ray emission of RLQs in comparison to RQQs is usually attributed to a relativistic jet-linked component. For core-dominated, flat-spectrum RLQs, the majority of the X-ray emission is presumably from the small-scale jet close to the AGN, which, aided by Doppler boosting, accounts for the increased X-ray luminosities and flatter X-ray spectra of RLQs as a whole (e.g., Worrall et al. 1987; Wilkes & Elvis 1987). For more extended (kpc scale) X-ray jets, there has been considerable debate over the process responsible for the X-ray emission. In several cases, low optical luminosities, which preclude pure synchrotron emission from a single electron population, have led to synchrotron models with more complicated electron energy distributions (e.g., Stawarz et al. 2004) or models based on some form of IC scattering. In the case of IC emission, individual observations of X-ray jets lead to differing conclusions as to the primary source of IC seed photons (see Harris & Krawczynski 2002 for a review). The obvious choices are the synchrotron photons themselves (synchrotron self-Compton – SSC), UV photons from the accretion disk, or cosmic microwave background photons (IC/CMB); the relative importance of these sources may depend on factors such as the quasar’s environment, orientation, and the bulk relativistic motion of the jet. Both SSC and IC from UV photons produced in the AGN presumably dominate close to the core of the quasar, while IC/CMB may dominate at large distances. At high redshift IC/CMB is particularly relevant since, as pointed out originally by Rees & Setti (1968) and recently by Schwartz (2002), the cosmological decrease in surface brightness as is compensated for by a increase in the energy density of the CMB. Above –4, X-ray jets dominated by the IC/CMB process could even outshine their parent quasars (see Figure 2 of Schwartz 2002).
![[Uncaptioned image]](/html/astro-ph/0404543/assets/x8.png)
Broad-band spectral index versus radio-loudness () for samples of flat-spectrum RLQs at differing redshifts. The small circles represent the RLQs from the radio-selected sample of Brinkmann et al. (1997), at redshifts of –2 (filled circles) and –4 (open circles). The large symbols represent RLQs with X-ray detections and upper limits (downward pointing arrows). We see no significant evidence for X-ray enhancement of RLQs at high redshift, as both the moderate- RLQs (triangles) and the blazars (stars) fall well within the distribution of objects at lower redshift. The new Chandra observations from this paper are plotted as filled triangles.
As established in 3.1, our RLQs are times X-ray brighter than RQQs with comparable optical luminosity, so the X-rays we have detected appear to be largely from a jet-linked component. We do not, however, observe any evidence for spatially extended emission in the Chandra images (see 2.3), nor do the FIRST radio images show any obvious spatial structure (note that the sub-arcsecond angular resolution of Chandra is better than the ′′ resolution of the FIRST survey). In Figure 3.3 we have plotted the broad-band spectral index versus radio loudness for our observations of RLQs (triangles) along with the Brinkmann et al. (1997) sample of radio-selected flat-spectrum RLQs which spans the (solid circles) and –4 (open circles) redshift ranges. Although the number of moderately radio-loud RLQs in the Brinkmann et al. (1997) sample is limited, it is clear that the RLQs are comparable in their X-ray and broad-band properties to those at low-to-moderate redshift. The blazars (star symbols) also lie within the observed range of these parameters for comparable low-redshift objects. We have performed a similar comparison of our RLQs to the low-to-moderate redshift sample of flat-spectrum RLQs presented in Fig. 4 of Fabian et al. (1999) and reach the same conclusion.
Figure 6 has implications for jet X-ray emission mechanisms in RLQs. In particular, the observations provide evidence that the IC/CMB process does not dominate the total X-ray production of these objects; if it did, then the the arguments of Schwartz (2002) predict that these jets at should be as bright or brighter in X-rays than the quasar cores. Such an enhancement would lead to a systematic flattening of by 0.1–0.2 relative to comparable objects at low redshift, which we do not observe. Rather, it seems that the X-rays are probably made primarily on small scales where the quasar photon field dominates the CMB photon field. This is consistent with expectations for low-redshift flat-spectrum RLQs, where on small scales SSC and external IC scattering from AGN seed photons are thought to dominate.
Still, the question remains: if we believe that much of the X-ray emission from these objects is associated with a jet-linked component on small scales, then why do we not see the extended IC/CMB jet, which should be significantly enhanced by the increased energy density of the CMB at high redshift? Schwartz (2002) uses the jets from the quasars 3C 273 () and PKS 0637752 () as examples of IC/CMB jets (at projected distances of roughly 25 kpc and 75 kpc, respectively) that should outshine their parent quasars above . Both of these quasars have flat (core) radio spectra similar to those of our objects, and the predicted Chandra count rates of the cores as they would appear at (see Figure 2 of Schwartz 2002) of a few cts s-1 are consistent with our observations. However, 3C 273 and PKS 0637752 are more radio loud than our quasars by nearly an order of magnitude, with and 2200, and so it may be that differences in either orientation or intrinsic jet power may account for our observations.777 The lower radio loudnesses of our objects may indicate that they have jets directed along a larger angle to the line of sight, thus making it less likely to observe beamed IC/CMB X-rays, which require a fast jet close to the line of sight (e.g., Harris & Krawczynski 2002). However, the lower radio loudnesses may also result from differences in intrinsic jet power, and these effects are not easy to separate. But even in the case of the recently discovered X-ray jet from the blazar GB 15085714, where the IC/CMB process has been invoked (Siemiginowska et al. 2003; Yuan et al. 2003; Cheung 2004), we do not see such a dramatic enhancement. This jet only accounts for % of the quasar luminosity and was discovered in a Chandra observation with a lengthy (89 ks) exposure time. To test our sensitivity to detecting such jets, we randomly selected 800 s segments of the GB 15085714 data, chosen to have counts in the full 0.5–8 keV band, matching the average number of counts in our 5 ks Chandra snapshot observations. We analyzed these images following the procedure of 2.3 and did not find clear evidence for extent in any case. Inspecting the raw and adaptively smoothed images by eye, only in 10–20% of the fields could we observe hints of the jet. This is not surprising, as at % of the quasar luminosity we expect only 1–2 counts from the jet in each field. So if our moderate- RLQs have jets similar in nature to that of GB 15085714 (perhaps at a larger viewing angle to account for the difference in radio-loudness) then we would not expect to detect extended jets from these snapshot images.
Overall, from this preliminary sample, it appears that the small-scale jet components of flat-spectrum RLQs do not change significantly between redshifts 0 and 5. This result is broadly in accordance with recent studies (e.g., VBS03) which imply that the disk/corona components of RQQs do not significantly evolve with redshift in the range –5. Apparently, RLQ jets are also almost completely built-up systems at 4–5.
3.4 FIRST 07472739
Although the quasar FIRST 07472739 is radio-quiet (a faint detection in the FIRST survey gives a radio-loudness of ), it is one of the most optically luminous quasars at with (compare with Figure 1 of Vignali et al. 2003a). Richards et al. (2002) found an overabundance of C iv absorption systems in the spectrum of FIRST 07472739, with at least 14 independent absorption systems spanning a redshift range of longward of the Ly forest. They concluded that the absorption is most likely intrinsic to the quasar, resulting from multiple high-velocity absorption systems at the spatial, density, or temporal edge of a BAL region. FIRST 07472739 may be a quasar in the transition region between BAL and normal quasars.
From the Chandra observation of FIRST 07472739, we measure an observed-frame 0.5–2 keV flux of erg cm-2 s-1, from which we derive a rest-frame 2–10 keV luminosity of erg s-1 and an optical-to-X-ray spectral index of . Based on a significant correlation between C iv absorption and X-ray-weakness, Brandt, Laor, & Wills (2000) have suggested that X-ray absorption associated with a BAL-type outflow is the primary cause of X-ray-weakness in blue AGN, and recent results suggest that this is likely the case for quasars as well (see Vignali et al. 2003b and references therein). Despite its significant C iv absorption, FIRST 07472739 does not appear to be notably X-ray weak when compared to other highly luminous quasars (see, e.g., Figure 3 of Brandt, Schneider, & Vignali 2004). However, since we are sampling highly penetrating X-rays with rest-frame energies of 3–40 keV (and have a limited number of photons), the X-ray column density constraints are not tight. Spectral fitting as described in §3.2 indicates that intrinsic neutral absorption with cm-2 is consistent with our data. Of course, even larger column densities can be accommodated for ionized X-ray absorption (as is likely expected from the observation of C iv absorption). Thus, our results are at least consistent with expectations from Brandt et al. (2000), even if they cannot directly support these expectations.
4 Summary and Future Work
We have presented new Chandra detections of six RLQs and one RQQ at 4.1–4.4, thereby significantly enlarging the number of RLQs with X-ray detections. Our RLQ targets have moderate parameters of 40–400; they are more representative of the overall RLQ population than many of the high- () RLQs at previously studied in X-rays. Our main results are the following:
-
1.
Moderate- RLQs at have enhanced X-ray emission relative to RQQs of the same redshift and optical luminosity. The degree of enhancement, a factor of in X-ray luminosity, is consistent with that observed at low redshift for comparable objects and is presumably associated with a jet-linked emission component. As in the local universe, the X-ray-to-optical flux ratios of moderate- RLQs at are intermediate between those of RQQs and those of high- RLQs.
-
2.
Joint X-ray spectral analyses of moderate- RLQs show that, on average, their spectra can be fitted with a power-law model and Galactic absorption; the average best-fit power-law photon index of is consistent with that for comparable objects at low redshift. Adding an absorption component to the fit, we find tentative evidence (90% significance) for excess intrinsic X-ray absorption on average, and our best-fit estimate of the cold absorption column of cm-2 is consistent with previous claims of increased absorption toward high-redshift RLQs. The somewhat higher best-fit photon index of in this model is still consistent with previous estimates for RLQs at low redshift.
-
3.
We do not detect extended X-ray emission associated with jets from any of our RLQs, which, if dominated by the IC/CMB process as suggested, should be significantly enhanced at . If the jets in these objects are similar to the more modest X-ray jet recently discovered from the blazar GB 15085714 (which accounts for only % of the quasar X-ray luminosity), we expect that the jets are below the sensitivity limit of our snapshot observations.
-
4.
Overall, our data are consistent with the idea that the dominant X-ray production mechanisms of and RLQs are similar.
-
5.
Richards et al. (2002) suggested that an abundance of C iv absorption systems in the optical spectrum of FIRST 07472739 are intrinsic to the quasar and that it represents a class of objects in a transition phase between normal and BAL quasars. From our observations, FIRST 07472739 does not appear to be notably X-ray weak, but we cannot rule out neutral intrinsic absorption columns with cm-2.
Finally, several of the RLQs we have detected with Chandra are among the X-ray brightest non-blazars known at (see Figure 4a). These are prime targets for follow-up X-ray spectroscopy with XMM-Newton (with the caution that in some cases nearby bright sources may contaminate the results). Such spectroscopy can reveal if the majority population of RLQs at high redshift shows intrinsic X-ray absorption.
References
- (1) Anderson, S. F., et al. 2001, AJ, 122, 503
- (2) Arnaud, K. A. 1996, in ASP Conf. Ser. 101, Astronomical Data Analysis Software and Systems V, ed. G. Jacoby, & J. Barnes (San Francisco: ASP), 17
- (3) Becker, R. H., White, R. L., & Helfand, D. J. 1995, ApJ, 450, 559
- (4) Benn, C. R., Vigotti, M., Pedani, M., Holt, J., Mack, K.-H., Curran, R., & Sánchez, S. F. 2002, MNRAS, 329, 221
- (5) Boyle, B. J., Shanks, T., Croom, S. M., Smith, R. J., Miller, L., Loaring, N., & Heymans, C. 2000, MNRAS, 317, 1014
- (6) Brandt, W. N., Laor, A., & Wills, B. J. 2000, ApJ, 528, 637
- (7) Brandt, W. N., et al. 2002, ApJ, 569, L5
- (8) Brandt, W. N., Schneider, D. P., & Vignali, C. 2004, in ASP Conf. Series, AGN Physics with the SDSS, ed. G.T. Richards & P.B. Hall, in press (astro-ph/0310337)
- (9) Brinkmann, W., Yuan, W., & Siebert, J. 1997, å, 319, 413
- (10) Cappi, M., Matsuoka, M., Comastri, Al, Brinkmann, W., Elvis, M., Palumbo, G. G. C., & Vignali, C. 1997, ApJ, 478, 492
- (11) Cash, W. 1979, ApJ, 228, 939
- (12) Cheung, C. C. 2004, ApJ, 600, L23
- (13) Cirasuolo, M., Celotti, A., Magliocchetti, M. & Danese, L. 2003, MNRAS, 346, 447
- (14) Comerford, J. M., Haiman, Z., & Schaye, J. 2002, ApJ, 580, 63
- (15) Condon, J. J., Cotton, W. D., Greisen, E. W., Yin, Q. F., Perley, R. A., Taylor, G. B., & Broderick, J. J. 1998, AJ, 115, 1693
- (16) Dickey, J. M., & Lockman, F. J. 1990, ARA&A, 28, 215
- (17) Eadie, W. T., Drijard, D., & James, F. E. 1971, Statistical Methods in Experimental Physics, (Amsterdam: North-Hollad)
- (18) Ebeling, H., White, D. A., & Rangarajan, F. V. N. 2004, MNRAS, submitted
- (19) Elvis, M., Fiore, F., Wilkes, B. J., & McDowell, J. 1994, ApJ, 422, 60
- (20) Fabian, A. C., Brandt, W. N., McMahon, R. G., & Hook, I. M. 1997, MNRAS, 291, L5
- (21) Fabian, A. C., Celotti, A., Pooley, G., Iwasawa, K., Brandt, W. N., McMahon, R. G., & Hoenig, M. D. 1999, MNRAS, 308, L6
- (22) Fabian, A.C., Celotti, A., Iwasawa, K., Ghisellini, G. 2001, MNRAS, 324, 628
- (23) Fan, X., et al. 2001a, AJ, 121, 31
- (24) Fan, X., et al. 2001b, AJ, 121, 54
- (25) Fiore, F., Elvis, M., Giommi, P., & Padovani, P. 1998, ApJ, 492, 79
- (26) Freeman, P. E., Kashyap, V., Rosner, R., & Lamb, D. Q. 2002, ApJS, 138, 185
- (27) Garmire, G. P., Bautz, M. W., Ford, P. G., Nousek, J. A., & Ricker, G. R. 2003, Proc. SPIE, 4851, 28
- (28) Gehrels, N. 1986, ApJ, 303, 336
- (29) Gregory, P. C., Scott, W. K., Douglas, K., & Condon, J. J. 1996, ApJS, 103, 427
- (30) Griffith, M. R., & Wright, A. E. 1993, AJ, 105, 1666
- (31) Grupe, D., Mather, S., Wilkes, B., & Elvis, M. 2004, AJ, 127, 1
- (32) Harris, D. E., & Krawczynski, H., 2002, ApJ, 565, 244
- (33) Ivezić, Z., et al. 2002, AJ, 124, 2364
- (34) Ivezić, Z., et al. 2004, in ASP Conf. Series, AGN Physics with the SDSS, ed. G. T. Richards & P. B. Hall, in press (astro-ph/0310569)
- (35) Kaspi, S., Brandt, W. N., & Schneider, D. P. 2000, AJ, 119, 2031 (KBS00)
- (36) Kellermann, K. I., Sramek, R., Schmidt, M., Shaffer, D. B., & Green, R. F. 1989, AJ, 98, 1195
- (37) Krolik, J. H. 1999, Active Galactic Nuclei, (Princeton: Princeton University Press)
- (38) Lyons, L. 1991, Data Analysis for Physical Science Students, (Cambridge: Cambridge University Press)
- (39) Manners, J., Almaini, O., & Lawrence, A. 2002, MNRAS, 330, 390
- (40) Marshall, H. L., Tennant, A., Grant, C. E., Hitchcock, A. P., O’Dell, S., & Plucinsky, P. P. 2003, in Proceedings SPIE, vol. 5165 (astro-ph/0308332)
- (41) McMahon, R. G., White, R. L., Helfand, D. J., & Becker, R. H. 2002, ApJS, 143, 1
- (42) Moretti, A., Campana, S., Lazzati, D., & Tagliaferri, G. 2003, ApJ, 588, 696
- (43) Mukai, K. 2002, pimms Users’ Guide (Greenbelt: NASA/GSFC)
- (44) Myers, S. T., et al. 2003, MNRAS, 341, 1
- (45) Nousek, J. A., & Shue, D. R. 1989, ApJ, 342, 1207
- (46) Rees, M.J., & Setti, G. 1968, Nature, 219, 127
- (47) Reeves, J. N., & Turner, M. J. L. 2000, MNRAS, 316, 234
- (48) Richards, G. T., Gregg, M. D., Becker, R. H., & White, R. L. 2002, ApJ, 567, L13
- (49) Scharf, C., Smail, I., Ivison, R., Bower, R., Breugel, W., & Reuland, M. 2003, ApJ, 596, 105
- (50) Schmidt, M., van Gorkom, J. H., Schneider, D. P., & Gunn, J. E. 1995, AJ, 109, 473
- (51) Schneider, D. P., Schmidt, M., & Gunn, J. E. 1989, AJ, 98, 1951
- (52) Schneider, D. P., et al. 2001, AJ, 121, 1232
- (53) Schwartz, D. A. 2002, ApJ, 569, L23
- (54) Schwartz, D. A. 2004, in JENAM-2003 Symposium, Radio Astronomy at 70: from Karl Jansky to microjansky,” ed. L. Gurvits, S. Frey, & S. Rawlings, in press (astro-ph/0402303)
- (55) Siemiginowska, A., Smith, R. K., Aldcroft, T. L., Schwartz, D. A., Paerels, F., & Petric, A. O. 2003, ApJ, 598, L15
- (56) Snellen, I. A. G., McMahon, R. G., Dennett-Thorpe, J., Jackson, N., Mack, K.-H., & Xanthopoulos, E. 2001, MNRAS, 325, 1167
- (57) Spergel, D. N., et al. 2003, ApJS, 148, 175
- (58) Stawarz, L., Sikora, M., Ostrowski, M., & Begelman, M. C. 2004, ApJ, in press (astro-ph/0401356)
- (59) Stern, D., Djorgovski, S. G., Perley, R. A., de Carvalho, R. R., & Wall, J. V. 2000, AJ, 119, 1526
- (60) Strittmatter, P. A., Hill, P., Pauliny-Toth, I. I. K., Steppe, H., & Witzel, A. 1980, A&A, 88, L12
- (61) Vanden Berk, D. E., et al. 2001, AJ, 122, 549
- (62) Vignali, C., Brandt, W. N., Fan, X., Gunn, J. E., Kaspi, S., Schneider, C. P., & Strauss, M. A. 2001, AJ, 122, 2143
- (63) Vignali, C., Brandt, W. N., & Schneider, D. P. 2003, AJ, 125, 433 (VBS03)
- (64) Vignali, C., Brandt, W. N., Schneider, D. P., Garmire, G. P., & Kaspi, S. 2003a, AJ, 125, 418
- (65) Vignali, C., et al. 2003b, AJ, 125, 2876
- (66) Vignali, C., Brandt, W. N., & Schneider, D. P. 2004, in ASP Conf. Series, AGN Physics with the SDSS, ed. G. T. Richards & P. B. Hall, in press (astro-ph/0310659)
- (67) Wilkes, B. J., & Elvis, M. 1987, ApJ, 323, 243
- (68) Worrall, D. M., Tananbaum, H., Giommi, P., & Zamorani, G. 1987, ApJ, 313, 596
- (69) Worsley, M. A., Fabian, A. C., Turner, A. K., Celotti, A., & Iwasawa, K. 2004a, MNRAS, in press (astro-ph/0310366)
- (70) Worsley, M. A., Fabian, A. C., Celotti, A., & Iwasawa, K. 2004b, MNRAS, submitted (astro-ph/0403601)
- (71) Wyithe, S., & Loeb, A. 2002, Nature, 417, 923
- (72) Yuan, W., Fabian, A. C., Celotti, A., & Jonker, P. G. 2003, MNRAS, 346, L7
- (73) York, D. G., et al. 2000, AJ, 120, 1579
- (74) Zamorani, G., et al. 1981, ApJ, 245, 357