The 2dF Galaxy Redshift Survey
as a Cosmological Laboratory
Abstract
The 2dF Galaxy Redshift Survey (2dFGRS) of 230,000 redshifts of nearby () galaxies is now complete. It has allowed the 2dFGRS team and others to estimate fundamental cosmological parameters and to study galaxy intrinsic properties. Here we highlight three recent key results from the survey: (i) an upper limit of about 2eV on the total mass of the three neutrino flavours, and an intriguing reasonable fitting of the 2dFGRS power spectrum to a Mixed Dark Matter model without a Cosmological Constant, but with a low Hubble constant; (ii) the bimodality of the galaxy population in both spectral parameterisation and in colour; and (iii) the clustering of different galaxy types and evidence for relative stochastic biasing.
keywords:
dark matter-galaxies: clusters-galaxies:1 Introduction
Multifibre technology now allows us to measure redshifts of millions of galaxies. The Anglo-Australian 2 degree Field Galaxy Redshift Survey111The 2dFGRS Team comprises: I.J. Baldry, C.M. Baugh, J. Bland-Hawthorn, T.J. Bridges, R.D. Cannon, S. Cole, C.A. Collins, M. Colless, W.J. Couch, N.G.J. Cross, G.B. Dalton, R. DePropris, S.P. Driver, G. Efstathiou, R.S. Ellis, C.S. Frenk, K. Glazebrook, E. Hawkins, C.A. Jackson, O. Lahav, I.J. Lewis, S.L. Lumsden, S. Maddox, D.S. Madgwick, S. Moody, P. Norberg, J.A. Peacock, B.A. Peterson, W. Sutherland, K. Taylor. For more details on the survey and resulting publications see http://www.mso.anu.edu.au/2dFGRS/ (2dFGRS) measured redshifts for 230,000 galaxies selected from the APM catalogue. The survey is now complete and publically available. The median redshift of the 2dFGRS is , down to an extinction corrected magnitude limit of (Colless et al. 2001). A sample of this size allows large-scale structure statistics to be measured with very small random errors. In this review we summarize some recent results from the 2dFGRS on clustering and galaxy biasing. Comprehensive recent reviews are given by Colless (2003) and Peacock (2003).
2 The Power spectrum of 2dF Galaxies
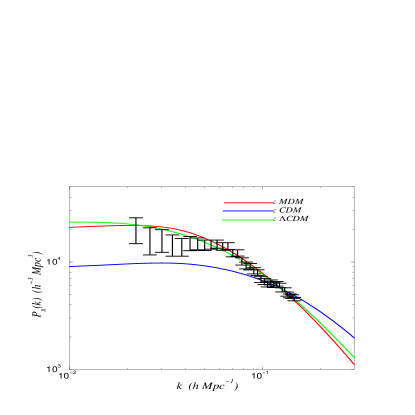
An initial estimate of the convolved, redshift-space power spectrum of the 2dFGRS has been determined (Percival et al. 2001) for a sample of 160,000 redshifts. On scales , the data are robust and the shape of the power spectrum is not affected by redshift-space or non-linear effects, though the amplitude is increased by redshift-space distortions. Percival et al. (2001), Efstathiou et al. (2002) and Lahav et al. (2002) compared the 2dFGRS and CMB power spectra, and concluded that they are consistent with each other.
A key assumption in deriving cosmological parameters from redshift surveys is that the biasing parameter, defined as the ratio of of galaxy to matter power spectra, is constant, i.e. scale independent. On scales of the fluctuations are close to the linear regime, and there are theoretical reasons (e.g. Fry 1996; Benson et al. 2000) to expect that on large scales the biasing parameter should tend to a constant and close to unity at the present epoch. This is supported by the derived biasing close to unity by combining 2dFGRS with the CMB (Lahav et al. 2002) and by the study of the bi-spectrum of the 2dFGRS alone (Verde et al. 2002).
The 2dFGRS power spectrum (Figure 1) was fitted in Percival et al. (2001) over the above range in , assuming scale-invariant primordial fluctuations and a -CDM cosmology, for four free parameters: , , and the redshift space . The amplitudes of the linear-theory rms fluctuations are traditionally labeled in mass in galaxies, defined on spheres. Assuming a Gaussian prior on the Hubble constant (based on Freedman et al. 2001) the shape of the recovered spectrum within the above -range was used to yield 68 per cent confidence limits on the shape parameter , and the baryon fraction , in accordance with the popular ‘concordance’ model (e.g. Bahcall et al. 1999). For fixed ‘concordance model’ parameters , and a Hubble constant , the amplitude of 2dFGRS galaxies in redshift space is (at the survey’s effective luminosity and redshift).
Recently the SDSS team presented their results for the power spectrum (Tegmark et al. 2003a,b; Pope et al. 2004), and they found good agreement with the 2dFGRS gross shape of the power spectrum. Pope et al. (2004) emphasize that SDSS alone cannot break the degeneracy between and because the baryon oscillations are not resolved given window function of the survey.
3 Upper limit on the neutrino mass
Solar, atmospheric, and reactor neutrino experiments have confirmed neutrino oscillations, implying that neutrinos have non-zero mass, but without pinning down their absolute masses. While it is established that the effect of neutrinos on the evolution of cosmic structure is small, the upper limits derived from large-scale structure could help significantly to constrain the absolute scale of the neutrino masses. Elgarøy et al. (2002) used the 2dFGRS power spectrum (Figure 1) to provide an upper limit , i.e. approximately 0.7 eV for each of the three neutrino flavours, or phrased in terms of their contribution to the matter density, .
The WMAP team (Spergel et al. 2003) reported an improved limit of (95% CL). However, we point out that neutrinos with eV masses are basically indistinguishable from cold dark matter at the epoch of last scattering, and therefore they have little effect on the CMB fluctuations. The main neutrino signature comes from the 2dFGRS and the Lyman forest which were combined with the WMAP data. The contribution of WMAP is that it constrains better the other parameters involved, e.g. (see also Hannestad 2003 and Tegmark et al. 2003b for similar results from SDSS+WMAP). Despite the uncertainties involved, it is remarkable that the results from redshift surveys give upper limits which are lower than those deduced from laboratory experiments, e.g. tritium decay.
As the suppression of the power spectrum depends on the ratio , Elgarøy & Lahav (2003) found that the out-of-fashion Mixed Dark Matter (MDM) model, with , and no cosmological constant, fits the 2dFGRS power spectrum well, but only for a Hubble constant . Blanchard et al. (2003) reached a similar conclusion, and they also found that the CMB power spectrum could be fit well by the same MDM model if one allows features in the primordial power spectrum. It is intriguing (and perhaps disappointing) that the CMB and redshift surveys cannot on their own (i.e. without a strong prior on the Hubble constant) ‘prove’ the existence a non-zero Cosmological Constant. Another consequence of this is that excluding low values of the Hubble constant, e.g. with the HST Key Project, is important in order to get a strong upper limit on the neutrino masses.
4 The bimodality of galaxy populations
Madgwick et al. (2002) have utilized the method of Principal Component Analysis (PCA) to compress each galaxy spectrum into one quantity, . It turns out that is a useful indicator of the star formation rate in a galaxy (Madgwick et al. 2003a). This allows us to divide the 2dFGRS into -types, and to study e.g. luminosity functions and clustering per type. Figures 2 and 3 show the bimodality in this spectral parameter and in the colour distribution (Peacock 2003), respectively. Bimodality is also seen clearly in the SDSS photometric and spectroscopic galaxy data (Blanton et al. 2003, Kauffmann et al. 2004). While the concept of two major galaxy populations in the Universe was recognized long time ago by Hubble and others, 2dFGRS and SDSS provide quantitative measures of the frequency distribution using objective physical measures like spectral features and colours. The details of these distribution functions pose challenges to models of galaxy formation, in particular regarding the role of feedback mechanisms and the ‘nature’ versus ‘nurture’ question.


5 Clustering per spectral type
Although galaxy biasing was commonly neglected until the early 1980s, it has become evident that on scales different galaxy populations exhibit different clustering amplitudes, the so-called morphology-density relation (e.g. Dresser 1980; Hermit et al. 1996). Biasing on small scales is also predicted in the simulations of hierarchical clustering from CDM initial conditions (e.g. Benson et al. 2000). It is important therefore to pay attention to the scale on which biasing operates.
Norberg et al. (2002) found that for galaxies, the real space correlation function amplitude of early-type galaxies is higher than that of late-type galaxies. Peacock et al. (2001), Hawkins et al. (2003) and Madgwick et al. (2003b) analysed the redshift space correlation function in terms of the line-of-sight and perpendicular to the line-of-sight separation for the entire galaxy populations, we well as for the most passively (‘red’) and actively (‘blue’) star-forming galaxies separately. The clustering properties of the two samples are quite distinct on scales . The ‘red’ galaxies display a prominent ‘finger-of-god’ effect and also have a higher overall normalization than the ‘blue’ galaxies. Figure 4 shows the real space correlation functions for the red and blue galaxies. While both are power laws, the slope is different, in accord with results for populations divided by colour in the SDSS (Zehavi et al. 2002). Understanding the difference in slope is another challenge for galaxy formation models.
Biasing could be non-linear and ‘stochastic’, in the sense that the number of galaxies predicted in a volume is not only a function of the mass fluctuation in that cell, but is possibly affected by other ‘hidden variables’ (Dekel & Lahav 1999). Wild et al. (2004) found recently evidence for a small amount stochasticity when considered a joint counts in cells of two galaxy populations defined by either colour or spectral type. The small amount of observed stochasticity supports the use of redshift surveys for measuring matter density fluctuations on large scales. However, the comparison with theory calls for better understanding of the ‘hidden variables’ in models of galaxy formation (e.g. Blanton et al. 2000; Somerville et al. 2001).

6 Discussion
The results presented above illustrate the power of redshift surveys to address fundamental issues in galaxy formation and Cosmology. These are only a few examples of the results from the 2dFGRS. Other results and papers are listed on the 2dFGRS website.
Overall, the results from 2dFGRS fit well into the ‘concordance’ model which has emerged from various cosmological data sets. The -CDM model with comparable amounts of dark matter and dark energy is rather esoteric, but it is remarkable that different measurements converge to the ‘concordance model’ with parameters. Perhaps the least accurate estimates on that list are for and (e.g. Bridle et al. 2003, Lahav & Liddle 2003). It is intriguing that an Einstein-de Sitter Mixed Dark Matter model (Cold+Hot dark matter) without a cosmological constant can also fit the data, but it requires a low Hubble constant and admittedly is at odds with the SN Ia, cluster baryon fraction and other cosmic measurements. It is however an illustration that other yet unknown models may fit the data equally well.
It may well be that in the future the cosmological parameters will be fixed by the CMB, SN Ia etc. Then, for fixed cosmological parameters, one can use redshift surveys primarily to study galaxy biasing and evolution with cosmic epoch.
7 Acknowledgements
I’d like to thank Joss Bland-Hawthorn and the ‘Tully 60’ conference organisers for the hospitality in Sydney. Many of us are grateful to Brent Tully for his numerous original and inspiring contributions to the exploration of the local universe.
I thank Sarah Bridle, Øystein Elgarøy, Pirin Erdogdu, Darren Madgwick, Vivienne Wild and members of the 2dFGRS and Leverhulme Quantitative Cosmology teams for their contribution to the work summarized here. The 2dF Galaxy Redshift Survey was made possible through the dedicated efforts of the staff of the Anglo-Australian Observatory. I also acknowledge a PPARC Senior Research Fellowship.
References
- (1) Bahcall N.A., Ostriker J.P., Perlmutter S., Steinhardt P.J., 1999, Science, 284, 148
- (2) Benson A.J., Cole S., Frenk C.S., Baugh C.M., Lacey C.G., 2000, MNRAS, 311, 793
- (3) Blanton M., Cen R., Ostriker J.P., Strauss M.A., Tegmark M., 2000, ApJ, 531, 1
- (4) Blanchard, A., Douspis, M., Rowan-Robinson, M., Sarker, S., 2003, A&A, 412, 35
- (5) Blanton, M. & the SDSS team, 2003, ApJ, 594, 186
- (6) Colless M., 2003, to appear in Carnegie Observatories Astrophysics Series, Vol.2: Measuring and Modeling the Universe, ed. W.L. Freedman, Cambridge University Press, astro-ph/0305051
- (7) Colless M. & the 2dFGRS team, 2001, MNRAS, 328, 1039
- (8) Dekel A., Lahav O., 1999, ApJ, 520, 24
- (9) Dressler A., 1980, ApJ, 236, 351
- (10) Efstathiou G. & the 2dFGRS team, 2002, MNRAS, 330, 29
- (11) Elgarøy, O. & the 2dFGRS team, Phys. Rev. Lett., 2002, 89, 061301
- (12) Elgarøy, O., Lahav, O., 2003, JCAP, 0304, 004
- (13) Freedman W.L., et al., 2001, ApJ, 553, 47
- (14) Fry J.N., 1996, ApJ, 461, L65
- (15) Hannestad S., 2003, astro-ph/0303076
- (16) Hawkins E. & the 2dFGRS team, 2003, MNRAS, 346, 78
- (17) Hermit S., Santiago B.X., Lahav O., Strauss M.A., Davis M., Dressler A., Huchra J.P., 1996, MNRAS, 283, 709
- (18) Kauffmann, G & the SDSS team, 2004, MNRAS, 341, 33
- (19) Lahav, O. & the 2dFGRS Team, 2002, ‘New Trends in Theoretical and Observational Cosmology’, The 5th RESCEU Symposium, Tokyo, Universal Academy Press, astro-ph/0205382
- (20) Lahav, O. & the 2dFGRS Team, 2002, MNRAS, 33, 961
- (21) Lahav, O., Liddle, A., 2003, Reviews of Particle Physics, in press
- (22) Madgwick D.S. & the 2dFGRS team, 2002, MNRAS, 333, 133
- (23) Madgwick D.S., Somerville, R., Lahav, O., Ellis, R.S., 2003a, MNRAS, 344, 871
- (24) Madgwick D.S. & the 2dFGRS team, 2003b, MNRAS, 344, 847
- (25) Norberg P. & the 2dFGRS team, 2002, MNRAS, 332, 827
- (26) Peacock J.A. & the 2dFGRS team, 2001, Nature, 410, 169
- (27) Peacock J.A., 2003, to appear in the proceedings of the 13th Annual October Astrophysics Conference in Maryland, ‘The Emergence of Cosmic Structure’, eds. S. Holt and C. Reynolds (AIP) ,astro-ph/0301042
- (28) Percival W.J. & the 2dFGRS team, 2001, MNRAS, 327, 1297
- (29) Pope, A. & the SDSS team, 2004, submitted to ApJ, astro-ph/0401249
- (30) Somerville R., Lemson G., Sigad Y., Dekel A., Colberg J., Kauffmann G., White S.D.M., 2001, MNRAS, 320, 289
- (31) Spergel, D.N. & the WMAP team, 2003, ApJ Supp, 148, 175
- (32) Tegmark M. & the SDSS team, 2003a, submitted to ApJ, astro-ph/0310725
- (33) Tegmark M. & the SDSS team, 2003b, submitted to ApJ, astro-ph/0310723
- (34) Verde L. & the 2dFGRS team, 2002, MNRAS, 335, 432
- (35) Wild, V. & the 2dFGRS team, 2004, astro-ph/0404275
- (36) Zehavi I. & the SDSS team, 2002, ApJ, 571, 172