On the source of the late-time infrared luminosity of SN 1998S and other type II supernovae
Abstract
We present late-time near-infrared (NIR) and optical observations of the type IIn SN 1998S. The NIR photometry spans 333–1242 days after explosion, while the NIR and optical spectra cover 333–1191 days and 305–1093 days respectively. The NIR photometry extends to the -band (4.7 m), making SN 1998S only the second ever supernova for which such a long IR wavelength has been detected. The shape and evolution of the H and He i 1.083 m line profiles indicate a powerful interaction with a progenitor wind, as well as providing evidence of dust condensation within the ejecta. The latest optical spectrum suggests that the wind had been flowing for at least 430 years. The intensity and rise of the continuum towards longer wavelengths together with the relatively bright and magnitudes shows that the NIR emission was due to hot dust newly-formed in the ejecta and/or pre-existing dust in the progenitor circumstellar medium (CSM). The NIR spectral energy distribution (SED) at about 1 year is well-described by a single-temperature blackbody spectrum at about 1200 K. The temperature declines over subsequent epochs. After 2 years the blackbody matches are less successful, probably indicating an increasing range of temperatures in the emission regions. Fits to the SEDs achieved with blackbodies weighted with or emissivity are almost always less successful. Possible origins for the NIR emission are considered. Significant radioactive heating of ejecta dust is ruled out, as is shock/X-ray-precursor heating of CSM dust. More plausible sources are (a) an IR-echo from CSM dust driven by the UV/optical peak luminosity, and (b) emission from newly-condensed dust which formed within a cool, dense shell produced by the ejecta shock/CSM interaction. We argue that the evidence favours the condensing dust hypothesis, although an IR-echo is not ruled out. Within the condensing-dust scenario, the IR luminosity indicates the presence of at least 10-3 M⊙ of dust in the ejecta, and probably considerably more. Finally, we show that the late-time evolution of type II supernovae may provide a useful tool for determining the presence or absence of a massive CSM around their progenitor stars.
keywords:
supernovae: individual: SN 1998S - supernovae: general - infrared: stars - circumstellar matter - dust - winds1 Introduction
One of the challenges of supernova research is to obtain evidence
about the nature and environment of the progenitor. Type IIn
supernovae (SNe IIn) are so-called because of the presence of narrow
lines in the spectra, originating in a relatively undisturbed
circumstellar medium (CSM) (Schlegel 1990). The progenitors must
therefore have undergone one or more mass-loss phases before
explosion. By using the interaction of the supernova explosion with
the resulting CSM we can obtain clues about the nature of the
progenitor.
The study of SNe IIn may also help us to understand the origin of dust
in the universe. More than 30 years ago, it was suggested (Cernuschi,
Marsicano & Kimel 1965; Cernuschi, Marsicano & Codina 1967; Hoyle &
Wickramasinghe 1970) that supernovae could be important sources of
interstellar dust. More recent studies of the origins of grains (Gehrz
1989; Tielens 1990; Dwek 1998; Todini & Ferrara 2001; Nozawa et
al. 2003) still invoke core-collapse SNe as significant contributors
of dust to the interstellar medium in the past and present. Dust
grains associated with SNe can be detected both via their attenuation
effects on optical/near-IR radiation, and by their thermal
re-radiation at longer IR wavelengths of the absorbed
energy. Observation of attenuation provides a relatively unambiguous
way of demonstrating grain condensation in the ejecta. This process is
revealed by the relative suppression of the red wings of the broad
spectral lines. However, apart from SN 1998S (Leonard et al. 2000;
Gerardy et al. 2000; this work), only for two events, SN 1987A and
SN 1999em, has the condensation of dust in the ejecta been
demonstrated via the attenuation of the red wing of the line profiles
(Danziger et al. 1991; Lucy, Danziger & Gouiffes 1989; Lucy et
al. 1991; Elmhamdi et al. 2003).
The second method of demonstrating grain condensation via the
appearance of strong IR radiation (an ‘IR excess’) as a supernova
ages, is more challenging. At least 10 SNe have shown a strong,
late-time (i.e. d) NIR excess (relative to that expected by
extrapolation from the optical region; see references in Gerardy et
al. 2002). The natural interpretation is that this radiation is
produced by hot dust. However, while such grains may be the result of
condensation processes in the expanding SN ejecta, they may also have
formed in pre-explosion circumstellar material ejected during one or
more mass-loss episodes experienced by the progenitor star. In this
latter case, the IR emission is produced as an “IR echo” of the
maximum-light luminosity from the CSM dust. Thus, in the
interpretation of such strong NIR emission from SNe, a key issue is
the location of the source. Only in the case of SN 1987A has
conclusive evidence for dust condensation in the ejecta been presented
on the basis of the NIR and mid-IR emission (Moseley et al. 1989;
Whitelock et al. 1989; Suntzeff & Bouchet 1990; Dwek 1991; Lucy et
al. 1991; Dwek et al. 1992; Meikle et al. 1993; Roche, Aitken & Smith
1993; Colgan et al. 1994). Recently, Dunne et al. (2003) have
presented evidence based on sub-mm observations that
of cold dust is present in the supernova remnant
(SNR) Cassiopeia A. They argue that the dust must have been produced
during the explosion. A similar result for the Kepler SNR was
presented by Morgan et al. (2003) although in this case an alternative
CSM origin for the dust was not ruled out, which would be more
consistent with the most commonly believed origin for this supernova,
i.e. a type Ia explosion. Such sub-mm studies may provide important
support for the hypothesis that supernovae are a major source of dust.
However, at the moment they have the disadvantages that the supernova
types are uncertain, and that the number of examples which can be
studied in this way is quite small. In addition, the results of Dunne
et al. (2003) and Morgan et al. (2003) have been criticised by Dwek
(2004) who points out that, given the mass of condensible elements
expected in the ejecta, a very unlikely condensation efficiency of
100% would be required to yield even 2 M⊙ of dust. Moreover
thermal sputtering would reduce this mass of dust. Dwek offers an
alternative scenario where the sub-mm emission is from conductive
needles (”metallic whiskers”) which may be long enough to be very
efficient emitters at sub-mm wavelengths thus requiring a dust mass of
no more than M⊙ to account for the observed
radiation.
Lastly, we note that the unique wavelength and temporal coverage of
SN 1987A also made it possible to infer dust condensation from (a)
spectroscopic evidence for the temporal depletion of gaseous-phase
elements in the ejecta e.g., [0 i] (6300, 6364 Å), [Mg i] (4571 Å), Si i (1.2 m), [Si i] (1.65 m)
and [Ca ii] (7300 Å) (Lucy et al. 1991; Spyromilio et
al. 1991; Meikle et al. 1993), and (b) analysis of the luminosity
budget of the ejecta (e.g. Whitelock et al. 1989). As observing
facilities improve, these last two methods of dust detection may
eventually be applicable to SNe at more typical distances.
To provide conclusive evidence of SNe as major dust sources, we need
to assemble a statistically significant sample of typed supernovae in
which grain formation can be reliably tested. In addition, by studying
the evolution of recent supernovae in real time we can obtain
information about the physics of the dust-formation process. In order
to disentangle the two possible origins of the NIR radiation, it is
vital to acquire IR observations spanning as wide a wavelength and
temporal range as possible. The longer NIR wavelengths ( bands)
are especially important since the flux at these wavelengths is less
likely to be contaminated by scattered light or strong H, He emission
lines, allowing a simple thermal interpretation.
An opportunity to address both the progenitor problem and the question of supernovae as dust sources was provided by the occurrence of the SN IIn 1998S. This is the most intensively-studied type IIn event (Bowen et al. 2000; Fassia et al. 2000, 2001; Gerardy et al. 2000, 2002; Leonard et al. 2000; Lentz et al. 2001; Liu et al. 2000; Roscherr & Schaefer 2000; Anupama, Sivarani & Pandey 2001; Chugai 2001; Wang et al. 2001; Chugai et al. 2002; Gruendl et al. 2002; Li et al. 2002; Pooley et al. 2002; Meikle et al. 2003).
1.1 SN 1998S at early epochs
SN 1998S is one of the brightest SN IIn ever seen, reaching
on 1998 March 18 (Fassia et al. 2000). It was discovered
by Z. Wan (Li & Wan 1998) on 1998 March 2.68 UT (JD 2,450,875.18) in
NGC 3877, an edge-on Sc spiral galaxy. The supernova lies about 16”
west and 46” south of the galaxy nucleus (see Fig. 1). It was
identified as a SN IIn by Filippenko & Moran (1998). Liu et
al. (2000) point out that the light curves together with the
spectroscopic behaviour at 2–3 months are similar to those of the
type IIL SN 1979C. Hamuy (2003) suggests that SNe IIn are
actually a subset of what he terms “dense wind” type II supernovae
which includes SN 1979C. A pre-discovery limiting magnitude of
+18 obtained on 1998 February 23.7 (Leonard et al. 2000)
indicates that SN 1998S was discovered within a few days of shock
breakout. Following Chugai (2001) we adopt 1998 February 24.7 UT = JD
2,450,869.2, 6 days prior to discovery, as the explosion epoch,
days. Relative to this epoch, the zero epochs adopted by other
authors are later by, respectively, +5 days (Leonard et al. 2000),
+6 days (Fassia et al. 2000, 2001; Pooley et al. 2002), +23 days
(Bowen et al. 2000; Gerardy et al. 2000, 2002). Throughout this
paper, epochs quoted from other authors have been shifted to our zero
epoch definition. We adopt a distance of 17 Mpc (Tully 1988), but
note that a smaller value of 15.5 Mpc is sometimes adopted (Sanders &
Verheijen 1998; Gerardy et al. 2002).
The earliest optical spectra of SN 1998S show a blue continuum with
emission features superimposed. A rough blackbody fit yields
T25,000 K, but with a blue excess (Leonard et al. 2000; Fassia
et al. 2001). The emission lines are identified with H i
(Balmer series), He i, He ii, C iii and N iii. The high-ionisation carbon and nitrogen lines are also commonly
observed in Wolf-Rayet stars (Leonard et al. 2000). The emission lines
have a broad base (e.g., H FWZI20,000 km s-1), but
a narrow ‘peaked’ unresolved centre. The lines are symmetrical about
the local standard of rest. This is quite surprising since at such an
early phase most of the receding part of the supernova should be
occulted by the photosphere. However, this may actually constitute
some of the earliest evidence of a strong ejecta-CSM wind interaction.
It has been shown theoretically that, at this phase, one might expect
the photosphere to reside in a geometrically thin, opaque cool dense
shell (CDS) formed by the radiative shock propagating into the
extended stellar envelope (Grasberg, Imshennik & Nadyozhin 1971; Falk
& Arnett 1977; Chevalier & Fransson 1985; 1994). Chugai (2001) has
argued that these lines originate from the CDS and that the line
broadening is caused by the multiple Thomson scattering of line
photons on thermal electrons of the circumstellar gas. The weakness
of broad ejecta lines during this early era is attributed to the sharp
photosphere at the SN ejecta boundary. The blue excess can also be
attributed to the CDS, since the significant optical depth can yield
an increase in continuum absorptive opacity with wavelength, due to
both bound-free, (i.e., the Paschen continuum) and free-free processes
(Leonard et al. 2000).
By about 3 weeks after the explosion, the emission lines had almost
totally vanished. This disappearance is attributed to the dense
inner-CSM being overrun by the ejecta. This persisted for 3–7
weeks. During this time weak narrow lines are present, superimposed on
the continuum. These are caused by the photoionization and heating of
the undisturbed wind by the supernova flash and subsequent X-ray
emission from the shocked wind and ejecta. High-resolution echelle
spectra of these lines were obtained by Bowen et al. (2000) and Fassia
et al. (2001) on days 23 and 42. These observations succeeded in
resolving the lines. Between day 23 and day 42 the red wing of the
[O iii] 5007 Å profile moved redward, broadening the line,
so that by the latter epoch the profile was symmetrical about a
velocity of +847 km s-1. A high-resolution observation of
Gruendl et al. (2002) at 1 year showed that the [O iii] 5007 Å profile was still symmetrical about this redshift.
This behaviour can be explained as being due to the effect of the
finite light travel time across a CSM having a denser outer zone. As
the radiation-induced ionisation (due to the flash + shock radiation)
propagates across the CSM, it takes longer for the resulting nebular
emission to reach us from the far side. At any given time, therefore,
the observer sees radiation from an ellipsoidal surface propagating
through the CSM (Morrison & Sartori 1969). On day 23, the vertex
region of the ellipsoid had not yet reached the inner boundary of the
denser zone, thus accounting for the weakness of the red wing of the
line. However, the lack of any further shift in the line centre
between 46 days and 1 year indicates that the vertex had already
reached the dense zone by 46 days. The early evolution of the line
asymmetry can be quantitatively explained if the inner boundary of the
denser zone was at a distance of 16.5 light days (2850 AU). We note
that this distance is consistent with the observed persistence of the
line for at least a year since, assuming a maximum ejecta velocity of
10,000 km s-1 (Leonard et al. 2000; Fassia et al. 2001), at
1 year it would still only have reached 2050 AU and so would not yet
have disturbed the dense outer CSM region (but see subsection 4.2
below). Fassia et al. (2001) adopted +847 km s-1 as the centre
of mass velocity for the SN 1998S system. Justification for this is
provided by the light travel time argument together with the lack of
any further shift between day 46 and 1 year. From the narrow
forbidden lines such as [O iii] 5007 Å, an undisturbed CSM
velocity of about 40 km s-1 is obtained, which is characteristic
of a red supergiant (RSG) wind. From the intensity ratio of [O iii] (4959 Å + 5007 Å) to [O iii] 4363 Å, Fassia et
al. (2001) infer a CSM density of at least cm-3
at 185 AU, implying a CSM mass exceeding 0.005 M⊙, and a
mass-loss rate exceeding around M⊙
yr-1. This is consistent with the radio/X-ray estimate (scaled
to a 40 km s-1 wind velocity) of M⊙
yr-1 (Pooley et al. 2002), and is comparable to that of SN 1979C
which had a mass loss rate of M⊙
yr-1 (Lundqvist & Fransson 1988) .
The behaviour of the narrow allowed H i, He i CSM lines
was more complex. Not only did they exhibit asymmetric P Cygni
profiles, but there were clearly two velocity components. The slower
component is attributed to the same origin as the forbidden lines viz. the photo-ionised, unaccelerated CSM. The profile of this
component was probably a combination of emission from recombination
and possibly collisional excitation, together with a classical P Cygni
line due to scattering from the populated excited levels. The broad
absorption component is more difficult to explain. It extends to a
velocity of around 350 km s-1 which is too fast for a RSG wind.
It may be that, as in the case of SN 1987A, the SN 1998S progenitor
went through a fast-wind phase prior to explosion (Fassia et
al. 2001). An alternative explanation is that the CSM close to the
supernova was accelerated by photospheric photons, or by relativistic
particles from the ejecta/CSM shock (Chugai et al. 2002). Another
possibility is that the faster component arose in shocked clumps
within the CSM wind (Chugai et al. 2002). By day 50, broad emission
lines in P and He i 1.083 m had appeared. The
earliest second season optical spectra (day 78) showed a similar
development in H and the Ca ii triplet (Fassia et
al. 2001). The line profiles became increasingly “square-shaped”,
characteristic of strong interaction between the expanding ejecta and
a dense CSM (Leonard et al. 2000; Fassia et al. 2000). This was
confirmed by the detection of radio and X-ray emission (Pooley et
al. 2002) plus an unusually slow decline in V and I by 300 days
(Li et al. 2002).
In summary, the wind of the SN 1998S progenitor underwent discrete
changes in the rate of mass outflow, resulting in several distinct CSM
zones. The fading of the early-time broad emission components by
about day 18 indicates that the radius of the first boundary was less
than 100 AU (Leonard et al. 2000; Fassia et al. 2001). Beyond this
boundary the density presumably fell quite sharply. The later
appearance of broad emission features led Leonard et al. (2000) and
Fassia et al. (2001) to suggest the presence of a second boundary
where the CSM underwent a density increase. For the explosion epoch
adopted here, the reappearance occurred between days 42 and 50
corresponding to AU. However, the reality of this second
boundary was contested by Chugai et al. (2002) who suggested the
reappearance was due simply to the CDS becoming optically
thin. Finally, as argued above, the evolution of the narrow-line
profile suggests a third boundary at about 2850 AU where the CSM again
underwent a density increase. For a wind velocity of 40 km s-1,
these three boundaries correspond to material which left the
progenitor at epochs yr, yr and yr relative to the
explosion date. Pooley et al. (2002) also note that the best fit to
their radio data requires significant clumping or filamentation in the
CSM, a condition already inferred in two other type II SNe, 1986J and
1988Z. Early-time spectropolarimetry by Leonard et al. (2000) and Wang
et al. (2001) indicate asphericity in the ejecta, CSM or possibly
both.
SN 1998S is unique in that it allowed the first-ever good IR
spectroscopic coverage of a SN IIn (Gerardy et al. 2000; Fassia et
al. 2001). In the -band, we see Paschen , Paschen
and He i 1.083 m lines. Their evolution was similar to
that seen in the optical. At the earliest times broad-based, peaked
profiles were present. These faded by day 23, being replaced by broad,
square-shaped profiles by day 50. Between days 15 and 60
a strong, unresolved He i 1.083 m CSM line was superimposed
on the ejecta/CSM broad lines. By day 50, the -band was dominated
by Paschen . By day 114, first-overtone CO emission was
clearly present in the -band. The presence of CO in type II SNe is
increasingly regarded as ubiquitous. In all cases where -band
observations have been carried out in the period 3-6 months
post-explosion, CO has been detected, e.g., SN 1987A (IIpec)
(Catchpole & Glass, 1987; McGregor & Hyland, 1987; Spyromilio et
al. 1988; Meikle et al. 1993), SN 1995ad (IIP) (Spyromilio &
Leibundgut 1996), SN 1998S (IIn) (Gerardy et al. 2000; Fassia et
al. 2001), SN 1999dl (IIP) (Spyromilio, Leibundgut & Gilmozzi 2001),
SN 1999em (IIP) (Spyromilio et al. 2001; Gerardy et al. 2002),
SN 1999gi (IIP) (Gerardy et al. 2002) and SN 2002hh (IIP) (Pozzo et
al., in preparation). In addition, CO has been detected in the type Ic
SN 2000ew (Gerardy et al. 2002). The rotation-vibration states of CO
are a powerful coolant (especially the fundamental band lines). The
presence of CO is suspected to be a necessary condition for dust
condensation to occur in the ejecta. Modelling of the SN 1998S
spectra suggests a CO velocity of 2000 km s-1 (Gerardy et
al. 2000; Fassia et al. 2001). From this, Fassia et al. (2001)
deduced a core mass of 4 M⊙ implying a massive progenitor.
The actual mass of CO derived was 10-3 M⊙. This is much
smaller than the M⊙ of C and M⊙ of O
likely to be present in the ejecta (Woosley & Weaver 1995), implying
that most of the C and O remain in the gas phase and are thus
available to condense into, respectively, graphite and silicate
grains.
On day 136, Fassia et al. (2000) measured the IR flux out to a
wavelength of 3.8 m (-band). This revealed a remarkable IR
excess of . To produce the observed flux the lowest
possible radius of the IR emission region is given by a blackbody with
a temperature close to the dust evaporation temperature of
1500 K. For dust condensing in the ejecta to attain a
sufficiently large blackbody radius by 136 days would require an
expansion velocity of 11,000 km s-1 (see Fassia et al. 2000).
Such high velocities were seen only in the extreme outer zones of the
H/He envelope. No metals were seen at such high velocities. Fassia et
al. (2000) concluded that the IR excess at this epoch cannot,
therefore, have been due to grain condensation in the ejecta. It must
instead have been produced by an IR echo of the maximum-light
luminosity from pre-existing dust in the CSM. This conclusion is based
only on the intensity of the -band flux. It is strengthened if we
fit a blackbody to both the and fluxes. After correction for
the optical photosphere, this yields corresponding to
a temperature of only 650 K, requiring the dust to lie at an
equivalent velocity of at least 67,000 km s-1!
SN 1998S was exceptionally luminous, reaching a de-reddened M (Fassia et al. 2000). This is around 10 the typical luminosity of a type II SN. The excellent early-time coverage achieved in the optical and NIR allowed Fassia et al. (2000) to examine the bolometric light curve. Both blackbody and UVOIR (i.e., ultraviolet-optical-infrared range) fits indicate that the total energy radiated in the first 40 days exceeded ergs, which is again 10 the typical value for type II SNe. Between days 96 and 136, the bolometric light curve is well-reproduced by the radioactive decay luminosity of 0.15 M⊙ 56Ni. However, by this era the ejecta/CSM shock energy must also have been making a contribution.
1.2 SN 1998S at later epochs
Much of the early-time behaviour of SN 1998S can be attributed to the
interaction of the supernova with a pre-existing, dusty, perhaps
disk-like CSM. SN 1998S remained observable from X-rays to radio for
over 3 years (Pooley et al. 2002; this work) due to the ongoing
conversion of the SN kinetic energy to radiation via the ejecta/CSM
interaction. We continued regular observations during this phase, to
day 1242. A brief, preliminary presentation of this work was given in
Meikle et al. (2003). Other late-time studies have been presented:
optical spectroscopy to 499 d (Leonard et al. 2000); high-resolution
spectroscopy at d (Gruendl et al. 2002); NIR spectroscopy
to d and NIR photometry to 819 d (Gerardy et al. 2000,
2002); X-ray observations to 1055 d and radio observations to 1065 d
(Pooley et al. 2002).
In this paper we present and discuss NIR photometry of SN 1998S spanning 333 to 1242 days post-explosion, optical spectra covering 305 to 1093 days and IR spectra covering 333 to 1191 days. The NIR photometry presented here extends as far as the -band (CW 4.7 m), the first time that such a long IR wavelength has been detected in any SN other than the exceptionally close SN 1987A. The paper is organised as follows. NIR photometry and optical/NIR spectroscopy are presented in Section 2. The evolution of the H and He i 1.083 m profiles are examined in detail, and for this purpose the data are augmented by spectra from other sources. In Section 3 we compare the NIR spectral energy distribution (SED) with pure blackbody functions and blackbodies weighted by emissivities and . In Section 4 we examine possible energy sources for the post-300 d NIR emission, and discuss the location of the IR-emitting dust. Evidence of episodic mass-loss from the progenitor is discussed. We also compare the late-time colour evolution of SN 1998S with that of other type II SNe and suggest that it provides a useful identifier of supernovae whose progenitors had a massive CSM. Conclusions follow in Section 5.
| JD(2450000+) | Date | Epoch000Days after explosion, assumed to be 1998 February 24.7 UT (JD 2450869.2). | Filters000See subsection 2.1 for details. | Standard star000FS standards were used for , and HD standards for . |
|---|---|---|---|---|
| 1202.2 | 1999 Jan 23 | 333.0 | , , , | FS21, HD105601 |
| 1243.2 | 1999 Mar 3 | 374.0 | , , , nb | FS15, HD84800, HD105601, HD106965 |
| 1274.8 | 1999 Apr 4 | 405.5 | 98, 98, 98 | FS21 |
| 1333.5 | 1999 Jun 2 | 464.2 | , , , , nb | FS21, HD106965 |
| 1533.2 | 1999 Dec 19 | 664.0 | 98, 98, 98, 98, 98 | FS130, HD105601 |
| 1567.5 | 2000 Jan 23 | 698.2 | 98, 98, 98, 98, 98 | FS21, HD105601 |
| 1579.0 | 2000 Feb 4 | 709.8 | 98 | HD105601 |
| 1696.2 | 2000 May 30 | 827.0 | 98, 98, 98, 98, 98 | FS21, HD105601 |
| 1916.8 | 2001 Jan 7 | 1047.5 | 98, 98, 98, 98, 98 | FS21, HD105601, HD106965 |
| 2067.0 | 2001 Jun 5 | 1197.8 | 98, 98, 98 | FS131 |
| 2111.5 | 2001 Jul 19 | 1242.2 | 98 | HD106965 |
| JD(2450000+) | Epoch000Days after explosion. | |||||
|---|---|---|---|---|---|---|
| 1202.2 | 333.0 | 16.653(12)000Figures in brackets give the statistical error, in units of the magnitude’s least significant one or two digits. | 14.809(5) | 13.344(2) | 11.560(28) | – |
| 1243.2 | 374.0 | 16.799(34) | 14.922(13) | – | 11.52(17) | 11.291(86) |
| 1274.8 | 405.5 | 17.077(25) | 15.269(8) | 13.431(2) | – | – |
| 1333.5 | 464.2 | 17.609(29) | 15.537(12) | 13.806(4) | 11.69(13) | 11.14(16) |
| 1533.2 | 664.0 | 18.025(33) | 16.421(14) | 14.448(4) | 11.856(18) | 11.44(14) |
| 1567.5 | 698.2 | 18.341(35) | 16.728(15) | 14.556(4) | 11.970(26) | 11.82(14) |
| 1579.0 | 709.8 | – | – | – | – | 12.30(12) |
| 1696.2 | 827.0 | 18.680(27) | 17.148(16) | 14.992(4) | 12.200(33) | 000For this epoch we did not detect the SN in the M’ filter band image. |
| 1916.8 | 1047.5 | 19.280(48) | 17.956(27) | 15.843(7) | 12.985(39) | 12.84(15) |
| 2067.0 | 1197.8 | 19.798(83) | 18.439(77) | 16.366(13) | [13.29(3)]000Estimated by linear interpolation within -band light curve. | – |
| 2111.5 | 1242.2 | – | – | [16.52(2)]000Estimated by linear extrapolation of -band light curve. | 13.40(15) | – |
2 Observations
2.1 Near-infrared photometry
images of SN 1998S were obtained in the period 333-1242d at
the 3.8m United Kingdom Infrared Telescope (UKIRT) on Mauna Kea
(Hawaii). The NIR observations for the earlier epochs were obtained
with the IRCAM3 camera. This contains a 256256 InSb array,
originally with a 0.286 arcsec/pixel plate scale. In late 1999, the
camera was reconfigured to a plate scale of 0.081 arcsec/pixel, and
renamed TUFTI. Also during 1999, a new camera, UFTI, was introduced.
This contains a 10241024 HgCdTe array with a 0.091
arcsec/pixel scale. Most of the later images were obtained with
UFTI, with the and images being taken with TUFTI (see
Table 1 for details). IRCAM3 used the older (Barr), (Barr),
(OCLI), (OCLI) and filters at effective central
wavelengths of 1.25, 1.65, 2.205, 3.8 and 4.675 m; UFTI/TUFTI
uses the newer Mauna Kea Filter set 98(MK), 98(MK), 98(MK),
98(MK) and 98(MK) at effective wavelengths of 1.25, 1.635,
2.20, 3.77 and 4.68 m (see Tokunaga, Simons & Vacca 2002). For
, UKIRT faint standard stars were observed, while for we
used HD standards. Table 1 lists the log of the observations plus
information on the different filter sets and UKIRT standards. 5-point
and 9-point dither patterns were used in the and filter
bands respectively.
| JD(2450000+) | Epoch (days) | ||||
|---|---|---|---|---|---|
| 1202.2 | 333.0 | 1.844(13)999Figures in brackets give the statistical error, in units of the magnitude’s least significant one or two digits. | 1.465(5) | 1.784(28) | – |
| 1243.2 | 374.0 | 1.877(36) | – | – | 0.23(19) |
| 1274.8 | 405.5 | 1.808(26) | 1.838(8) | – | – |
| 1333.5 | 464.2 | 2.072(31) | 1.731(13) | 2.11(13) | 0.55(20) |
| 1533.2 | 664.0 | 1.604(36) | 1.973(15) | 2.592(18) | 0.41(14) |
| 1567.5 | 698.2 | 1.613(38) | 2.172(16) | 2.586(26) | 0.15(14) |
| 1696.2 | 827.0 | 1.532(31) | 2.156(16) | 2.792(33) | – |
| 1916.8 | 1047.5 | 1.324(55) | 2.113(28) | 2.858(40) | 0.15(15) |
| 2067.0 | 1197.8 | 1.36(11) | 2.073(78) | [3.08(3)]101010Estimated by linear interpolation within -band light curve. – | – |
| 2111.5 | 1242.2 | – | – | [3.12(15)]111111Estimated by linear extrapolation of -band light curve. – | – |
The images were reduced using the standard Starlink packages ircamdr
(Aspin 1996) and orac-dr (Economou et al. 2003). Magnitudes were
measured via aperture photometry within the Starlink package
gaia121212Graphical Astronomy and Image Analysis Tool, version
2.6-9 (Draper, Gray & Berry 2002). The sky background was measured
using a concentric annular aperture. Choice of target aperture and sky
annulus was a compromise between maximising the S/N, and minimising
the effects of the galaxy background gradients and structure. An
aperture radius of 1.4 arcsec was selected, this being equivalent to 5
pixels for IRCAM3, 15.4 pixels for UFTI and 17.3 pixels for TUFTI.
The annulus was set to cover 3 the area of the target aperture
in order to minimise the effect of statistical uncertainty in the
background estimation (Merline & Howell 1995). Thus, the annulus was
chosen to have inner and outer radii, respectively, 1.5 and
2.5 that of the aperture. Statistical uncertainty in the
photometry was determined by the sky variance method, with 2 sigma
clipping rejection (all points in the sky background measurement which
deviate by more than 2 standard deviations from the mean are
rejected). Magnitudes were determined by comparison with the standard
stars listed in Table 1. Systematic uncertainties arising from
varying atmospheric conditions from epoch to epoch or between the
target and standard are discussed in Section 3.


The magnitudes for SN 1998S are listed in Table 2 together with associated statistical errors in parentheses. The quoted errors do not include additional uncertainty due to differences in conditions under which the supernova and standards were observed. The light curves are shown in Fig. 2. They extend to longer wavelengths and to later phases than has ever been achieved for the IR light curves of any supernova other than SN 1987A. A generally monotonic decline is seen in the bands. The -band light curve shows a sudden fading of about 1 mag. at around 700 days, although the errrors are quite large.
The NIR colours for each epoch are listed in Table 3, and their evolution is illustrated in Fig. 3. We note in particular the increase in to day700 d and in to beyond 1000 d. The latter reached a value of 2.9 by 1047 d. Indeed, using modest linear extrapolation of the -band magnitudes we see that by 1242 d, has reached a value of 3.1.
2.2 Spectroscopy
We obtained optical spectroscopy at the Nordic Optical
Telescope (NOT) and the Isaac Newton Telescope (INT), both on La
Palma. Infrared spectroscopy was obtained at the United Kingdom
Infrared Telescope (UKIRT), Hawaii. Tables 4 and 5 give the observing
logs of the optical and IR observations respectively. For the IR
spectroscopy, the standard BS4431 was used.
| JD0002450000+ | Date | Epoch | Telescope/ | Spectral | Spectral | Slit width | Spectrophotometric |
|---|---|---|---|---|---|---|---|
| (UT) | (d) | Instrument | range | res. | (arcsec) | standard | |
| (Å) | (Å) | ||||||
| 1174.5 | 1998 Dec. 27 | 305.3 | NOT/ALFOSC | 5825-8344 | 3.0 | 1.2 | G191b2b |
| 1215.6 | 1999 Feb. 6.1 | 346.4 | INT/IDS | 4350-7700 | 5.0 | 1.2 | Feige 34 |
| 1287.5 | 1999 Apr. 19 | 418.3 | NOT/ALFOSC | 5100-9095 | 8.4 | 1.3 | Feige 34 |
| 1343.5 | 1999 Jun. 14 | 474.3 | NOT/ALFOSC | 5804-8322 | 3.0 | 1.3 | Feige 56 |
| 1962.6 | 2001 Feb. 22.1 | 1093.4 | NOT/ALFOSC | 4000-8500 | 8.3 | 1.3 | Feige 34 |
| “ | “ | “ | “ | 5802-8340 | 3.0 | “ | “ |
The day 1093 NOT spectra, the INT spectrum and the UKIRT spectra were
reduced using the standard routines of the figaro package (Shortridge
1991). The other NOT spectra were reduced using the standard procedures
within iraf.141414iraf(Image Reduction and Analysis Facility)
is distributed by the National Optical Astronomy Observatory (NOAO), which
is operated by the Association of Universities for Research in
Astronomy (AURA), Inc. under cooperative agreement with the National
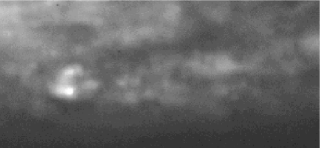
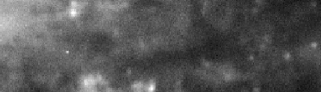
Science Foundation. The fluxing of the day 1093 NOT spectrum was corrected
using contemporary photometry in a narrow band H filter
(CW 6556 Å, width 162 Å). The H image is shown in Fig. 4
together with a contemporary -band image. The source of the H
emission is clearly visible as a point source in the H image.
From these we obtain approximate magnitude estimates of: and
. A contemporary -band image yields
. The IR spectra fluxing was adjusted to match the IR
photometry in Table 2. The spectra are plotted in Figs. 5, 6
(optical) and 7 (IR).
| JD0002450000+ | Date | Epoch | Spectral | Spectral | Slit width |
|---|---|---|---|---|---|
| (UT) | (d) | range | res. | (arcsec) | |
| (m) | (m) | ||||
| 1203.0 | 1999 Jan. 24.5 | 333.8 | 1.01-1.33 | 12.5 | 0.61 |
| 1.45-2.51 | 25 | 0.61 | |||
| 1228.1 | 1999 Feb. 18.6 | 358.9 | 1.01-1.33 | 25 | 1.23 |
| 1273.1 | 1999 Apr. 4.6 | 403.9 | 1.01-1.33 | 25 | 1.23 |
| 1567.2 | 2000 Jan. 23.7 | 698.0 | 1.02-1.34 | 25 | 1.23 |
| 1578.1 | 2000 Feb. 3.6 | 708.9 | 1.02-1.34 | 25 | 1.23 |
| 1.84-2.48 | 50 | 1.23 | |||
| 1918.2 | 2001 Jan. 8.7 | 1049.0 | 1.79-2.40 | 50 | 2.46 |
| 2060.8 | 2001 May 31.3 | 1191.6 | 1.03-1.35 | 25 | 1.23 |
| 1.83-2.46 | 50 | 1.23 |
The optical spectra are dominated throughout by a broad, complex
H profile. This is described in more detail below. At a much
lower level, however, broad emission from a few other species can be
identified (Fig. 6). Between days 305 and 474, we identify He i
5876 Å and [Ca ii] 7291, 7324 Å. On day 418 the spectrum
extends far enough to the red to reveal a blend of [O i] 8446 Å and [Ca ii] 8498, 8542, 8662 Å. The He i
feature exhibits a peak blueshifted by –4000 km s-1, as
does the [O i] 8446 Å peak (assuming it dominates the blend
with the calcium triplet). These blueshifts are similar to those seen
in the H line peaks (see below). There is some evidence of a
similarly blueshifted H peak in the day 346 spectrum. In the
same spectrum there may also be a [O iii] 5007 Å peak
blueshifted by about 3000 km s-1. The [Ca ii] 7291,
7324 Å line peak on days 305 and 418 shows a blueshift of only
about 2300 km s-1. Given the larger blueshifts seen in the other
oxygen lines, this argues against a significant blended contribution
from [O ii] 7319, 7330 Å. The broad feature lying at
5100-5400 Å has been identified as an Fe ii emission band
(Garnavich, Challis & Kirshner 1998). On day 1093, we identify H,
He i 5876 Å, [O i] 6300 Å and [O iii] 4363, 5007 Å.
A fainter feature at about 7275 Å could be due to [O ii] 7319,
7330 Å, possibly blended with [Ca ii] 7291, 7324 Å. The profiles
appear to have a similar form to that of H at this epoch, with much of
the flux appearing as a broad feature to the blue of the local rest
frame wavelengths. Narrow peaks at the rest wavelengths are also
seen, although these may be simply unresolved emission from a
coincident H II region. However, we note that a higher resolution
spectrum of the much stronger H feature (Fig. 8) reveals a
rest-frame peak with wings extending to 1000 km s-1, making
a H II region origin unlikely, at least for this line (see below).


The IR spectra are characterised by strong, broad complex
He i 1.083 m emission plus, when observed, a smooth continuum
rising to longer wavelengths. P and P are also visible
in the day 333 spectrum.
2.2.1 H and He i 1.083 m profiles
In Fig. 8 we show the evolution of the H profile between days 103 and 1093. To maximise the temporal coverage, we have added spectra at +103 d (Fassia et al. 2001), +249 d (Gerardy et al. 2000) and at +658 d (D. Leonard and T. Matheson, private communication). The +658 d spectrum was placed on an absolute flux scale by interpolation of the H intensity light curve which declined at about 1mag/155 days between days 249 and 1093. The velocities of the peaks and extreme edges of the profile with respect to the SN centre-of-mass velocity are listed in Table 6, together with the mean flux and intensity of the line.
On day 103 the profile has the form of a broad, steep-sided, fairly
symmetrical line spanning 7000 km s-1 across the base. This
appearance persisted to at least day 145 (Leonard et al. 2000).
However, by the time the supernova was recovered in the second season,
the shape was remarkably different. The day 249 spectrum of Gerardy et
al. (2000) shows that the profile had developed a triple-peak
structure, comprising a central peak close to the rest-frame velocity,
and two outlying peaks at, respectively, –4860 km s-1 and
+3400 km s-1. Gerardy et al. suggest that the outermost peaks
could have been produced by an emission zone having a ring or disk
structure seen nearly edge-on, and resulting from the SN shock-wave
collision with the disk/ring. Following Chugai & Danziger (1994)
they also suggest that the central peak might have been due to shocked
wind clouds. Between days 249 and 658 we see a steady fading of the
central and red-shifted peaks with respect to the blue-shifted peak.
Gerardy et al. (2000) and Leonard et al. (2000) also observed this
effect, suggesting that dust condensation in the ejecta is
responsible. We note also that the strong blue peak shifted from
–4860 km s-1 on day 249 to –3900 km s-1 by day 474,
presumably due to a slowing of the shock as it encountered an
increasing mass of CSM. The velocity then remained fairly constant for
the subsequent 200 d. Finally, when we recovered the supernova
in the 4th season on day 1093, it can be seen that the profile had
undergone another dramatic change. While the blue-shifted peak
persisted, slowing slightly to –3430 km s-1, the central peak
had grown in relative strength to about twice the height of the blue
peak. However, the total intensity of the day 1093 line is less than
10% of the day 658 spectrum and so it is possible that the day 1093
central peak was present at earlier times but was swamped by other
stronger emission.
In Fig. 9 we show a sequence of He i 1.083 m spectra obtained at UKIRT. Again to increase the temporal coverage we include spectra obtained by Fassia et al. (2001) on day 114, and by Gerardy et al. (2000) on days 247 and 283. The velocities of the blue peak and extreme edges of the profile with respect to the SN centre-of-mass velocity are listed in Table 7, together with the mean flux and intensity of the line. Judging from the strength of P emission, the earlier epochs were probably slightly contaminated by P emission. Consequently the velocities of the red edges of the earlier epoch profiles are not well determined and the line intensity values are approximate. Although the signal-to-noise is lower, clearly the form and evolution of the strong He i 1.083 m profile was similar to that of H.
| Epoch | Vel. (km s-1) | Flux000Mean Flux given in erg s-1 cm-2 Å-1. | I 000Intensity given in erg s-1 cm-2. | ||||
|---|---|---|---|---|---|---|---|
| (d) | Blue | Mid- | Red | ||||
| Edge | Peak | Peak | Peak | Edge | |||
| 249 | –7060 | –4860 | 0 | 3400 | 7000 | 11.8 | 3.52 |
| 305.3 | –6400 | –4570 | –560 | 3450 | 6050 | 8.4 | 2.30 |
| 346.4 | –6120 | –4340 | –380 | 3770 | 5460 | 6.2 | 1.57 |
| 418.3 | –6400 | –3930 | –650 | 3860 | 6050 | 4.3 | 1.17 |
| 474.3 | –6260 | –3890 | –560 | 3950 | 5590 | 2.07 | 0.54 |
| 658 | –5610 | –3940 | –550 | 3540 | 5270 | (1.0)000Figures in brackets were estimated by interpolation | (0.25) |
| 1093.4 | –5760 | –3430 | –60 | – | 5460 | 0.10 | 0.027 |

3 Comparison of the IR spectral energy distribution with thermal continua
The intensity and rise of the continuum towards longer
wavelengths (Fig. 7) together with the relatively bright and
magnitudes (Table 2) suggests strongly that the IR emission was due to
hot dust condensing in the ejecta and/or pre-existing in the CSM. To
investigate the location and hence origin of the dust, we fitted the
IR photometry flux values at each epoch (i.e. the IR SED),
with single-temperature blackbodies. We excluded the -band fluxes
from the fits since these were probably dominated by emission from the
ejecta gas (e.g. P emission, residual photospheric emission)
rather than hot dust (cf. Fig. 11). It is possible that the -band
might also have been slightly contaminated by non-dust emission.
However, approximate extrapolation of the -band continuum (Fig. 11)
to longer wavelengths suggests that non-dust emission contributed less
than 20% of the total flux in the -band. The magnitudes for
each waveband were dereddened using the empirical formula of Cardelli,
Clayton & Mathis (1989) and adopting AV=0.68 (Fassia et al. 2000).
Using the effective wavelengths of the filters, the dereddened IR
magnitudes were then converted into fluxes using the calibration curve
of Bersanelli, Bouchet & Falomo (1991). Using minimisation,
blackbody fits to the IR fluxes at each epoch were then performed,
with temperature Tbb and solid angle as free parameters. The
errors used in the fits were not just the statistical errors given in
Table 2, since these errors do not include systematic uncertainties
arising from varying atmospheric conditions from epoch to epoch or
between the target and standard. To obtain a more realistic assessment
of the true error we note that, up to 800 days, the light
curves declined approximately linearly (magnitudes v. time) but with
an apparently random scatter in the measured values about this line.
We assume that this scatter is due to the combination of statistical
and systematic errors, rather than real fluctuations in the supernova
decline. From the scatter we derive total uncertainties of at least
0.05 magnitudes in , and 0.06 in . Where the
statistical errors are larger than this, then these were used. In the
-band the relatively small number of points and the apparent
sudden fading around 700 days (cf. Fig. 2) means that it is not
possible to estimate the total error from the scatter. However, given
that the statistical error alone is 0.1 to 0.15 mags, we
adopt a total uncertainty of 0.2 in . The fits were repeated
using a blackbody scaled by and
emissivity dependence such as might be the case for optically-thin
emission.
| Epoch | Vel. (km s-1) | Flux000Mean Flux given in erg s-1 cm-2 Å-1. | I000Intensity given in erg s-1 cm-2. | ||
|---|---|---|---|---|---|
| (d) | Blue | Red | |||
| Edge | Peak | Edge | |||
| 247000The earlier epochs are slightly contaminated by P emission and so the red edge is undetermined and the intensities are only approximate. | -6760 | -4790 | – | 22 | 10 |
| 283 | -6120 | -4380 | – | 20 | 8 |
| 333.8 | -6370 | -4520 | – | 13 | 5 |
| 358.9 | -5180 | -4440 | 4700 | 13 | 4.8 |
| 403.9 | -5820 | -3720 | 4710 | 12 | 4.5 |
| 698.0 | -5040 | -3860 | 4600 | 6.5 | 2.2 |
| 708.9 | -5210 | -3830 | 4510 | 5.9 | 2.1 |
| 1191.6 | -5000 | -1730 | 3500 | 1.0 | 0.25 |

| Epoch | npts(filters)222222Number of points used in the blackbody fits (corresponding wavebands as given in brackets). | 232323Reduced chi square values. | 242424These illustrate the poorer fits achieved with a -weighted blackbody law. | Tbb252525Fit parameters were derived after dereddening using Av=0.68 (Fassia et al. 2000) and the interstellar reddening law of Cardelli et al. (1989). | T | Lbb262626The overall level of the luminosity light curve is subject to an additional uncertainty of about 12% due to distance uncertainty (see text). | rbb | vbb | L (56Ni)272727Total power output of radioactive decay of 0.15 M⊙ of 56Ni (Li, McCray & Sunyaev 1994; Timmes et al. 1996; Fassia et al. 2000). |
| (d) | (bb) | () | (K) | (K) | ( erg s-1) | ( cm) | (km s-1) | ( erg s-1) | |
| 333.0 | 3() | 0.7 | 5.6 | 1254(23)282828Internal errors in last one or two significant figures are shown in brackets. | 1034(4) | 2.51(8) | 119(6) | 4150(210) | 995 |
| 374.0 | 3() | 0.5 | 0.1 | 1234(16) | 1007(22) | 2.42(11) | 121(5) | 3740(170) | 689 |
| 464.2 | 4() | 0.4 | 2.8 | 1102(22) | 941(1) | 2.01(12) | 138(10) | 3450(240) | 307 |
| 664.0 | 4() | 4.3 | 9.8 | 970(12) | 836(5) | 1.62(7) | 161(7) | 2800(130) | 52.3 |
| 698.2 | 4() | 3.6 | 4.5 | 943(10) | 813(1) | 1.49(6) | 162(7) | 2690(120) | 38.7 |
| 827.0 | 3() | 7.7 | 18.5 | 905(10) | 792(7) | 1.21(6) | 159(7) | 2220(100) | 12.8 |
| 1047.5 | 4() | 8.8 | 14.0 | 915(10) | 795(7) | 0.54(3) | 104(5) | 1150(50) | 2.35 |
| 1197.8 | 3() | 23 | 36.6 | 856(11) | 749(7) | 0.43(2) | 106(6) | 1020(60) | 0.98 |

The fits for a pure blackbody and for emissivity
dependence are illustrated in Fig. 10. Details of the fits are given
in Table 8. Column 1 gives the epoch, and column 2 gives the number
of points used in the fit, together with the corresponding wavebands
in brackets. The quality () of these fits is listed in
columns 3 (blackbody) and 4 (). For days 333, 374 and
464, single-temperature blackbody functions provide excellent
descriptions of the IR SED. From day 664 the quality of the fits
becomes somewhat poorer. However, apart from 374 d, for all the epochs
the emissivity fits were somewhat less successful than
those using a pure blackbody SED. The quality of fits with
dependence was even poorer. In Fig. 11 we compare the
blackbody and emissivity curves with the coeval IR
spectra, when the wavelength coverage extended into the -band. It
can be seen that up to the end of year 2, the continua are
well-represented by the both pure blackbody and
-weighted blackbody functions. However, as Gerardy et
al. (2002) noted, and data alone are insufficient to
distinguish between different emissivity laws. The pure blackbody
fits indicate that the temperature declined from 1250 K to
950 K at the end of year 2, but then remained relatively
constant during the following year [cf. Table 8, col. 5 and
Fig. 12(b)]. This is reflected in the slowing of the reddening in
(Fig. 3). Not surprisingly, temperatures obtained from the
emissivity case are lower (Table 8, col. 6). The shape
and characteristic temperature of the SED supports our earlier
suspicion that the emission is produced by heated dust grains in
and/or around SN 1998S. Similar conclusions were reached by Gerardy
et al. (2000). However, our coverage to longer wavelengths allows us
also to conclude that pure blackbody fits appear somewhat superior.
Following a suggestion by the referee, we also examined fits using a
dependence, as might be the case if long iron whiskers
can form in the SN ejecta (see Wickramasinghe 1992; Hoyle &
Wickramasinghe 1999). We find that the quality of fits was generally
no better than for blackbodies and so on this basis alone we do not
rule out optically-thin emission with a
dependence. However, a problem with such emission is that it would
require the condensing grains to be lying beyond the CDS. This is
discussed further in Section 4.1.2.


Adopting a distance of 17 Mpc (Tully 1988) and an explosion date of 1998 February 24.7 (see subsection 1.1), we found the blackbody radius (rbb) and velocity (vbb) for each blackbody fit. Finally, we found the total flux and total luminosity (Lbb) by integrating the best-fit blackbody curves. These values are listed in Table 8, cols. 7–9. and are plotted in Fig. 12(a,c,d). Throughout the 333–1197d era, the blackbody fits indicate a monotonically declining luminosity. The derived blackbody velocity declined monotonically from 4150 km s-1 on day 333 to 1020 km s-1 on day 1197, while the radius peaked at 1100 AU at about 2 years. Similar conclusions would be reached for grey-body emission (e.g. clumps of dust), except that the radii and velocities would be proportionally higher. For the and emissivity fits, similar trends with time are obtained, but with much larger velocities being required to account for the observed luminosity. The uncertainty in the extinction is quite large (A, Fassia et al. 2000). Therefore, to check the effect on the above results, we repeated the fitting procedure using the range of AV values encompassed by the errors. We conclude that the extinction uncertainty introduces an additional error of only 1% or 2% in the derived parameters.
As indicated in Section 1.1, there is some uncertainty about the distance to NGC 3877 at the level of about 1 Mpc. Consequently this introduces an additional uncertainty of about 12%. While this does not affect the shape of the bolometric luminosity light curve, it does act on its overall level.
4 Discussion
4.1 Origin of the IR emission and location of the dust
What powered the post-300 d IR emission from the dust, and where was
the dust located? Integrating over the single temperature blackbody
fits, the total energy emitted by the dust region between days 300 and
1200 was about ergs, or ergs in the
1.5-4.8 m range. Even for the more conservative value, this is a
factor of more than could be supplied by the decay of the
daughter products of 0.15 M⊙ 56Ni (Fassia et al. 2001)
over the same period. This is illustrated in Fig. 13, where we compare
the radioactive luminosity with the contemporary IR luminosity derived
from the blackbody fits.
We can therefore immediately rule out radioactivity as the main source of the post-300 d IR energy. However, a much larger energy source is available. It is likely that of order 1051 ergs was stored in the kinetic energy of the ejecta, so it would take only 1% of this to account for the IR emission through the radiative heating of pre-existing (CSM) and/or newly-condensed (ejecta) dust. For example, for a progenitor with an extended structure or very dense wind, the ejecta/CSM interaction could rather easily convert 10% of the kinetic energy to radiation (Falk & Arnett 1977; Chugai et al. in preparation), thus providing the energy of the early light curve (0–40 days) which we know amounted to 1050 ergs (Fassia et al. 2000). If, then, a fraction (say 5–10%) of this early light curve emission were absorbed by CSM dust and re-emitted as an IR echo, it would account for the observed IR radiation. Gerardy et al.(2000) suggested that dust could be heated as a result of energy released in the ejecta/CSM interaction, either by direct shock-heating or by absorption of X-rays from the interaction region. However, they were not able to address the origin of the dust, i.e. newly-formed in the SN ejecta or pre-existing in the CSM. As argued earlier, the large, low-temperature -band flux seen at 136 days must have been due to emission from pre-existing dust, i.e., an IR echo. However, such an argument is less convincing at the later times being considered here. The blackbody fits produce velocities not exceeding 4200 km s-1, and generally slower than this (Table 8). Grain condensation in ejecta located at such velocities is conceivable. However, while the evolution of the line profiles provides convincing evidence that dust did condense in the ejecta, this does not automatically mean that this dust was also the source of the IR emission. IR radiation from a dusty CSM must therefore also be examined.
4.1.1 IR emission from pre-existing CSM dust
To try to distinguish between the IR echo and dust condensation
scenarios, we consider first the possibility that the IR emission
arose from pre-existing dust in the CSM. It is unlikely that CSM dust
was directly heated by the supernova shock energy. The supernova
radiation around maximum would have evaporated the dust to a radius
. The size of the dust-free cavity in such an explosion has been
estimated by a number of authors to lie in the range 4,000–80,000 AU
(Wright 1980; Bode & Evans 1980; Dwek, 1983, 1985; Graham & Meikle
1986; Gerardy et al. 2002). Dwek (1983, 1985) finds that for a
supernova with a peak UV-optical bolometric luminosity of
and an exponential decline rate timescale of
25 days, is 4,000 AU for carbon-rich grains
(T) and 20,000 AU for oxygen-rich grains
(T). This is for 0.1 m radius particles in an
density distribution. The early bolometric light curve of
SN 1998S derived from blackbody fits to the optical-IR photometry
(Fassia et al. 2000) can be described as
erg s-1. The more
conservative spline-fit integration values yield
erg s-1. Thus, given
that (Dwek 1985) we conclude that the
evaporation radius for SN 1998S would have been at least
5,000-9,000 AU for graphite grains, and at least 24,000-40,000 AU for
silicate grains. The fastest moving ejecta material (10,000 km
s-1, Fassia et al. 2001) would have reached only 7,000 AU by the
latest epoch (1242 d), almost certainly placing it well within the
dust-free cavity throughout the observations presented here. The
ejecta would, therefore, have been unable to interact directly with
CSM dust.
It is likely that an X-ray precursor is produced as the forward shock
moves through the dust-free low-density gas in the cavity. These
X-rays would eventually reach the dust and hence may provide the
energy needed for the IR emission. A concern might be that the X-rays
could be severely attenuated by the gas in the cavity (assuming the
unshocked gas in the cavity was not already fully ionized by the
initial X-rays). Assuming a steady mass loss rate of
M⊙ yr-1 (see Section 1.1) we find
that the gas column density between the shock front and the edge of
the dust free cavity (assumed to be 25,000 AU) is
cm-1 at 333 d. This corresponds to an optical
depth for X-rays of E keV. Given the hard X-ray spectrum
observed ( keV, Pooley et al. 2002) we do not expect
strong absorption of X-rays within the cavity. We note that X-rays
would also be produced by the reverse shock. However, if it is
radiative early on this might produce a CDS (Chevalier & Fransson
1985), causing additional attenuation of this X-ray component. The
difficulty with the X-ray precursor scenario is that the observed
X-ray luminosity is much less than that of the contemporary IR
luminosity. At 674 days, measurements with Chandra indicate that
erg s-1 (Pooley et al. 2002), and as indicated
above, we expect that these hard X-rays would only be weakly absorbed
within the cavity. However, this luminosity is about lower
than the blackbody-derived IR luminosity observed at this time. Light
travel time effects mean that, in general, the observed IR emission
would have been produced by the X-ray precursor at an earlier,
possibly brighter phase. For example, by 664 d, a shock travelling at
10,000 km s-1 would have reached about 3800 AU. The
largest delay would be for X-rays emitted directly away from us. This
would amount to a delay of about 60 d for a 5,000 AU radius dust-free
cavity to about 460 d for a 40,000 AU cavity. However, even a year
later the IR luminosity has declined by only a factor of 3, i.e., it
is still 5 more luminous than the X-ray flux one year before.
A perhaps rather desperate solution might be to suggest that more than
90% of the X-rays are being transformed into IR radiation,
i.e., most of the X-rays are absorbed by the dust, yet leaving enough
to be detected by Chandra. (We note the actual percentage could be
somewhat less if the true X-ray temperature is higher than the
10 keV derived from the Chandra observations so that the X-ray
flux was significant above Chandra’s energy limit.) In such a
scenario, we would expect the X-ray and IR light curves to be
reasonably correlated. Between days 674 and 1044 the X-ray flux
declined by about 2 while the IR luminosity fell by 3
in the same period. Given the complications of light travel times
across the CSM, this might be consistent with an X-ray
precursor-driven IR luminosity. However, a particular difficulty with
the X-ray precursor model is that in general, for solid material,
X-rays are more penetrating than UV/optical radiation (Wilms, Allen &
McCray 2000). As indicated above, to account for the low X-ray/IR
luminosity ratio we need the dust optical depth to the X-rays to be at
least 2.5, in which case the optical depth to UV-optical photons would
be even higher. Yet, for the IR-echo mechanism to produce the
observed IR luminosity we require an optical depth to
UV-optical-photons of about 0.2 (see below). In other words, in the
case of the X-ray precursor mechanism, if we invoke sufficient dust
absorption to account for the low X-ray/IR luminosity ratio then the
IR-echo mechanism predicts an IR luminosity which exceeds the observed
value by a large factor. Even if we adopt the lower m
luminosity values, a similar conclusion is reached. Gerardy et
al. (2000) left open the possibility that the IR flux might arise from
either direct shock heating or X-ray-precursor heating of pre-existing
CSM dust. However, from the above discussion we believe that both
possibilities are ruled out. Direct shock heating is impossible as the
ejecta would not yet have reached the edge of the dust-free cavity.
X-ray precursor heating is probably ruled out since it implies an
IR-echo of much greater intensity than the observations could
support.
We now consider thermal emission following the heating of CSM dust by
supernova radiation emitted around the time of maximum light, i.e., an
“IR echo”. Owing to the light travel time across the CSM, the IR
emission seen at Earth at a given time originates from a zone bounded
by ellipsoidal surfaces, with the axis coincident with the
line-of-sight. The thickness of this zone is fixed by the
characteristic width of the UV-optical light curve around maximum.
While the UV-optical ellipsoid is still partially within the
dust-free cavity, we expect the IR light curve to be relatively flat
(Dwek 1983; Gerardy et al. 2002). However, once the whole ellipsoid
has left the cavity, the IR flux declines. Even at our earliest epoch
of 333 d, we see no sign of a plateau in the observed IR light curves,
indicating that SN 1998S was already beyond the echo plateau phase.
At 333 days the vertex of the ellipsoid would be 30,000 AU from the
supernova. This indicates that, if the IR-echo scenario is valid, the
cavity radius must have been less than 30,000 AU.
The flux, spectral energy distribution and evolution of a
supernova/CSM IR-echo has been examined by a number of authors (Wright
1980; Bode & Evans 1980; Dwek, 1983, 1985; Graham & Meikle 1986;
Gerardy et al. 2002). Of particular interest here is the study of
SN 1979C by Dwek (1983). This supernova seems to have been similar to
SN 1998S (cf. Liu et al. 2000). Both supernovae were unusually
luminous at early times and both exhibited a strong IR excess at late
times. Dwek (1983) argues that the late-time IR emission of SN 1979C
was due to an IR-echo produced in a massive circumstellar wind. In
addition, the early-time bolometric light curve adopted by Dwek (1983)
for SN 1979C is exponential with a 23 day timescale - very similar to
the spline-fit light curve for SN 1998S (see above and Fassia et
al. 2000). The extinction towards SN 1979C was somewhat less than for
SN 1998S, while their distances were almost identical. After
correcting for the difference in extinction (), we
find that the early-time bolometric light curve of SN 1998S
(spline-fit) is more luminous, while its post-300 d
blackbody-derived IR luminosity is less luminous than the
corresponding values for SN 1979C. Scaling Dwek’s results to SN 1998S
indicates that about 20% of its early-time UV-optical output must
have been absorbed by CSM dust. Applying Dwek’s
emissivity model to a wind velocity of 40 km s-1 (Fassia et
al. 2001), this yields a mass-loss rate of
yr-1, comparable to the values indicated by optical, X-ray and
radio studies (Anupama et al. 2001; Fassia et al. 2001; Pooley et
al. 2002). Dwek’s model parameters include an ISM gas-to-dust ratio of
160, a dust-free cavity radius of 20,000 AU, a steady mass-loss phase
of 1.7 years, a grain radius of 0.1 m and a grain material
density of 3 g cm-3. A longer mass-loss phase would result in
only a modest decrease in the derived mass-loss rate.
The and -band IR-echo light curves of SN 1979C have been
calculated by Bode & Evans (1980). At about 1 year, they find
decline rates of 0.44 mag/100 d in and 0.3 mag/100 d in . Dwek
finds an -band decline rate of 0.4 mag/100 d for a putative
galactic supernova once the plateau phase is over. Both authors
assume CSM density laws. For SN 1998S, we observe decline
rates of about 0.35 mag/100 d in and 0.16 mag/100 d in .
Similarly, for the total IR luminosity decline rate, while Dwek
predicts an e-folding time of 340 days between years 1 and 2, our
observations indicate e-folding times of about 470 days (m
luminosity) or 700 days (blackbody luminosity). However, these
discrepancies may be indicative of a flatter CSM density law than
, i.e. that the CSM wind was stronger in the past. In
addition, these models assumed a spherically symmetric wind, whereas
the SN 1998S CSM probably had a more flattened geometry (Leonard et
al. 2000; Gerardy et al. 2000).
In addition to the modest decline rate disagreement, we also note that
Dwek’s model provides an imperfect match to the SN 1979C SED.
Similar discrepancies with the Dwek model are seen for the SN 1998S
SEDs. Dwek argues that this may be due to the contamination of the
(and ) band fluxes with residual photospheric emission. However,
our post-300 d IR spectra of SN 1998S do not support this explanation
(cf. Fig. 11, day 333). We recall that the Dwek models utilise dust
emissivity laws of and , whereas our
analysis indicates that single temperature blackbodies yield a
superior fit to the SEDs of SN 1998S. This suggests that the
dust grains are in an opaque clumped distribution, or are of larger
individual size than in the Dwek model. Of course, the SED of the
IR-echo model is made up of fluxes from material having a range of
temperatures. It is therefore not clear that even with ‘black-body’
grains (or clumps) we would be able to reproduce the single
temperature behaviour.
We conclude that the IR-echo scenario is not ruled out as providing
the mechanism responsible for the post-300 d IR flux from SN 1998S.
However, to make it work it has to be pushed to quite an extreme case
where 20% of the early-time light is absorbed by the dust. There is
little sign of such absorption in the form of reddening although, as
already indicated, the dust grains could be clumped or are
individually too large to give a reddening effect in the wavelength
range studied. In addition, the simple spherically-symmetric IR-echo
models do not fully agree with the observed decline rates and SEDs.
Further progress will probably require more detailed IR-echo
modelling, including asymmetric and episodic cases.
4.1.2 IR emission from newly-condensed ejecta dust
We now consider newly-condensed dust as the origin of the IR
luminosity. Gerardy et al. (2000) suggested that the detailed shape
and evolution of the H and He i profiles could be due
to the ejecta impacting on a disk-shaped CSM, together with the
condensation of dust within the ejecta. We agree that this is a
promising scenario. As both Gerardy et al. (2000) and Leonard et
al. (2000) point out, the relatively sudden fading of the central and
red-shifted components of the H i, He i line profiles
immediately suggests dust condensation in the ejecta, causing
obscuration of the central and receding regions. A similar effect was
observed in the ejecta line profiles of SN 1987A (Lucy et al. 1989;
Spyromilio, Meikle & Allen 1990; Danziger et al. 1991) and, more
recently, in the type IIP SN 1999em (Elmhamdi et al. 2003). The
presence of CO emission from SN 1998S as early as 115 days (Fassia et
al. 2001) lends credence to the dust condensation scenario.
Moreover, in spite of the much lower S/N of the He i 1.083 m profile, plus its contamination by P up to
about the end of year 1, we judge that the obscuration effect is
comparably strong at 0.66 m and 1.08 m, at least up to about
day 400. This suggests that the dust became quickly optically thick
either due to forming in clumps, or (less likely) growing rapidly to a
large grain size. After day 400, the very low S/N of the He i
red wing makes comparison impractical.

Could newly-condensed dust also have been responsible for the
post-300 d IR luminosity of SN 1998S? As already indicated, there is
an ample reservoir of energy available from the supernova kinetic
energy which could radiatively heat the dust. For the pure blackbody
fits, we note that in the period 330–400 days the velocity of
the dust blackbody was 90% of the velocity of the blue-shifted
H i, He i peaks (see Fig. 14). Consequently, for
optically-thin dust characterised by , or
emissivities to account for the observed IR luminosity
at this epoch, it would need to have condensed at velocities higher
than those indicated by the blue peaks of the H and He lines,
i.e. well beyond the main ejecta/CSM shock interaction. This seems
unlikely. Moreover, as pointed out already, and
emissivities yield poorer fits than does a pure
blackbody. We therefore discount IR luminosity characterised by
optically thin emissivities, and confine our attention to pure
blackbody emission. After 333 d the dust and blue peak velocities
decline roughly at the same rate until about 400 days after which the
H i, He i peak velocity levelled off while that of the
dust continued to decline. The near coincidence of the velocities for
the 100 days after 333 d suggests a possible physical link
between the origins of the H i, He i peaks and the IR
luminosity. It has been recognised for many years (e.g., Chevalier &
Fransson 1985) that the interaction of the supernova ejecta with a
dense CSM will produce outer and reverse shocks. When radiative
cooling is important at the reverse shock front, the gas undergoes a
thermal instability, cooling to 10,000 K, thus forming a dense,
relatively cool zone - the CDS. Line emission from low-ionisation
species in the CDS will be produced (Chevalier & Fransson 1994). We
suggest that this emission could have been responsible for the blue
and red peaks of the H and He i line profiles. This
leads to the interesting possibility that dust may have formed in the
CDS at the ejecta/wind interface. (Note that this could be as
well as dust formation in the metal-rich SN ejecta interior.) If
cooling in the outer layer of the CDS, shielded from the reverse shock
X-ray/UV radiation, brought the temperature to below the condensation
temperature, dust could have formed and survived there. The physics
here is reminiscent of the radiative shock of colliding winds of
Wolf-Rayet stars, which is known to be a dust-forming site (Usov
1991). However, unlike the Wolf-Rayet material, the CDS has a normal
composition with the carbon-to-oxygen ratio being less than
unity. Consequently, at first sight, carbon dust might not be expected
to form since all the carbon in the CDS would be bound into CO.
However He+ ions produced by X-ray absorption efficiently destroy
CO via the reaction HeCO He+CO (Lepp,
Dalgarno & McCray 1990), yielding the relatively low observed mass of
CO (see Introduction). We estimate that dust formed in the CDS after
day 200 may survive in the radiation field of SN 1998S. The
occurrence of Rayleigh-Taylor or convective instabilities (Chevalier
& Fransson 1994) can lead to the formation of opaque clumps of dust
within the CDS, producing significant occultation of the central and
receding parts of the supernova and radiative heating of the grains,
while at the same time allowing some of the line radiation to escape
from the approaching component of the CDS. (Given that the CDS has a
temperature of 10,000 K, collisonal heating of the grains would
be negligible, e.g. Dwek & Werner 1981). Thus, this scenario might
simultaneously account for the strong IR flux, the obscuration effect
and the blackbody velocity coincidence with that of the line
profiles.
How much dust would be needed to achieve the required obscuration?
Consider dust grains of radius in spherical clumps of radius
. For a spherical CDS whose thickness is small relative to
its radius, the total mass of dust in clumps, , required to
yield a CDS optical depth is given by where is the radius of the CDS,
is the grain number density and is the density of the
dust grain material. is the effective optical depth of a
clump i.e. for a clump illuminated on one side, is
the ratio of transmitted to incident fluxes, integrated
over the projected area of the clump, and is given by
, where is the centre
to surface optical depth of a clump (e.g. Hobson & Padman 1993).
If we assume that the grains are sufficiently large that their
absorption cross-section at 5 m equals their geometrical
cross-section, i.e. m, then we may write
. Substituting into the equation for
, we obtain .
For smaller grains (cf. Kozasa, Hasegawa & Nomoto 1989) if we assume
that the ratio of absorption cross-section to geometrical cross section
is proportional to , then the dust mass becomes independent of
. For larger grains, the mass would increase in proportion to the grain
radius. At 346 d the radius of the H blue-peak emission
region is cm. At this epoch the dust blackbody
radius is 93% of this. If we assume that the dust and H
emission zones are physically at about the same radius, then the
smaller dust blackbody radius can be interpreted as a covering factor
of about 86%, or . For near-opaque clumps, say
(), m, and a dust material
density of 2.5 g cm-3 (a typical density of grain material), we
obtain M⊙. Note that this is a
lower limit i.e. larger values of yield higher
masses. Repeating this calculation for subsequent epochs, we find that
the dust mass (lower limit) remains roughly constant up to about
700 d, after which it declines. declines
monotonically throughout this time, reaching 0.15 at 1000 d.
At 346 d the intensity ratio of the red and blue H peaks is 0.25. If we assume that the two peaks have the same intrinsic luminosity at all times, then we can interpret the red deficit as being due to an optical depth across the supernova of about 1.4. This is similar to the optical depth of 2 derived in the previous paragraph at the same epoch, using the velocities of the H peak and the IR blackbody. This lends support to the suggestion that condensing dust is responsible for both the line profile attenuation and the IR luminosity. A difficulty is that while the optical depths derived from the covering factor decrease with time, those derived from the H red/blue intensity ratio increase with time. A possible explanation might be that initially the optical depth was dominated by hot, newly-formed dust and it was purely this dust which was responsible for the obscuration and the observed near-IR flux. This would explain the similarity at 346 d of the optical depths derived in the two ways. However, if dust condensation was continuous throughout the 346–1093 d period it is possible that, if the dust which formed at earlier epochs cooled, our NIR observations would have detected a decreasing fraction of the total dust. Such a process would also mean that dust was present at an increasing range of temperatures, and this may account for the poorer blackbody fits at the later epochs. In summary, we agree about the plausibility of the dust-condensation scenario which Gerardy et al. (2000) put forward as one of a number of possibilities. We have refined this proposal in that we suggest that the dust is formed in the CDS, with the energy source for the IR emission coming ultimately from the shock interaction. However we note that if, as discussed in Section 4.1.1, the IR emission was predominantly due to an IR echo then the optical depth ‘discrepancy’ would disappear i.e. we would not then expect to see a correlation between the optical depths derived via the covering factor argument (which would be inappropriate for an IR echo) and those derived from the H red/blue intensity ratio.
4.2 Line profiles at 3 years
The H and He i 1.083 m lines persisted beyond
3 years post-explosion (Figs. 8 & 9). At 1093 days the extreme blue
wing of H was at a velocity of 5800 km s-1,
corresponding to 3650 AU, confirming that the CSM must have extended
to at least this distance (for a CSM velocity of 40 km s-1,
this implies that the progenitor mass loss started at least 430 years
prior to explosion). However, as explained above, even at this
late epoch it is unlikely that the ejecta would have encountered any
pre-existing CSM dust. The most notable change in the H
profile is the appearance of an emission feature peaking at about the
velocity of the supernova rest frame. Its wings extend to about
1000 km s-1 and so it cannot be due to the emergence of a
spatially-coincident H II region as the supernova faded. It must be
physically connected to the supernova. We note that the red side of
the H feature is still very weak, presumably due to
attenuation by dust which condensed in the SN. Thus, it is unlikely
that we are witnessing emission from the central regions of the
supernova. An alternative explanation is indicated by the ‘clumpy
wind’ model of Chugai & Danziger (1994). In this scenario, we see
emission from individual slow-moving CSM clumps as they are engulfed
by the ejecta shock. As mentioned above, this was suggested by
Gerardy et al. (2000) as an explanation for the earlier (and much
stronger) central peak of the H feature. The increased
prominence of the central feature by day 1093 could be partly due to a
weakening of the direct interaction of the ejecta shock with the
undisturbed, inter-clump CSM which is responsible for the blue peak.
In the Introduction we pointed out that the early-time evolution of
the [O iii] 5007 Å CSM line indicated the existence of a
denser CSM beginning at a radius of 2850 AU. This distance would have
been reached by material moving at about 4500 km s-1 by
1093 days. We can see from Fig. 8 that at this epoch, a portion of
the blue wing of the H line was moving at velocities exceeding
this value. Thus, the H luminosity at 1093 days may have been
enhanced by the interaction of the ejecta with a denser clumped CSM
region.

The He i line is of much lower S/N and resolution. It peaks
around –2000 km s-1 with the wings extending to km
s-1 and km s-1. We find that by removing the
rest frame velocity component from the H profile and then
degrading its resolution to that of the He i line, a reasonable
match between the two profiles is obtained. We conclude that, if
present, a rest frame zero velocity component was much weaker in the
He i 1.083 m line.
4.3 colour and the origin of dust associated with supernovae
The work described above demonstrates the value of late-time
observations at wavelengths longer than the -band for constraining
the conditions under which dust is present in or near supernovae.
Unfortunately, the only other SN for which such a comprehensive data
set is available is SN 1987A (Bouchet & Danziger 1993 and references
therein; Caldwell et al. 1993 and references therein). Indeed, besides
SNe 1987A and 1998S, there are only four other SNe for which any
or observations beyond 100 days are available viz. SNe 1979C
(IIL) (Merrill 1980, private communication), 1980K (IIL) (Dwek et
al. 1983), 1993J (IIb) (Matthews et al. 2002) and 2002hh (IIp) (Pozzo
et al., in preparation). In Fig. 15, we show the dereddened
colour, , versus time for the 6 SNe. For SNe 1979C and 1980K,
-band rather than -band magnitudes were available. In addition
the -band used for the SN 1993J observations is centred at a
somewhat shorter wavelength (3.68 m) than the more typical value
of around 3.8 m. These magnitudes were therefore converted to
(3.8 m) as described in Appendix A. In addition, the
colours have been corrected for extinction using the Cardelli et
al. (1989) law (see Appendix B). For SNe 1998S and 1993J, the epochs
are with respect to outburst. For the others, the fiducial time is BV
maximum. However, the time from explosion to maximum is probably at
most 15–25 days, and so has a negligible effect on the conclusions
reached below since they are based on late-time observations. For all
six SNe, we see (Fig. 15) that up to day 100, lies in the range
0.0–0.8, with a slight trend toward redder values with time. Beyond
this epoch, the colour continues to redden, sometimes
dramatically so. For blackbody emission, and a conservative maximum
dust temperature of 1300 K, . Moreover, we know that for
SNe 1987A and 1998S, when an IR continuum rising to longer wavelengths
was present, was also in excess of 1.6. It therefore seems
reasonable to take as evidence of IR emission from dust,
via an IR-echo and/or from newly-condensing dust. In Fig. 15,
values as high as 3 are seen, corresponding to a
blackbody temperature as low as 800 K.
During the 100–350 day era, while SNe 1987A and 2002hh showed a gradual
increase in , the values for SNe 1979C, 1980K, 1993J and
1998S jumped to . The different behaviour of
SNe 1987A and 2002hh on the one hand and the other 4 SNe on the other,
suggests IR emission was taking place under somewhat different
physical conditions in these two groups of SNe. A clue to the origin
of this difference is provided by observations which show that
SNe 1979C, 1980K, 1993J and 1998S were surrounded by large amounts of
circumstellar material (SN 1979C - Panagia et al. 1980; Fransson et
al. 1984; Fesen et al. 1999. SN 1980K - Leibundgut et al. 1991; Fesen
et al. 1999. SN 1993J - Garnavich & Ann 1994;
Patat, Chugai & Mazzali 1995; Matheson et al. 2000a, 2000b. SN 1998S -
Leonard et al. 2000; Gerardy et al. 2000; Fassia et al. 2001). In
contrast, the wind density of the SN 1987A progenitor was very low in
its final blue supergiant phase (M⊙yr-1
for 500 km s-1, Lundqvist 1999) and its red supergiant
wind with M⊙yr-1 (e.g., Blondin &
Lundqvist 1993) is too far from the supernova to cause
early CSM interaction. Up to day 389 SN 2002hh also shows little
evidence of strong CSM interaction in its spectra (Pozzo et al., in
preparation). We therefore suggest that supernovae which show
during 100–350 days post-explosion, probably have
massive circumstellar winds in their immediate vicinity.
The precise origin of the strong IR excess [] in the
100–350 d period is not straightforward to determine. As we have
already indicated, for SN 1998S at 136 d it is unlikely that the IR
emission is due to condensing dust since the required IR luminosity
and the red colour would require the emitting dust to be
lying at a velocity of 67,000 km s-1. A similar, though
somewhat weaker, point can be made for SN 1993J at 130 d where,
following correction for photospheric emission (Matthews et al. 2002)
the blackbody temperature would be 800 K and the blackbody
velocity around 8000 km s-1. However, the situation is less clear
for the other examples of high in this era. The
exceptionally high late-time IR luminosity for SN 1979C poses a
particularly difficult challenge. For a blackbody to yield its
flux and colour on day 259 it would have to be expanding at 10,000 km
s-1. This seems to argue against an ejecta dust origin, although
we note the 223 d H profile of SN 1979C also indicates a shock
velocity of about 10,000 km s-1 (Filippenko 1997). Yet to
account for the IR emission with the IR-echo model, it has to be
pushed to an extreme case where around 30% of its early-time
UV-optical output must have been absorbed by CSM dust (Dwek 1983). It
may be, therefore that emission from both a CDS and an IR-echo have to
be invoked to account for the total IR emission from SN 1979C. For
SN 1998S there must also have been a period around 200–300 days when
the contributions from both sources were comparable. Given that
SNe 1980K and 1993J also possessed massive CSMs, we suggest that the
IR excess in these cases may also have been a mixture of emission from
CDS dust and CSM dust. By 500 d we know that dust condensing
and cooling in the ejecta of SN 1987A was almost certainly responsible
for the reddening of the colour (e.g. Wooden 1989; Bouchet
& Danziger 1993; Meikle et al. 1993; Roche et al. 1993; Wooden et al. 1993).
From the discussion above we also favour
dust condensation in SN 1998S as the explanation for its IR luminosity
after 1 year. Given the similarity of SN 1979C to 1998S, we
suggest that its day 440 point also indicates that most of
its IR emission was from CDS dust at this time. We note that at this
phase the blackbody velocity of SN 1979C would be only about 3000 km
s-1.
We therefore propose that the appearance of a strong excess during the first year is indicative of a massive CSM. The IR flux can be a mixture of emission from CDS dust and an IR-echo. Determination of the relative contributions requires good late-time IR and optical coverage, as this paper has shown. For the progenitors of SNe which do not show an IR-excess in the 100–350 day period (e.g., SNe 1987A, 2002hh), it is much less likely that they were surrounded by a massive CSM in their immediate vicinity. If such SNe subsequently produce an IR excess this is probably due to dust condensation throughout the ejecta as was inferred for SN 1987A.
5 Conclusions
We have presented post-300 d infrared and optical observations of the
SN IIn 1998S which extend to longer wavelengths and later epochs than
has ever been achieved for this type of supernova. SN 1998S is only
the second ever supernova for which -band has been detected.
The IR photometry presented here, together with an earlier
measurement by Fassia et al. (2000), has revealed a strong IR-excess
during the period 136 to 1242 days. Spectroscopy in the bands
show a continuum rising towards longer wavelengths. Broad H
and He i 1.083 m line profiles present at 4 months
had undergone a dramatic change when they were recovered by Gerardy et
al. (2000) at about 8 months. By this time, both lines took the form
of a triple peak structure with a central peak close to the supernova
rest frame velocity, and with the two other peaks lying at –4860 km
s-1 and +3400 km s-1 respectively. Gerardy et al. argue that
this could be indicative of emission from a disk-like or ring-like
CSM. Our observations show that as the supernova evolved, the redward
half of the profiles became increasingly weak relative to the blue
part so that by the end of the second year the red side had almost
completely vanished. We agree with Gerardy et al. (2000) and Leonard
et al. (2000) that this is strongly indicative of dust condensation
within the ejecta of the supernova. The change in the appearance of
the H profile by 1093 d together with the early-time evolution
of the narrow CSM [O iii] 5007 Å line may indicate a density
discontinuity at about 2850 AU implying that the progenitor mass-loss
rate underwent a decline about 340 years ago. The velocity of the
extreme blue wing of the H line at 1093 days implies that the
CSM extended to at least 3650 AU indicating that mass loss had been
taking place for at least 430 years prior to explosion.
The intensity and rise of the continuum towards longer
wavelengths together with the relatively bright and
magnitudes suggests strongly that the IR emission was due to hot dust
condensing in the ejecta and/or pre-existing in the CSM. We find that
the SED represented by the magnitudes and by the
continua (when available) can be well-reproduced with
single-temperature blackbody functions having temperatures of about
1250 K at 333 days declining to about 1100 K at 464 days. Subsequent
epochs yield temperatures declining to about 900 K at 3 years,
although the fits are somewhat poorer. This probably indicates an
increasing range of temperatures in the emission regions. Fits
achieved with blackbodies weighted with a or
emissivity are almost always less successful than those
yielded by pure blackbodies. Newly-condensed iron whiskers having a
emissivity also seem unlikely as they would have to form
beyond the CDS. We conclude that the IR emission arises from dust
in the form of IR-opaque clumps or having a large (m) grain
size.
We have considered possible origins for the strong, post-300 d IR
emission. A significant amount of direct heating of condensed ejecta
dust by ongoing radioactive decay is ruled out since the observed IR
emission exceeds the radioactive luminosity by a substantial factor.
We also rule out the possibility of direct heating of pre-existing CSM
dust by the shock, since it would not have reached the edge of the
dust-free cavity. X-ray precursor heating of CSM dust is also ruled
out since it would imply the additional presence of an IR-echo of much
greater luminosity than the observations could support.
We are therefore left with the IR-echo and condensing dust hypotheses.
In favour of the IR-echo explanation, Dwek’s (1983) model with a
dust emissivity suggests that the observed IR
luminosity could be produced by a slow wind of
10-4M⊙ yr-1 which is similar to that
indicated by optical, X-ray and radio observations of SN 1998S. This
assumes the typical ISM gas-to-dust ratio of 160 in the progenitor
CSM. In addition, if we adopt a emissivity law, then
condensing dust would be unable to supply sufficient IR luminosity.
However, our measurements tend to disfavour SEDs weighted with a
or emissivity. Moreover, for the
IR-echo scenario to work for SN 1998S at d, we must invoke a
rather extreme case where at least 20% of the UV-optical luminosity
is absorbed by the CSM dust. In addition, against the IR-echo
scenario is the disagreement in the observed and predicted decline
rates and SEDs, although it may be possible to eliminate these
discrepancies through more detailed IR-echo modelling, including
asymmetric and episodic cases. We therefore do not rule out the
IR-echo scenario. At the earlier epoch of 136 d, an IR-echo seems to
be the only plausible explanation for the IR luminosity.
In favour of the condensing dust hypothesis is the success of the
single temperature pure blackbody fits at about 1 year. Dust
condensing in optically thick clumps within a physically relatively
thin shell symmetrical about the supernova centre-of mass might be
expected to exhibit such temperature uniformity. (Light travel time
effects would be negligible in this case since even at 2 years the
ejecta radius would only be about 10 light days.) Moreover, the
coincidence at about 1 year of the blue-peak velocities of the
H and He i 1.083 m lines with that derived from
the blackbody fits to the IR magnitudes suggests a physical
connection. This is supported by the similar values at about 1 year
for the optical depths derived from the H line profile, the
He i 1.083 m line profile, and that obtained from the
blackbody-derived dust covering fraction. We suggest that this
connection is the CDS formed as a result of the ejecta-CSM
interaction. It is possible that conditions in the CDS would allow the
condensation of dust. Moreover the highest blackbody temperature we
derive is 1250 K, which is also believed to be compatible with grain
condensation, though only slightly higher temperatures may not be
(Gehrz 1988). Assuming that all the dust at about 1 year is at the
same temperature, we estimate that as early as 1 year, over
M⊙ had formed. The apparent decrease in the dust
mass after about 700 d together with the reduced success of the
blackbody fits to the IR SED may indicate that dust condensation was
actually still ongoing but that an increasing proportion had cooled to
temperatures where the bulk of the flux was emitted beyond NIR
wavelengths. Given these arguments, we tend to favour dust
condensation as the origin of both the post-300 d IR luminosity
and the line profile attenuation.
It should be stressed that in the dust condensation scenario, the
total dust mass produced could be very much larger than the
M⊙ lower limit. Most of the dust could
have been invisible due to the clump opacities being much higher than
that necessary to produce a blackbody spectrum, and increasingly large
amounts could have gone undetected due to the cooling of an
increasingly large proportion of the dust beyond the reach of the NIR
observations. The possibility of very opaque clouds is also raised by
Elmhamdi et al. (2003), who obtain a somewhat weaker lower limit of
M⊙ of dust for the type IIP SN 1999em based on
the evolution of the [O i] 6300 Å profile. In addition, our
proposal that dust formed in the CDS does not exclude the possibility
that dust also condensed deep within in the metal-rich SN ejecta
interior. Indeed the presence of a CO emission zone on day 115 at a
velocity of only 2200 km s-1 (Fassia et al. 2001) suggests that a
cool dust-forming environment deep in the ejecta might have developed.
Our dust mass lower limit for SN 1998S is consistent with the
0.1–0.3 M⊙ of condensed dust in SN 1987A deduced from
metal depletion (Lucy et al. 1991; Dwek et al. 1992; Spyromilio & Graham 1992).
However, SN 1987A was peculiar. Moreover, SNe IIn make up only
10–15% of all type II events (Cappellaro & Turatto
2001). Of the three CCSNe (87A, 98S, 99em), only SN 1999em may be
described as ‘typical’, but it is only one event. It is therefore
premature to conclude that high rates of dust condensation occur in
all type II events. Consequently, the exact significance of SNe II
for cosmic dust production is undecided. For further progress to be
made, studies such as presented here should be carried out for a
statistically significant sample of supernovae, and extended to even
longer IR wavelengths.
Comparison of the evolution for a number of type II SNe, suggests that this may be a useful tool for discriminating between supernovae whose progenitors possessed or lacked a massive CSM. We propose that the appearance of a strong excess [] during the first year is indicative of a massive CSM. The IR flux at this time can be a mixture of emission from CDS dust and an IR-echo i.e., two populations of dust may exist. The newly-formed ejecta dust would be responsible for the attenuation of the red sides of the line profiles. Determination of the relative contributions by the two populations to the IR flux requires good wavelength coverage at late-times, extending as far as the and bands or even further to the mid-IR. For the progenitors of SNe which do not show an IR-excess in the 100–350 day period (e.g., SNe 1987A, 2002hh), it is much less likely that they were surrounded by a massive CSM in their immediate vicinity. If such SNe subsequently produce an IR excess this is probably due to dust condensation throughout the ejecta as was inferred for SN 1987A.
Acknowledgements
We thank T. Dahlén, D. Farrah, D. Folha, P. Hirst, S. Leggett and D. Lennon for carrying out some of the observations presented here. We are also grateful to R. Fesen, A. Filippenko, C. Gerardy, D. Leonard and T. Matheson for providing their spectra in digitised format. We also thank D. Leonard and T. Matheson for the use of their unpublished spectrum of 1999 December 15. We thank L. Lucy for helpful discussions. This work is based on observations collected at the Isaac Newton Telescope (INT), La Palma, the Nordic Optical Telescope (NOT), La Palma and the United Kingdom Infrared Telescope (UKIRT), Hawaii. The INT is operated on the island of La Palma by the Isaac Newton Group (ING) in the Spanish Observatorio del Roque de los Muchachos of the Instituto de Astrofisica de Canarias. The NOT is operated on the island of La Palma jointly by Denmark, Finland, Iceland, Norway, and Sweden, in the Spanish Observatorio del Roque de los Muchachos of the Instituto de Astrofisica de Canarias. UKIRT is operated by the Joint Astronomy Centre on behalf of the U.K. Particle Physics and Astronomy Research Council. Some of the data reported here were obtained as part of the ING and UKIRT Service Programmes. MP is supported through PPARC grant PPA/G/S/2001/00512. PL and NNC are grateful for support from the Royal Swedish Academy of Sciences.
References
- [1] Anupama G.C., Sivarani T., Pandey G., 2001, A&A, 367, 506
- [2] Aspin C., 1996, Starlink User Note 41.0
- [3] Bersanelli M., Bouchet P., Falomo R., 1991, A&A, 252, 854
- [4] Blondin J.M., Lundqvist P., 1993, ApJ, 405, 337
- [5] Bode M.F., Evans A., 1980, MNRAS, 193, 21
- [6] Bouchet P., Danziger I.J., 1993, A&A, 273, 451
- [7] Bowen D.V., Roth K.C., Meyer D.M., Blades J.C., 2000, ApJ, 536, 225
- [8] Burstein D., Heiles C., 1982, AJ, 87, 1165
- [9] Caldwell J.A.R. et al., 1993, MNRAS, 262, 313
- [10] Cappellaro E., Turatto M., 2001, in The influence of binaries on stellar population studies, Dordrecht: Kluwer Academic Publishers, 2001, xix, p. 582
- [11] Cardelli J.A., Clayton G.C., Mathis J.S., 1989, ApJ, 345, 245
- [12] Catchpole R., Glass I., 1987, IAU Circ. 4457
- [13] Cernuschi F., Marsicano F.R., Kimel I., 1965, Ann. d’Astr., 28, 860
- [14] Cernuschi F., Marsicano F., Codina S., 1967, Ann. d’Astr., 30, 1039
- [15] Chevalier R.A., Fransson C., 1985, in Supernovae as distance indicators; Proceedings of the Workshop, Cambridge, MA, September 27-28, 1984. Berlin and New York, Springer-Verlag, 1985, p. 123.
- [16] Chevalier R.A., Fransson C., 1994, ApJ, 420, 268
- [17] Chugai N.N., 2001, MNRAS, 326, 1448
- [18] Chugai N.N., Danziger I.J., 1994, MNRAS, 268, 173
- [19] Chugai N.N., Blinnikov S.I., Fassia A., Lundqvist P., Meikle W.P.S., Sorokina E.I., 2002, MNRAS, 330, 473
- [20] Clocchiatti A., Wheeler J.C., Barker E.S., Filippenko A.V., Matheson T., Liebert J.W., 1995, ApJ, 446, 167
- [21] Colgan S.W.J., Haas M.R., Erickson E.F., Lord S.D., Hollenbach D.J., 1994, ApJ, 427, 874
- [22] Danziger I.J., Lucy L.B., Bouchet P., Guiffes C., 1991, in Woosley S.E., ed., Supernovae. Springer-Verlag, New York, p.69
- [23] de Vaucouleurs G., de Vaucouleurs A., Buta R., Ables H.D., Hewitt A.V., 1981, PASP, 93, 36
- [24] Draper P.W., Gray N., Berry D.S., 2002, Starlink User Note 214.10
- [25] Dunne L., Eales S., Ivison R., Morgan H., Edmunds M., 2003, Nat, 424, 285
- [26] Dwek E., Werner M.W., 1981, ApJ, 249, 138
- [27] Dwek E., 1983, ApJ, 274, 175
- [28] Dwek E., 1985, ApJ, 297, 719
- [29] Dwek E., 1991, in Supernovae. The Tenth Santa Cruz Workshop in Astronomy and Astrophysics, July 9-21, 1989, Lick Observatory. S.E. Woosley editor, Springer-Verlag, New York, p. 54
- [30] Dwek E., 1998, ApJ, 501, 643
- [31] Dwek E., 2004, ApJ, in press; 2004, preprint (astro-ph/0401074).
- [32] Dwek E. et al., 1983, ApJ, 274, 168
- [33] Dwek E., Moseley S.H., Glaccum W., Graham J.R., Loewenstein R.F., Silverberg R.F., Smith R.K., 1992, ApJ, 389, L21
- [34] Economou F., Jenness T., Currie M., Adamson A., Allan A., Cavanagh B., 2003, Starlink User Note 230.5.
- [35] Elmhamdi A. et al., 2003, MNRAS, 338, 939
- [36] Falk S.W., Arnett W.D., 1977, ApJS, 33, 515
- [37] Fassia A. et al., 2000, MNRAS, 318, 1093
- [38] Fassia A. et al., 2001, MNRAS, 325, 907
- [39] Fesen R.A. et al., 1999, AJ, 117, 725
- [40] Filippenko A.V., 1997, ARA&A, 35, 309
- [41] Filippenko A.V., Moran E.C., 1998, IAU Circ. 6830
- [42] Fransson C., Benvenuti P., Wamsteker W., Gordon C., Hempe K., Reimers D., Palumbo G.G.C., Panagia N., 1984, A&A, 132, 1
- [43] Garnavich P.M., Ann H.B., 1994, AJ, 108, 1002
- [44] Garnavich P., Challis P., Kirshner R., 1998, IAU Circ. 7047
- [45] Gehrz R.D., 1988, ARA&A, 26, 377
- [46] Gehrz R., 1989, in Interstellar Dust: Proceedings of the 135th Symposium of the International Astronomical Union, 26-30 July, 1988, Santa Clara, California. L.J. Allamandola and A.G.G.M. Tielens editors, Kluwer Academic Publishers, Dordrecht, p. 445
- [47] Gerardy C.L., Fesen R.A., Höflich P., Wheeler J.C., 2000, AJ, 119, 2968
- [48] Gerardy C.L. et al., 2002, ApJ, 575, 1007
- [49] Graham J.R., Meikle W.P.S., 1986, MNRAS, 221, 789
- [50] Grasberg E.K., Imshennik V.S., Nadyozhin D.K., 1971, Ap& SS, 10, 28
- [51] Gruendl R.A., Chu Y.H., Van Dyk S.D., Stockdale C.J., 2002, AJ, 123, 2847
- [52] Hamuy M., 2003, in Core Collapse of Massive Stars, ed. C.L. Fryer, Kluwer, Dordrecht.
- [53] Hobson M.P. and Padman R., 1993, MNRAS, 264, 161
- [54] Hoyle F., Wickramasinghe N.C., 1970, Nat, 226, 62
- [55] Hoyle F., Wickramasinghe N.C., 1999, Ap&SS, 268, 77
- [56] Leibundgut B., Kirshner R.P., Pinto P.A., Rupen M.P., Smith R.C., Gunn J.E., Schneider D.P., 1991, ApJ, 372, 531
- [57] Kozasa T., Hasegawa H., Nomoto K., 1989, ApJ, 344, 325
- [58] Lentz E.J. et al., 2001, ApJ, 547, 406
- [59] Leonard D.C., Filippenko A.V., Barth A.J., Matheson T., 2000, ApJ, 536, 239
- [60] Lepp S., Dalgarno A., McCray R., 1990, ApJ, 358, 262
- [61] Li C., Wan Z., 1998, IAU Circ. 6829
- [62] Li H., McCray R., Sunyaev R.A., 1993, ApJ, 419, 824
- [63] Li W., Filippenko A.V., Van Dyk S.D., Hu J., Qiu Y., Modjaz M., Leonard D.C., 2002, PASP, 114, 403
- [64] Liu Q.-Z., Hu J.-Y., Hang H.-R., Qiu Y.-L., Zhu Z.-X., Qiao Q.-Y., 2000, A&ASS, 144, 219
- [65] Lucy L.B., Danziger I.J., Gouiffes C., Bouchet P., 1989, in Tenorio-Tagle G., Moles M., Melnick J., eds, IAU Colloq. 120, Structure and Dynamics of the Interstellar Medium. Springer-Verlag, New York, p. 164
- [66] Lucy L.B., Danziger I.J., Gouiffes C., 1991, in Supernovae. The Tenth Santa Cruz Workshop in Astronomy and Astrophysics, July 9-21, 1989, Lick Observatory. S.E. Woosley editor, Springer-Verlag, New York, p. 82
- [67] Lundqvist P., 1999, ApJ, 511, 389
- [68] Lundqvist P., Fransson C., 1988, A&A, 192, 221
- [69] McGregor P.J., Hyland, 1987, IAU Circ. 4468
- [70] Matheson T. et al., 2000a, AJ, 120, 1487
- [71] Matheson T., Filippenko A.V., Ho L.C., Barth A.J., Leonard D.C., 2000b, AJ, 120, 1499
- [72] Matthews K., Neugebauer G., Armus L., Soifer B.T., 2002, AJ, 123, 753
- [73] Meikle W.P.S., Spyromilio J., Allen D.A., Varani G.-F., Cumming R.J., 1993, MNRAS, 261, 535
- [74] Meikle P., Mattila S., Smartt S., MacDonald E., Clewley L., Dalton G., 2002, IAU Circ. 8024
- [75] Meikle P., Fassia A., Geballe T.R., Lundqvist P., Chugai N., Farrah D., Sollerman J., 2003, in From Twilight to Highlight: The Physics of Supernovae, Proceedings of the ESOMPAMPE Workshop, Garching, Germany, 29-31 July 2002, p.229
- [76] Merline W.J., Howell S.B., 1995, Exp. Astron., 6, 163
- [77] Morgan H.L., Dunne L., Eales S.A., Ivison R.J., Edmunds M.G., 2003, ApJ, 597, L33
- [78] Morrison P., Sartori L., 1969, ApJ, 158, 541
- [79] Moseley S.H., Dwek E., Glaccum W., Graham J.R., Loewenstein R.F., Silverberg R.F., 1989, Nat, 340, 697
- [80] Nozawa T., Kozasa T., Umeda H., Maeda K., Nomoto K., 2003, ApJ, 598, 785
- [81] Panagia N. et al., 1980, MNRAS, 192, 861
- [82] Patat F., Chugai N., Mazzali P.A., 1995, A&A, 299, 715
- [83] Pooley D. et al., 2002, ApJ, 572, 932
- [84] Roche P.F., Aitken D.K., Smith C.H., 1993, MNRAS, 261, 522
- [85] Romaniello M., Panagia N., Scuderi S., Kirshner R.P., 2002, AJ, 123, 915
- [86] Roscherr B., Schaefer B.E., 2000, ApJ, 532, 415
- [87] Sanders R.H., Verheijen M.A.W., 1998, ApJ, 503, 97
- [88] Schlegel E.M., 1990, MNRAS, 244, 269
- [89] Shortridge K., 1991, FIGARO General Data Reduction and Analysis Starlink MUD, RAL, June 1991.
- [90] Spyromilio J., Graham J.R., 1992, MNRAS, 255, 671
- [91] Spyromilio J., Leibundgut B., 1996, MNRAS, 283, L89
- [92] Spyromilio J., Meikle W.P.S., Learner R.C.M., Allen D.A., 1988, Nat, 334, 327
- [93] Spyromilio J., Meikle W.P.S., Allen D.A., 1990, MNRAS, 242, 669
- [94] Spyromilio J., Stathakis R.A., Cannon R.D., Waterman L., Couch W.J., 1991, MNRAS, 248, 465
- [95] Spyromilio J., Leibundgut B., Gilmozzi R., 2001, A&A, 376, 188
- [96] Suntzeff N.B., Bouchet P., 1990, AJ, 99, 650
- [97] Tielens A.G.G.M., 1990, in Submillimitre Astronomy; Watt G.D., Webster A.S., eds. Dordrecht, Kluwer, p.13.
- [98] Timmes F.X., Woosley S.E., Hartmann D.H., Hoffman R.D., 1996, ApJ, 464, 332
- [99] Todini P., Ferrara A., 2001, MNRAS, 325, 726
- [100] Tokunaga A.T., Simons D.A., Vacca W.D., 2002, PASP, 114, 180
- [101] Tully R.B., 1988, Nearby Galaxies Catalog (New York: Cambridge University Press)
- [102] Usov V.V., 1991, MNRAS, 252, 49
- [103] Wang L., Howell D.A., Höflich P., Wheeler J.C., 2001, ApJ, 550, 1030
- [104] Whitelock P.A. et al., 1989, MNRAS, 240, 7
- [105] Wickramasinghe N.C., 1992, Ap&SS, 198, 161
- [106] Wilms J., Allen A., McCray R., 2000, ApJ, 542, 914
- [107] Wooden D.H., 1989, PhD Thesis California University, Santa Cruz
- [108] Wooden D.H., Rank D.M., Bregman J.D., Witteborn F.C., Tielens A.G.G.M., Cohen M., Pinto P.A., Axelrod T.S., 1993, ApJS, 88, 477
- [109] Woosley S.E., Weaver T.A. 1995, ApJS, 101, 181
- [110] Wright E.L., 1980, ApJ, 242, L23
Appendix A Conversion of to colour
For SNe 1979C and 1980K, -band rather than -band magnitudes were available. In addition the -band used for the SN 1993J observations is centred at a somewhat shorter wavelength (3.68 m) than the more typical value of around 3.8 m. We therefore converted these magnitudes to (3.8 m), based on the colours, spectra and dust temperatures derived for SN 1998S around the same period. We adopted (3.8 m) = (3.5 m) + 0.3 for SNe 1979C and 1980K, and (3.8 m) = (3.68 m) + 0.12 for SN 1993J. At epochs earlier than 100 days, when the spectra are photosphere-dominated, the differences between and are small and so no corrections were made.
| SN | E() | E() |
|---|---|---|
| 1979C | 0.18292929de Vaucouleurs et al. 1981. | 0.04 |
| 1980K | 0.4 303030Burstein & Heiles 1982. | 0.08 |
| 1987A | 0.2 313131Romaniello et al. 2002. | 0.04 |
| 1993J | 0.24323232Clocchiatti et al. 1995. | 0.05 |
| 1998S | 0.22 333333Fassia et al. 2000. | 0.05 |
| 2002hh | 2.0 343434Meikle et al. 2002 | 0.48 |
Appendix B Extinction correction for the colour.
Prior to plotting the colour evolution in Fig. 15, correction for extinction was applied using E() E(), derived from the interstellar extinction law of Cardelli et al. (1989). These corrections are listed in Table B1. Apart from the case of SN 2002hh, the corrections are small.