The null result of a search for pulsational variations of the surface magnetic field in the roAp star Equulei
Abstract
We describe an analysis of the time-resolved measurements of the surface magnetic field in the roAp star Equ. We have obtained a high-resolution and high S/N spectroscopic time-series, and the magnetic field was determined using Zeeman resolved profiles of the \textFe ii 6149.25 Å and \textFe i 6173.34 Å lines. Contrary to recent reports we do not find any evidence of magnetic variability with pulsation phase, and derive an upper limit of 5–10 G for pulsational modulation of the surface magnetic field in Equ.
keywords:
stars: chemically peculiar – stars: oscillations – stars: magnetic field – stars: individual: Equ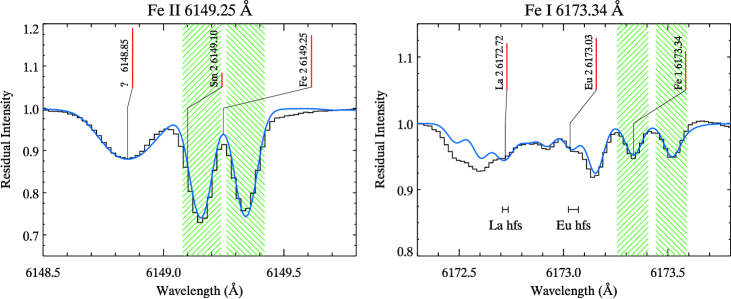
| UT date | Instrument/ | Wavelength | Resolution | Exposure | Number of | Start HJD | End HJD | Typical |
|---|---|---|---|---|---|---|---|---|
| telescope | region (Å) | () | time (s) | exposures | (2450000+) | (2450000+) | SNR | |
| 22/07/1999 | CES/ESO 3.6-m | 6140–6165 | 166 000 | 60 | 31 | 1381.78344 | 1381.82390 | 190 |
| 26/09/2002 | Gecko/CFHT | 6104–6194 | 115 000 | 90 | 64 | 2543.82314 | 2543.92191 | 230 |
1 Introduction
After discovery of the conspicuous radial velocity (RV) pulsational variations in a sample of rapidly oscillating magnetic peculiar (roAp) stars (Kanaan & Hatzes \sciteKH98, Savanov, Malanushenko & Ryabchikova \sciteSMR99, Kochukhov & Ryabchikova \sciteKR01a for Equ; Baldry et al. \sciteBBV98, Baldry & Bedding \sciteBB00, Kochukhov & Ryabchikova \sciteKR01b for Cir and HD 83368), attempts to search for magnetic field variations over the pulsational period have been made. First, Hubrig et al. [2004] tried to measure pulsational variability of the longitudinal magnetic field in six roAp stars. Their sample included Equ – probably one of the most favourable stars for this kind of investigation. Equ is a bright northern roAp star with a strong magnetic field, and with one of the largest pulsational RV amplitudes which exceeds 1000 m s-1 in individual spectral lines. The extremely slow rotation of Equ, leading to very sharp spectral lines, makes this star the best candidate for any study of the pulsational variability in spectroscopy. Hubrig et al. [2004] used low-resolution Zeeman time-series observations and measured using hydrogen lines and unresolved blends of metal lines. They failed to detect any variability beyond the formal errors of their measurements which were 40–100 G.
According to a coarse theoretical estimate made by Hubrig et al. [2004] there should exist a linear relation between magnetic field variability over the pulsational cycle and the RV amplitudes. In roAp stars the largest RV amplitudes are observed in the lines of first and second ions of rare-earth elements (REE), while they are usually below measurement errors for the lines of iron group elements. Thus, high-resolution spectroscopy and spectropolarimetry of selected REE spectral lines is a more promising tool for an investigation of possible rapid magnetic oscillations in roAp stars. Taking this into account Leone & Kurtz [2003] obtained a high-resolution (R=115 000), high S/N time-series of observations of Equ with a circular polarization analyzer, and measured using four \textNd iii lines. They reported the discovery of pulsational variations with amplitudes between 112 to 240 G and, more surprisingly, with discrepant phases of magnetic maximum for different \textNd iii lines. Leone & Kurtz’s result was based on only 18 time-resolved spectra. A year later Kochukhov, Ryabchikova & Piskunov [2004] obtained a time-series of polarimetric observations of Equ with a smaller resolving power (R=38 000), but acquired more than 200 spectra over 3 nights, more than compensating for lesser quality of individual spectra. Kochukhov et al. [2004] used simultaneously 13 \textNd iii lines for magnetic measurements which allowed them to achieve a substantial reduction of the error of the determinations. They did not confirm longitudinal field variability over the pulsational period in Equ and gave a conservative upper limit of 40 G for the amplitude of pulsational modulation of determined from \textNd iii lines.
Another attempt to search for possible rapid magnetic variability in Equ was made by Savanov, Musaev & Bondar [2003]. They measured the surface magnetic field variations over the pulsational period using the \textFe ii 6149.25 Å line observed in unpolarized light. Due to a very simple Zeeman pattern (two equally separated - and -components) this line is ideal for measurements (see Mathys et al. \sciteMHL97). Savanov et al. reported a 1.8 detection of variability with an amplitude of 9953 G. At the same time they did not find periodic variations of RV measured for the individual Zeeman resolved components of the \textFe ii 6149.25 Å doublet exceeding their error limit (100–120 m s-1). The authors used high-resolution R=120 000 time-series observations, but the S/N of a single spectrum did not exceed 40–60. Clearly, the result of Savanov et al. [2003] is marginal and needs to be confirmed or rejected with data of better quality.
In this paper we present the results of a new search for pulsational variations of in Equ using high-resolution and high S/N time-resolved observations of this star. These observational data allowed us to obtain precise measurements of the magnetic field in Equ, and strongly constrain possible changes of over the pulsation cycle of the star.
2 Observations and data reduction
The time-resolved observations of Equ were obtained using the single-order Gecko coudé spectrograph with the EEV1 CCD at the 3.6-m Canada-France-Hawaii telescope. Table 1 gives details of this spectroscopic time-series dataset. The spectra cover approximately the spectral window 6104–6194 Å. This wavelength interval contains two Zeeman resolved lines, \textFe ii 6149.25 Å and \textFe i 6173.34 Å. It also has strong \textNd iii and \textPr iii lines, optimal for investigation of pulsational variability of roAp stars, as well as strong and weak lines of other elements such as Si, Ca, Cr, and Ba.
The spectra were reduced using standard IRAF tasks. Each stellar, flat and calibration frame had a mean bias subtracted and was then cleaned of cosmic ray hits and extracted to one dimension. Extracted stellar spectra were divided by an extracted mean flat field, and the continuum was fit with a third-order Legendre polynomial, using the same rejection parameters for all spectra so that the continuum fit is as uniform as possible. The wavelength scale was established using about 40 lines of a ThAr emission lamp, resulting in an RMS scatter about the adopted pixel-wavelength polynomial (a sixth-order Legendre polynomial) of about Å. The wavelength scale was linearly interpolated between ThAr lamp spectra taken before and after the stellar series, but the spectra were not resampled to a linear wavelength spacing.
In this paper we also used 31 very high resolution time-resolved observations of Equ analysed by Kochukhov & Ryabchikova [2001a]. These time-resolved data were obtained with the Coudé Echelle Spectrograph (CES), fiber-linked to the Cassegrain focus of the ESO 3.6-m telescope. The highest resolution CES image slicer and the ESO CCD#38 were used, allowing us to reach a resolving power of and record spectra in the 6140–6165 Å wavelength interval. We refer the reader to Kochukhov & Ryabchikova [2001a] for other details of the acquisition and reduction of the CES spectra of Equ.
| Line | (min) | (m s-1) | |
|---|---|---|---|
| 22/07/99, CES/ESO 3.6-m | |||
| \textNd iii 6145.07 | 12.2900.071 | 454.623.4 | 0.8150.016 |
| \textFe ii 6149.25b | 12.290 | 10.15.7 | 0.3830.089 |
| \textFe ii 6149.25r | 12.290 | 9.45.1 | 0.2150.085 |
| 26/09/02, Gecko/CFHT | |||
| \textNd iii 6145.07 | 12.2810.039 | 165.110.8 | 0.4620.021 |
| \textFe ii 6149.25b | 12.281 | 3.62.5 | 0.0000.113 |
| \textFe ii 6149.25r | 12.281 | 5.23.2 | 0.4150.219 |
| \textFe i 6173.34c | 12.281 | 5.414.9 | 0.2220.143 |
| \textFe i 6173.34r | 12.281 | 17.215.8 | 0.6280.234 |
3 Magnetic field and radial velocity measurements
As a first step in our analysis of Equ we computed synthetic spectra in the region of the Zeeman resolved iron lines \textFe ii 6149.25 Å and \textFe i 6173.34 Å (hereafter we refer to these spectral features simply as the \textFe ii and \textFe i lines) using abundances, Fe stratification and model atmosphere from the study of Ryabchikova et al. [2002]. Synthetic spectra of Equ were calculated with the SYNTHMAG code (Piskunov \scitePISK99), modified to take into account vertical stratification of chemical abundances. The simplest model, with a constant magnetic field over the stellar surface, was adopted. The splitting pattern of the \textFe i line is a pure Zeeman triplet with unshifted central -component and two -components. To fit the relative intensity of the - and -components of this line the magnetic field vectors in our model have to be inclined by to the stellar surface. To look more carefully at the blending effects we took into account the hyperfine structure of nearby \textLa ii 6172.72 Å and \textEu ii 6173.03 Å. An unidentified line at 6148.85 Å, which shows a pulsational behaviour typical for REE lines, was synthesized with arbitrary atomic parameters to take into account its possible blending of the blue-shifted \textFe ii component.
The comparison of these calculations with the average CFHT spectrum is presented in Fig. 1. This figure shows that the \textFe ii line is free from significant blends, which enables accurate pulsational analysis of both the red and blue components of this Zeeman doublet. In particular, we found that pulsational variability of the 6148.85 Å feature has negligible influence on the measurements of the blue component of the \textFe ii line. On the other hand, the blue -component of the \textFe i line is blended by the \textEu ii 6173.03 Å and hence is not suitable for time-resolved measurements of . Consequently, RV analysis and field modulus measurements using the \textFe i line were based on the - and red -component.
We determined the time-dependent position of the centres of Zeeman components using centre-of-gravity measurements within the spectral regions indicated in Fig. 1. We note that an alternative technique of fitting a superposition of three gaussian profiles to the 6148.85 Å and \textFe ii line represents a better way to derive from time-averaged spectra because it allows to model partially resolved \textFe ii components and remove the blending contribution of the 6148.85 Å feature. However, this method may encounter difficulties in describing time-resolved profiles of REE lines, including the 6148.85 Å line, which show substantial RV shifts and exhibit profile asymmetries associated with non-radial pulsation velocity field. Consequently, we prefer to use the centre-of-gravity technique throughout this paper and show the gaussian fitting results in Figs. 2–4 for comparison purpose only.
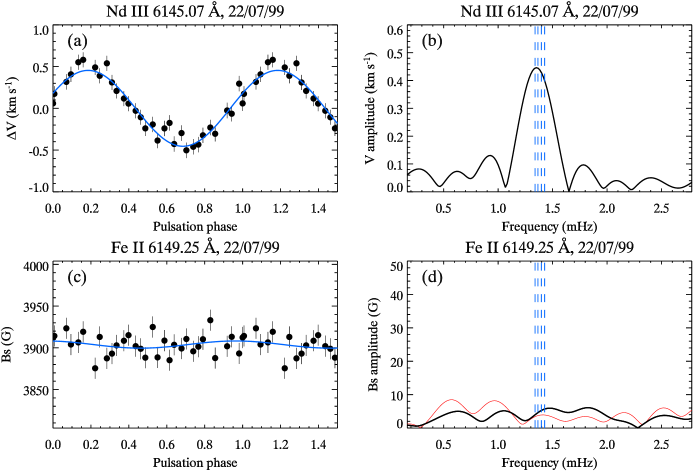
The RV obtained from the iron lines were compared with the outstanding pulsational variation seen in the \textNd iii 6145.07 Å line. This feature allows us to verify the presence of rapid spectroscopic variability during our observations of Equ and to determine the oscillation period and amplitude with high accuracy. For each available dataset we established the period of the spectroscopic pulsational variation using this \textNd iii line and then fitted the phase (counted from the start HJD, see Table 1) and the amplitude of the Fe RV measurements using a non-linear least-squares technique. Results of this analysis are summarized in Table 2. We do not find any pulsational variation of the RV determined for the Zeeman resolved components of the Fe lines exceeding about 5–10 m s-1 for the \textFe ii and m s-1 for the \textFe i line.
The measurements of the \textFe ii line reported in Table 2 supersede tentative RV amplitude of 64 m s-1 given by Kochukhov & Ryabchikova [2001a], who used the same CES dataset as studied here. This difference mainly comes from the fact that in the present paper we adopt a fixed pulsation period ( min) for the analysis of the individual \textFe ii Zeeman components, while a set of four photometric periods was tested in our previous paper and the corresponding maximum RV amplitude for min and for the whole line was reported.
The measurements of the line centre positions were converted to surface field using the expression:
| (1) |
where is the half of the wavelength difference between the red and blue Zeeman components of the \textFe ii line or the distance between the red - and the -component of the \textFe i line, is the mean Landé factor and is the laboratory wavelength of a line. Based on the information available from the VALD database (Kupka et al. \sciteKPR99) we adopted and 1.35 for the \textFe i and \textFe ii lines respectively. The internal precision of our magnetic measurements is estimated to be 10 G for the \textFe ii line and 70 G for the weaker \textFe i line. At the same time the average field strengths derived from the two lines are substantially different in the CFHT spectra: centre-of-gravity measurements of the \textFe ii line give G ( G is obtained with multiple fit of three gaussians), while G ( G) is derived using the weaker \textFe i line. This G difference is confirmed by the spectrum synthesis. The discrepant might be related to inaccuracy of the tabulated Landé factors, or it could be real and reflect different horizontal and/or vertical formation regions of the two diagnostic lines, or the effects of saturation in the \textFe ii line. An average field strength of G ( G) was obtained from the \textFe ii line in the ESO spectra of Equ.
| Line | (G) | (G) | (G) | |
| 22/07/99, CES/ESO 3.6-m | ||||
| \textFe ii 6149.25 | 4.33.2 | 0.0370.120 | 13.0 | 13 |
| 26/09/02, Gecko/CFHT | ||||
| \textFe ii 6149.25 | 1.21.6 | 0.2940.219 | 9.2 | 5 |
| \textFe i 6173.34 | 7.911.8 | 0.6280.234 | 66.4 | 28 |
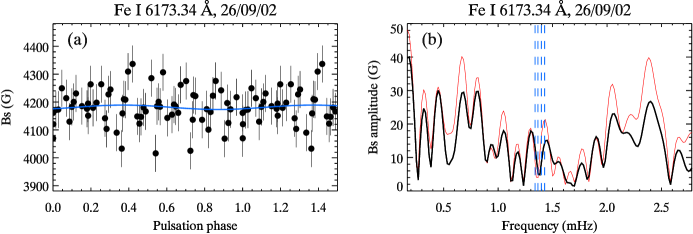
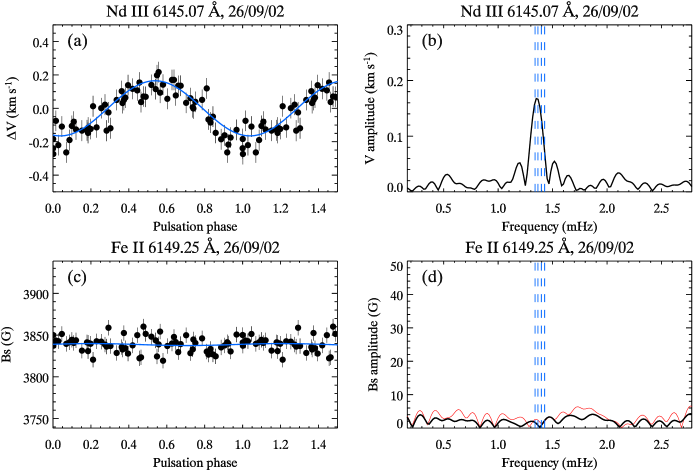
Table 3 and Figs. 2–4 present results of our time-series analysis of the surface field measurements. We see absolutely no evidence for any magnetic variations during the pulsation cycle in Equ. Formal results of the least-squares fits with a fixed pulsation period as derived from the \textNd iii line indicate insignificant amplitudes, all below 10 G. Our most precise time-resolved magnetic measurements are derived from the CFHT dataset. Analysis of the 6149.25 Å line in these spectra results in formal amplitude of just 1 G, with the highest noise peaks in the amplitude spectrum (Fig. 3d) not exceeding 5 G over the whole period domain typical for roAp pulsations.
A 3 upper limit of the amplitude of magnetic variability was estimated from Monte Carlo simulations by sampling a sinusoidal signal at the phases of our observations and adding a random noise, characteristic of the scatter of the measurements. This rigorous statistical estimate is reported in Table 3 and indicates that, at the 3 confidence level, no magnetic variability with the amplitude 5 G is seen in Equ during the night of our CFHT observation.
4 Conclusions
Our time-resolved magnetic measurements of Equ have achieved the highest precision for a roAp star, but reveal no evidence of pulsational modulation of the field strength. We constrain possible magnetic variability to be below 5 G in Fe lines. These results suggest that the marginal detection of 100 G variability during the pulsation cycle reported in Equ by Savanov et al. [2003] is spurious, and probably stems from insufficient precision of the measurements in that study.
The null result reported in the present paper complements non-detection of the pulsational variability of determined from \textNd iii lines (Kochukhov et al. \sciteKRP04). It should be recalled that the Fe lines studied in our paper and the REE lines showing strong pulsational RV modulation are formed at substantially different atmospheric depths due to the extreme stratification of chemical abundances in cool Ap stars and in Equ in particular. Stratification analysis presented by Ryabchikova et al. [2002] allows us to conclude that \textNd iii lines sample very high atmospheric layers with optical depths , while the Fe lines are formed below . The striking difference in the RV amplitudes of Fe and \textNd iii lines is then attributed to an outward increase of pulsational amplitude by roughly a factor of 50–100. This increase is none the less not accompanied by an increase or even the presence of any observable oscillations of the magnetic field structure. Combining the results of this paper with the study of Kochukhov et al. [2004], and taking into account that for Equ , we find that at all observed atmospheric depths changes by less than about G per m s-1 of corresponding velocity oscillations. Hence, possible magnetic variability is constrained to be below 1% of the field strength.
We note that Equ is distinguished among the roAp stars by its strong magnetic field, sharp lines and the exceptionally high amplitude of pulsational line profile changes. Yet this star defies any attempts to detect magnetic variability with pulsation phase. This suggests that rapid magnetic modulation may be even more difficult to detect in other roAp pulsators. The outcome of our monitoring of and in Equ demonstrates that very accurate measurements of the Zeeman resolved lines can yield more precise magnetic time-series compared with the polarimetric observations. Therefore, the most promising direction for future attempts to detect magnetic oscillations in Equ (which are in any case unlikely to exceed a few tens of gauss) would be to observe those \textNd ii, \textNd iii and \textPr iii lines which are characterized by large pulsational RV shifts and at the same time show Zeeman resolved profiles. Unfortunately, the extra broadening of the pulsating lines (see Kochukhov & Ryabchikova \sciteKR01a) strongly smears observed Zeeman structure and makes proposed study of oscillations extremely difficult.
Acknowledgments
This paper is based on observations obtained at the European Southern Observatory (La Silla, Chile) and at the Canada-France-Hawaii Telescope. We acknowledge support by the Lise Meitner fellowship to OK (FWF project M757-N02), by the FWF project P 14984, by the Natural Sciences and Engineering Research Council of Canada, by the Russian Federal program ‘Astronomy’ (part 1102) and by RFBR (grant 04-02-16788).
References
- [1998] Baldry I. K., Bedding T. R., Viskum M., Kjeldsen H., Frandsen S., 1998, MNRAS, 295, 33
- [2000] Baldry I. K., Bedding T. R., 2000, MNRAS, 318, 341
- [2004] Hubrig S., Kurtz D. W., Bagnulo S., Szeifert T., Schoeller M., Mathys G., Dziembowski W. A., 2004, A&A, 415, 661
- [1998] Kanaan A., Hatzes A. P., 1998, ApJ, 503, 848
- [2001a] Kochukhov O., Ryabchikova T., 2001a, A&A, 374, 615
- [2001b] Kochukhov O., Ryabchikova T., 2001b, A&A, 377, L22
- [2004] Kochukhov O., Ryabchikova T., Piskunov N., 2004, A&A, 415, L13
- [1999] Kupka F., Piskunov N., Ryabchikova T. A., Stempels H. C., Weiss W. W., 1999, A&AS, 138, 119
- [2003] Leone F., Kurtz D. W., 2003, A&A, 407, L67
- [1996] Martinez P. et al., 1996, MNRAS, 282, 243
- [1997] Mathys G., Hubrig S., Landstreet J. D., Lanz T., Manfroid J., 1997, A&AS 123, 353
- [1999] Piskunov N. E., 1999, In: 2nd Workshop on Solar Polarization, J. Stenflo and K.N. Nagendra (eds.), Kluwer Academic Publishers, Dodrecht, 515
- [2002] Ryabchikova T., Piskunov N., Kochukhov O., Tsymbal V., Mittermayer P., Weiss W. W., 2002, A&A, 384, 545
- [2003] Savanov I., Musaev F. A., Bondar A. V., 2003, IBVS, 5468
- [1999] Savanov I. S., Malanushenko V. P., Ryabchikova T. A., 1999, Astron. Lett., 25, 802