Highly ionized Fe K emission lines from the LINER galaxy M 81 ††thanks: Based on observations obtained with XMM-Newton, an ESA science mission with instruments and contributions directly funded by ESA Member States and the USA (NASA)
We present spectral and timing results from a long (130 ks) XMM-Newton EPIC observation of the nucleus of the Seyfert/LINER galaxy M 81. During the observation the X-ray flux varied by 20%, but there was no significant change in spectral shape. The 2–10 keV spectrum is well described by a power law continuum and three narrow Fe K emission lines at 6.4, 6.7 and 6.96 keV. The three emission lines have equivalent widths of , and eV respectively. The ratios of the three lines are thus more similar to those observed from the Galactic Centre region than to those typically observed from Seyfert galaxies. The high ionization lines most likely originate either from photoionized gas within 0.1 pc of the nucleus of M 81, or from a non-thermal distribution of cosmic-ray electrons interacting with the 0.2-0.6 keV thermal plasma which is found in the bulge of M 81.
Key Words.:
Galaxies: individual: M 81 (=NGC 3031) – Galaxies: nuclei – Galaxies: Seyfert – Galaxies: active – X-rays: galaxies1 Introduction
At a distance of 3.6 Mpc (Freedman et al. 1994), the Sab spiral M 81 is the closest galaxy showing the spectral signatures of a “low ionization nuclear emission-line region” (LINER). LINER characteristics are found in a significant fraction of all galaxies (between 1/5 and 1/3), and the nature of the relationship between LINERs and low-luminosity AGN (LLAGN) has been a long standing question (Ho, Filippenko & Sargent 1997, Heckman 1980). The presence of a LLAGN in M 81 is well established: the unresolved nuclear source emits a non-stellar UV continuum, broad optical/UV emission lines, and a significant flux of non-thermal X–rays (Ho, Filippenko & Sargent 1996). From dynamical studies, the mass of the central compact object is found to be (Ho 1999). With a bolometric luminosity of erg s-1, M 81 is radiating at of its Eddington luminosity (Ho, Filippenko & Sargent 1996).
The nuclear X–ray source has a power law spectral shape in the 0.3-10 keV energy range (Petre et al. 1993, Ishisaki et al. 1996, Swartz et al. 2003). The spectrum is absorbed by a small column density ( cm-2) of material intrinsic to M 81, and below 2 keV a multitude of emission lines from circumnuclear, thermal gas can be seen in the XMM-Newton RGS spectrum of the nucleus (Page et al. 2003). Above 2 keV, the most remarkable feature seen in the spectrum is an emission line at keV, corresponding to Fe XXV K (Ishisaki et al. 1996, Pellegrini et al. 2000). Using data from BeppoSAX, Pellegrini et al. (2000) claim that there is an absorption edge at keV, which could also arise in Fe XXV, indicating that the nucleus is seen through a large column density ( cm-2) of highly ionized gas. The 2-10 keV luminosity is known to vary in the range erg s-1 on a timescale of years, and variations of about 30% have been observed on a timescale of s (Pellegrini et al. 2000; Ishisaki et al. 1996).
In this paper we examine the time variation and the 2-10 keV spectrum of the M 81 nucleus using the XMM-Newton European Photon Imaging Camera (EPIC) data from our long (130 ks) observation which was carried out as part of the RGS consortium guaranteed time programme.
2 Observations and data analysis
M 81 was observed with XMM-Newton on 2001 April 22. The EPIC PN camera (Strüder et al. 2001) was operated in small window mode for a single exposure of 130 ks duration. Each of the two EPIC MOS cameras (Turner et al. 2001) were exposed for 122 ks, split into two exposures. MOS1 was operated in timing mode, while MOS2 was operated in full-frame imaging mode. All three EPIC cameras were used in conjunction with medium filters. The nuclear X–ray source suffers from significant photon pile-up in the MOS2 data, and so these data are not included in our analysis. Pile-up is negligible for the nuclear source in the MOS1 and PN exposures.
The MOS1 data were processed with SAS v4.1. For technical reasons, it was not possible to reprocess the PN data using SAS v4.1, so they were processed using SAS v5.3.3. In order to construct lightcurves and spectra, source counts were extracted from a 44″ radius circular region in the PN camera, and from a 39″ wide strip in the MOS1 camera. Both regions were centred on the nucleus and correspond to an encircled energy fraction of of the nuclear flux. In high resolution Chandra imaging of M 81, the total X-ray flux originating from diffuse emission and point sources between 10″ and 44″ from the nucleus is only of the nuclear flux (Swartz et al. 2003). Hence the EPIC spectra are completely dominated by emission arising from the nucleus and its immediate environment (within pc). In both cameras, background counts were taken from regions which were free from bright sources. In the PN camera these were on the same chip as the source region, and in the MOS1 camera they were in the inner parts of the outer chips.
Lightcurves were constructed from both PN and MOS 1 data in the energy bands 0.3-2.0 keV and 2-10 keV with 1000 s time bins. To maximise the signal to noise, the lightcurves from the separate instruments were added to produce a single lightcurve for each energy band.
When extracting spectra, we excluded periods of high background flux. This reduces the durations of the exposures to 119 ks for the PN camera and 93 ks for MOS1. Response matrices and effective area files specific to the source regions were constructed using the standard RMFGEN and ARFGEN SAS tasks. To optimise signal to noise the spectra from MOS1 and PN were combined using the method of Page, Davis and Salvi (2003) in 45 eV bins which sample the EPIC spectral resolution well. The resultant spectrum has counts per bin at 6.4 keV and counts in every bin from 2 to 10 keV. Spectral analysis was carried out with XSPEC 11.1.0 (Arnaud 1996).
3 Results
3.1 Time variability
The background-subtracted EPIC PN+MOS1 lightcurves for the 0.3-2.0 keV and 2-10 keV bands are shown in the top and middle panels of Fig. 1 respectively. The lightcurves show flickering, similar in character to the stochastic variability commonly seen in Seyfert galaxies (e.g. Green, McHardy & Lehto 1993), but of relatively low amplitude ( peak to trough). The ratio of the 2-10 keV countrate to the 0.3-2 keV countrate is shown in the bottom panel of Fig.1. A constant fit to these data points (shown as dashed line in Fig.1) results in , corresponding to a null hypothesis probability of 15%. This means that the low level variability is not accompanied by any significant gross spectral changes.

3.2 Spectral study
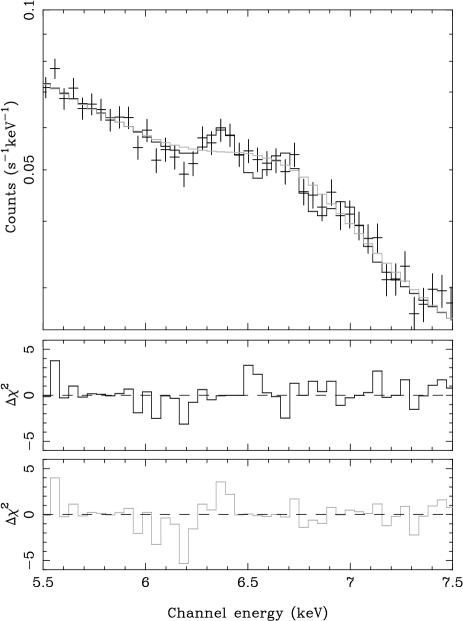
The 2-10 keV EPIC spectrum of M 81 is shown in Fig. 2. We began by fitting a power law model, absorbed by neutral material in our own Galaxy and within M 81, with the total column density fixed at the value of cm-2, as determined from the simultaneous RGS observation (Page et al. 2003). This model, and the data/model ratio are shown in Fig. 2. The parameters for this fit and all subsequent fits are given in Table 1. While the overall continuum shape is well reproduced by the power law, the is very poor (), and the data show a significant excess over the model between 6.25 and 7.15 keV. The energy range of the excess emission corresponds to the K lines of Fe I – Fe XXVI, although a photoelectric edge from Fe I at 7.1 keV could also contribute to the excess if there is significant reflection from cold material. Therefore we added a narrow 6.40 keV Gaussian emission line corresponding to Fe I K and a neutral Compton reflection component (Magdziarz & Zdziarski 1995; PEXRAV in XSPEC) to the absorbed power law model. Both these components could arise in a cold reflecting medium, e.g. an accretion disc or a distant molecular torus (George & Fabian 1991; Matt, Perola & Piro 1991); the inclination of the reflector was fixed at 60 deg to the observer’s line of sight in the fit. The fit is much improved ( of 69 for 2 extra free parameters), compared to the absorbed power law model. However, this model is still rejected with confidence, and the data showed a significant excess over the model at keV. Therefore we added a second narrow Gaussian emission line, at 6.68 keV, corresponding to Fe XXV. The fit is improved significantly with the addition of the second emission line ( for 1 extra free parameter). Although the model is now not rejected at the the 99% confidence level, it is still rejected at the 95% level, and the data still show an excess over the model between 6.8 and 7.15 keV. Therefore we included a third narrow Gaussian emission line at 6.96 keV, corresponding to Fe XXVI, in the model. This results in another significant improvement in the fit ( for 1 extra free parameter) and the fit is now acceptable at the 95% confidence level. However, as shown in Table 1, when the three Fe K emission lines are included in the fit, the amplitude of the reflection component is consistent with zero. We therefore removed the reflection component from the model and repeated the fit. The is the same for this model fit as it is when the reflection component is included, but with one fewer free parameter. Hence our best fit model is a power law with three Gaussian emission lines corresponding to Fe I, Fe XXV and Fe XXVI; this model is shown along with the data in Fig. 3. The 2-10 keV flux inferred from the fit is 1.1 erg s-1 cm-2. To further check the consistency of the line associations with Fe I, Fe XXV and Fe XXVI we repeated the fit allowing the energies of the emission lines to vary. This results in a negligible improvement in goodness of fit ( for 3 extra parameters) and the emission line parameters are all consistent with those obtained when the line energies were fixed (see Fig. 4).
An alternative interpretation for the 6.25-7.15 keV emission is that it is produced by a single broad emission line rather than by a combination of narrow lines. When a single broad Gaussian is tried, we obtain formally a good fit, with . However, this model does not reproduce the sharp 6.25 keV shoulder of the emission feature, and is therefore less satisfactory than the multi-line fit (see Fig. 3). The best fit central energy of the line is keV consistent with Fe XXV K, and the full width half maximum (FWHM) of the line is km s-1.
Pellegrini et al. (2000) claimed to have detected a photoelectric edge at 8.6 keV with optical depth in the spectrum of M 81, which they hypothesized could be due to Fe XXV. We have searched for Fe K photoelectric edges in our spectrum by adding an edge to our best fit model. The threshold energy of the edge was allowed to vary between 7 and 9.3 keV, corresponding to K edges from Fe I – Fe XXVI. However, we find that the is unchanged by this extra model component, and the best fit optical depth for the edge is zero, regardless of its energy. To determine upper limits we stepped the edge energy and optical depth over a grid of values, to produce the confidence contour shown in Fig. 5.


| 6.40 keV | 6.68 keV | 6.96 keV | ||||||
| Model | E.W. | E.W. | E.W. | Prob | ||||
| (eV) | (eV) | (eV) | ||||||
| P.L. | - | - | - | - | 323/175 | |||
| P.L.+Gau+refl | - | - | 245/173 | |||||
| P.L.+2Gau+refl | - | 218/172 | ||||||
| P.L.+3Gau+refl | 202/171 | |||||||
| P.L.+3Gau | - | 202/172 | ||||||
| P.L.+broad Gau† | - | - | - | 204/172 | ||||
| In this model the central energy and width of the emission line are free parameters. The best fit values are keV | ||||||||
| and keV respectively. | ||||||||
4 Discussion
In common with previous investigations, we find that the 2-10 keV spectrum is dominated by a power law continuum. The spectral slope we obtain () is consistent with that seen below 2 keV in the simultaneous RGS observation (; Page et al. 2003). Low level variability, of around 20% peak to trough is observed during the observation, but there are no detectable spectral changes. Similar fractional variations in intensity, over 1–2 day timescales, have also been observed in ASCA (Ishisaki et al. 1996) and BeppoSAX (Pellegrini et al. 2000) observations. The mean EPIC countrate during the XMM-Newton observation corresponds to a 2-10 keV flux of 1.1 erg s-1 cm-2, around 30% of the flux at the time of the BeppoSAX observation. Thus the X–ray variability of M 81 observed on a 1–2 day timescale is consistent with the linear relationship between flux and variability amplitude that is observed in Seyfert galaxies, whereby the variability amplitude is proportional to the mean flux, and so the fractional variations change little from observation to observation even though the mean flux may change considerably (Uttley & McHardy 2001). On the other hand, the variability amplitude of M 81 (and LINERs in general) is much lower than would be expected from extrapolating Seyfert variability amplitudes to lower luminosity (Ptak et al. 1998). The spectral index obtained from the XMM-Newton observation is consistent with those obtained from observations with ASCA (, Ishisaki et al. 1996) and with BeppoSAX (, Pellegrini et al. 2000). Thus the continuum shape appears to be unaffected by intensity variations either over timescales of days or over timescales of years.
4.1 Emission and absorption from ionized Fe
The high quality of our EPIC spectrum allows us to resolve the Fe K line emission, which can be modelled either by a single broad Fe XXV emission line or as the sum of three narrow components: Fe XXVI, Fe XXV, and a component representing emission from lower ionisation Fe species. Fe K emission is commonly seen in Seyfert galaxies, and is thought to be due to reprocessing of the primary X–rays by surrounding material. If the material lies along the line of sight, we will see both absorption and emission features in the X–ray spectrum. This is the hypothesis favoured by Pellegrini et al. (2000), because their BeppoSAX spectrum appeared to show both an emission line and an absorption edge from Fe XXV. However, we can rule out a Fe XXV K edge with significant optical-depth () at the confidence level in our EPIC spectrum. One possible explanation for this discrepancy might be that the X–ray flux at the time of the EPIC observation was only about 30% of the flux at the time of the BeppoSAX observation: assuming the absorber is photoionized, the corresponding reduction in the ionization level of the absorber might explain the lack of an Fe XXV edge in the EPIC spectrum. If this were the case, we would expect the dominant ionic species of Fe in the absorber to change from Fe XXV during the BeppoSAX observation to Fe XX – Fe XXIV in the XMM-Newton observation (Kallman & McCray 1982). Instead of the Fe XXV K edge at 8.8 keV, there should be 1-4 Fe K edges between 8.0 and 8.6 keV. The relative ionic abundances of Fe at this ionization level (Kallman & McCray 1982), and the corresponding K-shell photoionization cross sections (Verner & Yakovlev 1995), imply that at least one of these should have at threshold, but this is ruled out with 95% confidence by our upper limits given in Fig. 5.
An absorber in which the dominant species of Fe are Fe XX – Fe XXIV should also produce a host of Fe L absorption lines in the soft X–ray. The deepest of these lines lie at 12.82 Å, 12.29 Å, 11.71 Å, 11.00 Å, and 10.64 Å for Fe XX – Fe XXIV respectively (e.g. Verner, Verner & Ferland 1996). If the column density implied by the Fe XXV K edge found by Pellegrini et al. (2000) were shared evenly between these ions, and assuming a velocity dispersion of km s-1 in the absorber, we would expect these lines to have equivalent widths of at least 29 mÅ, 27 mÅ, 19 mÅ, 15 mÅ and 13 mÅ respectively. We have looked for these absorption lines in the simultaneous RGS spectrum of M 81 studied by Page et al. (2003) by repeating their spectral fit, adding these minimum absorption lines one at a time to their best fit model, and measuring the . For every ion except Fe XXII the absorption line makes the poorer, by values in the range 1.4 to 9. For Fe XXII, adding an absorption line of 19 mÅ equivalent width improves the by 0.9. Increasing the equivalent widths of any of these lines (including Fe XXII) from their expected minima results in an increased . Furthermore, in this range of ionization, 3–20% of O should be in the form of O VIII. Assuming the absorber has solar abundances (Anders & Grevesse 1989), and a velocity distribution with km s-1, the absorber should give rise to O VIII Ly and Ly absorption lines with equivalent widths of mÅ and mÅ respectively. Such absorption lines are not seen in the simultaneous RGS spectrum (Page et al. 2003). Instead, O VIII Ly is seen in emission, and while this might mask the absorption line, the corresponding Ly emission is much weaker. To see whether such a Ly absorption line might be present in the RGS spectrum, we have again repeated the spectral fit of Page et al. (2003) to the RGS spectrum, adding an absorption line at the position of O VIII Ly to their best fit model. The best fit equivalent width is zero, and an absorption line of mÅ equivalent width results in a of 4, and so is excluded at 95% confidence. In fact we do not see any evidence for ionized absorption in the RGS spectrum. Therefore we conclude that the lack of an Fe XXV K absorption edge in our EPIC spectrum is not explained by the reduction of the ionization. Either the ionized absorber has moved out of the line of sight, or the edge feature in the BeppoSAX spectrum was a statistical fluctuation rather than a real feature. Therefore, if the Fe K line(s) are reprocessed emission from the X–ray radiation, they come from outside the line of sight.
If a broad Fe XXV line is responsible for all the emission, the large velocity width (FWHM = km s-1) implies that the emission originates within a few hundred Schwarzschild radii of the compact object. Furthermore, because the emission feature has a relatively high equivalent width ( eV), it must have a significant Thomson optical depth (i.e. ) and cover a significant fraction of the sky as seen by the X-ray source (see Bianchi & Matt 2002). The inner part of an accretion disc is the only viable location for gas with this combination of properties, and reflection from an accretion disc surface is widely hypothesized for broad Fe K emission in AGN. However, the inner part of an accretion disc is unlikely to be responsible for broad 6.7 keV line emission in M 81, on both theoretical and empirical grounds. Firstly, because of its low bolometric luminosity (), M 81 probably contains an advective flow in the central regions rather than an accretion disc (Narayan & Yi 1995). This hypothesis is further supported by the lack of any soft, blackbody-like component in the soft X–ray spectrum of M 81 (Page et al. 2003); such a component is commonly observed in Seyfert galaxies and is thought to be the high energy tail of the emission from the inner accretion disc (Arnaud et al. 1985). The second reason that a broad Fe XXV line is unlikely to originate in an accretion disc in M 81 is that the X–ray spectrum lacks any of the other features expected from such a disc. In particular, the soft X-ray spectrum does not contain the strong, broad emission features predicted to occur in discs which are sufficiently ionized to produce significant Fe XXV emission (e.g. O VIII and O VII emission lines and radiative recombination continua; see Nayakshin & Kallman 2001 and Ballantyne, Ross & Fabian 2001). Instead, the only emission features observed in the soft X-ray spectrum are the narrow emission lines from a spatially extended thermal component (Page et al. 2003). Thus a single broad Fe XXV emission line, as well as failing to reproduce the sharp 6.25 keV shoulder of the emission feature, is physically inconsistent with the other X-ray and multiwavelength properties of M 81. However, for a novel explanation for a broad 6.7 keV emission line, arising at the interface between the thin, outer disc and the inner, radiatively-inefficient, hot flow, see Dewangan et al. (2004).
Because the broad line model for the Fe K emission appears unlikely on physical grounds, we consider the combination of narrow 6.4, 6.7 and 6.9 keV emission lines. The three components each contribute about a third of the line emission, and the combined equivalent width is eV. For the 6.4 keV emission line, which arises in cool material, the observed equivalent width of eV is rather low compared to the line width observed in most Seyfert galaxies (typically eV, e.g. Nandra et al. 1997). If the line arises in a Compton thick, plane parallel reflector, then the small equivalent width implies either that the reflector is highly inclined to our line of sight (i.e. ) or that the reflector covers less than 50% of the sky as seen by the X-ray source (George & Fabian 1991). If the reflector has a funnel shape (e.g. the molecular torus of AGN unification schemes) then the low equivalent width implies an even lower sky-coverage of the reflector (Matt et al. 1991). Alternatively the low equivalent width of the 6.4 keV line could be explained if the reprocessing region is Compton-thin (Leahy & Creighton 1993). In any case, the low equivalent width of the 6.4 keV line implies that in M 81 there is not as much cold, X-ray illuminated material as there is in a typical Seyfert galaxy. In contrast, the 6.7 and 6.96 keV lines have a larger equivalent width in M 81 than is normally observed in Seyfert 1 galaxies, which typically have 6.4 keV lines that are at least four times stronger than either the 6.7 or 6.96 keV line; indeed the 6.7 or 6.96 keV lines are often not detectable in EPIC X-ray spectra of Seyfert 1s (e.g. Pounds et al. 2003, Blustin et al. 2003). The calculations by Bianchi & Matt (2002) allow us to place some interesting constraints on photoionized material that might give rise to these lines. According to these calculations the column density of illuminated, reflecting material must be cm-2 in order to produce the observed equivalent widths. To maintain a sufficiently high level of ionization in the illuminated material to produce the 6.7 and 6.96 keV lines requires that the material lies quite close to the illuminating source. From equation 6 of Bianchi & Matt (2002), and for the observed 2-10 keV luminosity of M 81 ( erg s-1), we find that the illuminated material responsible for the 6.7 keV line must lie within 0.1 pc of the nucleus, while the material responsible for the 6.96 keV line must lie within 0.01 pc.
Although the 6.4-7 keV complex could not be separated into its components in the ASCA and BeppoSAX observations, the total equivalent width measured with these data was consistent with our EPIC value, at eV (Ishisaki et al. 1996) and eV (Pellegrini et al. 2000) respectively. Unfortunately, the uncertainties on these measurements are large enough that they are also consistent with constant flux from the lines (i.e. a reduction in the equivalent width by a factor of three between the BeppoSAX and XMM-Newton observations).
4.2 Comparison to the Galactic Centre
It is interesting to note that the Fe K line ratios are relatively similar to those observed in the 1 deg 1 deg (150 pc 150 pc) region around our own Galactic Centre (Tanaka et al. 2000). In particular, emission lines at 6.4 keV, 6.7 keV and 6.9 keV are seen in both the Galactic Centre and in M 81, and in both cases the 6.7 keV line is the strongest (Table 1 and Tanaka 2002). In the case of the Galactic Centre, the origin of the Fe K lines is controversial (e.g. Ebisawa et al. 2003; Predehl et al. 2003). The 6.4 keV emission is thought to arise through fluorescence in cold Fe, which is either illuminated by X–rays emitted during a past, comparatively more active period of Sgr A∗ (e.g. Murakami, Koyama & Maeda 2001), or bombarded by low energy cosmic ray electrons (Valinia et al. 2000).
Possible models for the 6.7 keV and 6.96 keV lines include a high temperature (10 keV) thermal plasma (Koyama et al. 1989), charge exchange between cosmic-ray Fe ions and interstellar H (Tanaka, Miyaji & Hasinger 1999), interaction of non-thermal electrons with a low temperature ( keV) thermal plasma (Masai et al. 2002; Dogiel et al. 2002; Valinia et al. 2000), or a large population of faint accreting binaries (Wang et al. 2002). However, there now appear to be significant problems with the first two of these models for the 6.7 and 6.96 keV lines: a 10 keV thermal plasma is too hot to be gravitationally bound to the Galaxy, and so strong magnetic fields (G) would be required to confine the plasma (Tanuma et al. 1999), while charge exchange between cosmic ray Fe ions and interstellar H is expected to produce 8.5 and 8.9 keV lines rather than the 6.7 and 6.96 lines which are observed (Masai et al. 2002).
Although the integrated contribution of accreting binary stars may plausibly explain the 6.7 and 6.96 keV lines from the Galactic Centre region (Wang et al 2002), this would seem unlikely for M 81. The population of discrete X–ray sources near the Galactic Centre has a radial surface density which declines as where is distance from the centre (Muno et al. 2003). This is similar to the spatial distribution of stars selected in the infrared (Serabyn & Morris 1996), suggesting that the X-ray source population is intimately linked to the underlying population of bulge stars. Furthermore, the luminosity function of the discrete sources is steep, with , at the faintest fluxes probed by Muno et al. (2003) so that the emission from discrete sources is dominated by low luminosity objects (2–8 keV luminosity erg s-1), likely to be low mass accreting binaries such as cataclysmic variables. Such objects show strong Fe XXV and Fe XXVI K lines (see e.g. Mukai et al. 2003; Wu, Cropper & Ramsay 2001) and will predominantly be drawn from the old stellar bulge population because they are long lived (Warner 1995). The bulges of the Milky Way and M 81 have similar overall luminosities: L⊙ for M 81 (determined from V-band photometry: Tenjes, Haud & Einasto 1998), and L⊙ for the Milky Way (determined from near-IR photometry: Kent, Dame & Fazio 1991; Freudenreich 1998). We would therefore expect similar integrated Fe K line luminosities from the low luminosity binary populations in the central regions of M 81 and the Milky Way. The luminosity of the Fe K lines emitted near the Galactic Centre is erg s-1 (Yamauchi et al. 1990), and assuming a distance of 3.6 Mpc to M 81, the Fe K line emission from M 81 is erg s-1, about 150 times more luminous than that from the Galactic Centre. Therefore, whatever fraction of the Fe K line emission in the Galactic Centre comes from accreting binaries, such sources are unlikely to make a substantial contribution to the Fe K lines in the central part of M 81.
On the other hand, if the Galactic Centre Fe lines originate from a non-thermal distribution of cosmic-ray electrons, interacting with both cold and hot (0.2-0.6 keV) gas, the Fe lines in M 81 could quite plausibly arise through the same mechanism. In the radio band it has already been noted that the Galactic Centre and M 81 appear to be remarkably similar sources, with M 81 resembling a scaled-up version of the Galactic Centre, from the core-jet structures (M 81* and Sgr A*) seen on sub-pc scales (Bietenholz, Bartel & Rupen 2000; Lo et al. 1998) to the large arc-like structures seen on tens to hundreds of pc scales (Kaufman et al. 1996; Yusef-Zadeh, Morris & Chance 1984). The radio luminosity of M 81* is about times higher than that of Sgr A*, which suggests that the non-thermal electron population in the central regions of M 81 could be supplied with sufficient energy to power the Fe K emission. Furthermore, myriad soft X-ray emission lines from 0.2-0.6 keV thermal plasma have already been detected from the central kpc of M 81 where the most important radio structures are found.
The spatial extent of the 6.4, 6.7 and 6.9 keV line emission in M 81 will be a key diagnostic to determine whether they are analogous to those observed from the Galactic Centre or are due to photoionization by the nuclear X–ray source. The lines in the Galactic Centre come from a region more than 100 pc across; if the M 81 lines are a scaled-up version of the same phenomenon, then they can be expected to arise from region of similar size or larger (i.e. extending out to at least 6 arcseconds from the nucleus of M 81). On the other hand, if the lines are photoionized by the nucleus they must originate within 0.1 pc of the nucleus (6 milli-arcseconds at the distance of M 81). Unfortunately, at the spectral resolution of the EPIC CCDs the peak intensity of the lines is at most of the underlying AGN continuum, and XMM-Newton’s spatial resolution is not sufficiently good that we can distinguish such a weak component of extended emission. Chandra has much better spatial resolution, but it has a much lower sensitivity than EPIC around Fe K, and the existing observations suffer badly from photon pile-up close to the nuclear source. Currently, Fe K emission has been detected neither from the nuclear source, nor from the circumnuclear 10-30 arcsecond region (Swartz et al. 2003). In principle, a very long observation using the high-energy transmission gratings on Chandra might allow the measurement of the spatial extent of the Fe K line emitting region in M 81 because it could achieve the required spatial and spectral resolution without significant photon pile-up.
5 Conclusions
The 2-10 keV X-ray spectrum of the nucleus of M 81 consists of a power law continuum and three Fe K emission lines at 6.4, 6.7 and 6.96 keV. The power law component has a photon index , consistent with the continuum observed below 2 keV with the RGS. The X-ray flux varied by 20% during the 130 ks observation but no gross spectral variations were detected. The spectrum does not require a reflection component, and shows no evidence for absorption edges due to highly ionized Fe. The equivalent widths of the 6.4, 6.7 and 6.96 keV emission lines are , and eV respectively. These equivalent widths are significantly different to those normally observed in Seyfert galaxies, which typically have stronger 6.4 keV lines and weaker 6.7 and 6.96 keV lines. However, the ratios of the three lines in M 81 are relatively similar to the those observed from the Galactic Centre region. The nucleus of M 81 does not appear to contain as much cold, X–ray illuminated material as most Seyfert galaxies. The 6.7 and 6.96 keV emission lines might originate in photoionized gas within 0.1 pc of the nuclear continuum source. Alternatively, these emission lines might have a similar origin to the Galactic Centre Fe line emission, possibly through the interaction of non-thermal cosmic ray electrons with the 0.2-0.6 keV thermal plasma component of the M 81 bulge.
Acknowledgements.
We thank Michael Muno, Martin Weiskopf, Douglas Swartz and Alice Breeveld for helpful discussions and suggestions.References
- (1) Anders E. & Grevesse N., 1989, Geochimica et Cosmochimica Acta, 53, 197
- (2) Arnaud K.A., et al., 1985, MNRAS, 217, 105
- (3) Arnaud K.A., in Astronomical Data Analysis Software and Systems V, eds. Jacoby G. and Barnes J., p17, ASP Conf. Series volume 101
- (4) Ballantyne D.R., Ross R.R., Fabian A.C., 2001, MNRAS, 327, 10
- (5) Bianchi S. & Matt G., 2002, A&A, 387, 76
- (6) Bietenholz M.F., Bartel N., Rupen M.P., 2000, ApJ, 532, 895
- (7) Blustin A.J., et al., 2003, A&A, 403, 481
- (8) Dewangan G.C., Griffiths R.E., Di Matteo T., Schurch N.J., ApJ, in press (astro-ph/0402327)
- (9) Dogiel V.A., Inoue H., Masai K., Schönfelder V., Strong A., 2002, ApJ, 581, 1061
- (10) Ebisawa K., Yamauchi S., Bamba A., Ueno M., Senda A., AN, 324, 52
- (11) Fabbiano, G., 1988, ApJ, 325, 544
- (12) Fabian, A.C., Rees, M.J., Stella, L., White, N.E. 1989, MNRAS, 238, 729
- (13) Freedman, W.L., et al., 1994, ApJ, 427, 628
- (14) Freudenreich H.T., 1998, ApJ, 492,495
- (15) George I.M., Fabian A.C., 1991, MNRAS, 249, 352
- (16) Green A.R., McHardy I.M. & Lehto H.J., 1993, MNRAS, 265, 664
- (17) Heckman T.M., 1980, A&A, 87, 152
- (18) Ho L.C., Filippenko A.V., Sargent W.L.W., 1996, ApJ, 462, 183
- (19) Ho L.C., Filippenko A.V., Sargent W.L.W., 1997, ApJ, 487, 568
- (20) Ho, L.C., 1999, ApJ, 516, 672
- (21) Ishisaki, Y., et al., 1996, PASJ, 48, 237
- (22) Iyomoto, N., Makishima, K., 2001, MNRAS, 321, 767
- (23) Kallman T.R., McCray R., 1982, ApJS, 50, 263
- (24) Kaufman M., Bash F.N., Crane P.C., Jacoby G.H., 1996, AJ, 112, 1021
- (25) Kent S.M., Dame T.M., Fazio G., ApJ, 378,131
- (26) Koyama K., Awaki H., Kunieda H., Takano S., Tawara Y., 1989, Nature, 339, 603
- (27) Leahy D.A. & Creighton J., 1993, MNRAS, 263, 314
- (28) Lo K.Y., Shen Z.-Q., Zhao J.-H., Ho P.T.P., 1998, ApJ, 508, L61
- (29) Magdziarz P., Zdziarski A.A., 1995, MNRAS, 273, 837
- (30) Masai K., Dogiel V.A., Inoue H., Schönfelder V., Strong A., 2002, ApJ, 581, 1071
- (31) Matt G., Perola G.C., Piro L., 1991, A&A, 247, 25
- (32) Mukai K., Kinkhabwala A., Peterson J.R., Kahn S.M., Paerels F., 2003, ApJ, 586, L77
- (33) Muno M.P., et al., 2003, 589, 225
- (34) Murakami H., Koyama K., Maeda Y., 2001, ApJ, 558, 687
- (35) Nandra K., George I.M., Mushotzky R.F., Turner T.J., Yaqoob T., 1997, ApJ, 477, 602
- (36) Narayan R., & Yi I., 1995, ApJ, 452, 710
- (37) Nayakshin S., & Kallman T.R., 2001, ApJ, 546, 406
- (38) Page M.J., et al., 2003, A&A, 400, 145
- (39) Page M.J., Davis S.W., & Salvi N.J., 2003, MNRAS, in press
- (40) Pellegrini, S., Cappi, M., Bassani, L., Malaguti, G., Palumbo, G. G. C., Persic, M., 2000, A&A, 353, 447
- (41) Petre, R., Mushotzky, R. F., Serlemitsos, P. J., Jahoda, K., Marshall, F. E., 1993, ApJ, 418, 644
- (42) Pounds K.A., Reeves J.N., Page K.L., Edelson R., Matt G., Perola G.C., 2003, MNRAS, 341, 953
- (43) Predehl P., Costantini E., Hasinger G., Tanaka Y., 2003, AN, 324, 73
- (44) Ptak A., Yaqoob T., Mushotzky R., Serlemitsos P., Griffiths R., 1998, ApJ, 501, L37
- (45) Serabyn E. & Morris M., 1996, Nature, 382, 602
- (46) Strüder L., et al., 2001, A&A, 365, L18
- (47) Swartz D.A., Ghosh K.K., McCollough M.L., Pannuti T.G., Tennant A.F., Wu K., 2003, ApJS, 144, 213
- (48) Tanaka Y., Miyaji T., Hasinger G., 1999, AN, 320, 181
- (49) Tanaka Y., Koyama K., Maeda Y., Sonobe T., 2000, PASJ, 52, L25
- (50) Tanaka Y., 2002, A&A, 382, 1052
- (51) Tanuma S., Yokoyama T., Kudoh T., Matsumoto R., Shibata K., Makishima K., 1999, PASJ, 51, 161
- (52) Tenjes P., Haud U. & Einasto J., 1998, A&A, 335, 449
- (53) Terashima, Y., Iyomoto, N., Ho, L. C., Ptak, A. F., 2002, ApJS, 139, 1
- (54) Turner M.J.L., et al., 2001, A&A, 365, L27
- (55) Uttley, P. & McHardy I.M., 2001, MNRAS, 323, L26
- (56) Valinia A., Tatischeff V., Arnaud K., Ebisawa K., Ramaty R., 2000, ApJ, 543, 733
- (57) Verner D.A. & Yakovlev D.G., 1995, A&AS, 109, 125
- (58) Verner D.A., Verner E.M., & Ferland G.J., 1996, Atomic Data Nucl. Data Tables, 64, 1
- (59) Wang Q.D., Gotthelf E.V., Lang C.C., 2002, Nature, 415, 148
- (60) Warner B., 1995, “Cataclysmic Variable Stars”, Cambridge University Press
- (61) Wu K., Cropper M., Ramsay G., 2001, MNRAS, 327, 208
- (62) Yamauchi S., Kawada M., Koyama K., Kunieda H., Tawara Y., Hatsukade I., 1990, ApJ, 365, 532
- (63) Yusef-Zadeh F., Morris M., & Chance D., 1984, Nature, 310, 557