The nature of a gravitationally lensed sub-millimetre arc in MS0451.60305: two interacting galaxies at ?
Abstract
We present a new SCUBA image of the cluster MS 0451.60305, which exhibits strong, extended sub-mm flux at 850m. The most striking feature in the map is an elongated region of bright sub-mm emission, with a flux density of mJy over several beam-sizes. This region is apparently coincident with a previously known optical arc (which turns out to be a strongly lensed Lyman Break Galaxy at ), as well as with a newly identified multiply imaged ERO (Extremely Red Object) pair predicted to be at a similar, if not identical redshift. By combing a detailed lensing model with deep images from HST, Chandra, CFHT, JCMT, and spectra from the VLT, we conclude that both the strongly lensed optical arc and ERO systems have properties consistent with known sub-mm emitters. Using a simple model for the two sources, we estimate that the multiply lensed EROs contribute the majority of the flux in the SCUBA lensed arc. Correcting for the lensing amplification, we estimate that the inherent 850m fluxes for both objects are 0.4 mJy. If the LBG and ERO pair are truly at the same redshift, then they are separated by only kpc in the source plane, and hence constitute an interacting system at . Higher angular resolution observations in sub-mm/mm will permit us to more accurately separate the contribution from each candidate, and better understand the nature of this system.
keywords:
gravitational lensing – galaxies: clusters : individual : MS 0451.60305 – submillimetre – methods: numerical – techniques: image processing1 Introduction
Since the installation of the Submillimetre Common User Bolometer Array (SCUBA; Holland et al. 1999) at the JCMT telescope, hundreds of luminous dusty galaxies have been detected (see Blain et al. 2002 for a review). Such observations are still far from routine, however, with the detection rate in random fields being typically one or two sources of modest signal-to-noise ratio (SNR) per shift of telescope time. Bright sources, which are easier to obtain detailed sub-mm/mm follow-up observations for using heterodyne receivers or bolometers tuned to other wavelengths, are correspondingly rarer. This, coupled with the fact that the dust responsible for the sub-mm luminosity absorbs radiation at other wavelengths, means that SCUBA detected galaxies are often extremely faint in the optical. Hence, redshifts, morphologies and spectral energy distributions (SEDs) have proven elusive for most sources.
One technique which can help, pioneered by Smail, Ivison & Blain (1997), is to use the lensing amplification of rich galaxy clusters to boost the detectability of background sub-mm galaxies. The rate at which sources are detected is increased by a factor , with an improved prospect of discovering the occasional bright object at relatively high SNR. Here we present detailed observations of just such a source in the field of the massive cluster MS 0451.60305, which we discovered in an earlier survey of 9 rich cluster fields (Chapman et al. 2002a, hereafter C02). This paper uses new SCUBA data, as well as rigorous chop deconvolution, in order to produce a map free from the chopping artifacts common in sub-mm observations.
The sub-mm emission in this image is extended along a giant optical arc discovered in this cluster by Luppino et al. (1999, hereafter L99), and thus there is little doubt that the SCUBA emission is lensed as well. In this paper, we combine deep optical, near-IR (NIR), and X-ray data with a detailed lensing model in order to interpret the sub-mm emission in this remarkable SCUBA field.
2 Observations
MS 0451.60305 is the most luminous X-ray cluster in the Einstein Observatory Extended Medium Sensitivity Survey (EMSS; Gioia et al. 1990). It is a cluster, which has been studied extensively in the optical (Gioia & Luppino 1994, hereafter L99) and X-Ray (Molnar et al. 2002, Donahue et al. 2003; hereafter D03). It makes an ideal SCUBA target because it is relatively compact compared to the SCUBA array size, and the strong radio Sunyaev-Zel’dovich (SZ) decrement (Reese et al. 2000) suggests that the SZ increment at 850m might be detectable. The SZ and X-ray signals clearly indicate that this is a massive cluster, and the presence of a giant optically detected arc unambiguously verifies that it is lensing background galaxies. Thus SCUBA observations have the potential to detect a combination of diffuse SZ emission, background lensed sources, and galaxies in the cluster itself.
2.1 Sub-mm observations
SCUBA ‘jiggle-mode’ maps of the region were taken simultaneously at 850m and 450m in two separate JCMT runs; The first was on 03 September 1998 and the second was 10-11 November 1999. Each has approximately the same observing time of ksec, but the weather in 1999 was significantly better, with an average atmospheric opacity of , compared to 0.40 in 1998. In addition, upgrades after the 1998 run improved SCUBA’s overall sensitivity by roughly 10% at 850m and 50% at 450m.
To remove the strong atmospheric emission component of the data, the JCMT secondary mirror ‘chops’ between the target and two nearby reference positions on the sky. Since the sky emission is common to all positions, but the astronomical target is not, the difference between the data at these positions removes the majority of the common mode noise. Three different chop directions, all using 30 arcsecond throws, were used in 1998. Analysis of these data, revealed that the region was excessively rich in bright sub-mm sources, raising concern that the chopping may have removed some of the measured signal. The sub-mm map of MS 0451.60305 presented in C02 use these data exclusively.
In an effort to detect the Sunyaev-Zel’dovich (SZ) increment in the cluster, the 1999 observations were taken with very wide chop throws (180 arcsecond), so that signal within the 2 arcminute SCUBA field of view would not be chopped out. Note that chopping onto sources outside the field is unlikely to be a concern, since the chop was held at constant azimuth and therefore sky rotation would quickly move sources out of the chopped position. Zemcov et al. 2003 use the 1999 data only, since the data in C02 used as a chop throw too small to be useful for SZ studies. By comparing the maps made from each set, it is clear that 1998 data has, in fact, chopped out some signal inside the field.
The map presented here combines these two datasets, and given the differences between the 1998 and 1999 maps, it seems appropriate to be fairly comprehensive in describing the map-making procedure which we adopted. This ‘direct-inversion’ method is described in the appendix. It could be adapted for all SCUBA jiggle-maps which have in-field chopping. However, it is much more computationally intensive than standard approaches, and will only lead to mild improvements for general ‘blank’ fields. On the other hand, for fields with multiple or extended sources, a method of this sort is essential in order to recover the correct fluxes across the map.
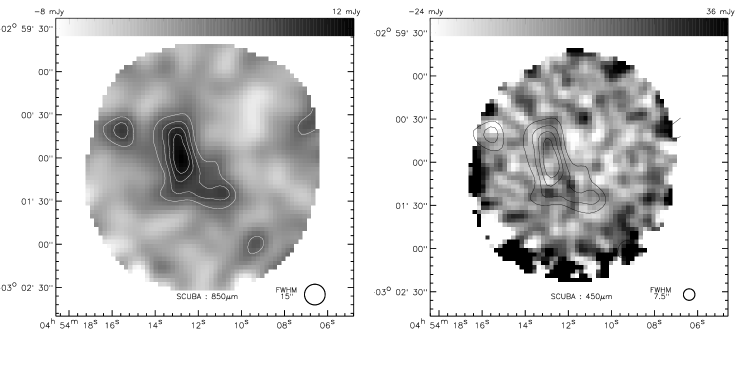
Because the 1999 data are roughly three times more sensitive, the gains in co-adding the 1998 data are modest. Nevertheless the maps from the 2 separate runs are consistent with each other after the deconvolution is performed. We present our best 850m and 450m maps in Fig. 1. The 850m image shows a continuous ridge of sub-mm emission, which was partly removed in the chopped data presented in C02. More importantly, the act of chopping in-field shifted the centroid south-westward by removing flux on the edge of the arc region. The 450m image, on the other hand, contains no significantly detected sources. The lack of a detection of the primary arc with the 450m array ( upper limit of 48 mJy) places a lower limit of for the source redshift, for reasonable dusty galaxy SEDs. We also note that since the 1999 data were taken with a 16-point jiggle pattern (thus fully sampling at 850m, but not at 450m), the resulting 450m map has quite inhomogeneous noise.
2.2 HST Observations
MS 0451.60305 was imaged with the F702W filter on WFPC2 in 1995 as part of a program to study luminous X-ray clusters (project ID 5987, PI: Donahue). We down-loaded the processed, calibrated image directly from the archive at the Canadian Astronomy Data Centre. More recently, the Advanced Camera for Surveys (ACS; Ford et al. 1998) was used to obtain deep images with the F775W and F850LP filters (project ID 9292, PI: Ford). We obtained the raw data from the public archive and reduced them using the multidrizzle package (Koekemoer et al. 2002).
The WFPC2 F702W images are composed of 4 independent dithered exposures, with a total exposure time of ksec. In each of the two ACS bands, two exposures totaling ksec were obtained. However, because these observations were not dithered, the resulting ACS images are prone to detector artifacts and cosmic ray contamination. This makes estimating fluxes for some objects in the field problematic. Astrometry for the WFPC and ACS images was fixed using 13 objects from the GSC2.2 catalogue. The limiting magnitudes for the F702W, F775W, and F850LP images are 26.3, 24.9 and 25.1 AB magnitudes, respectively.
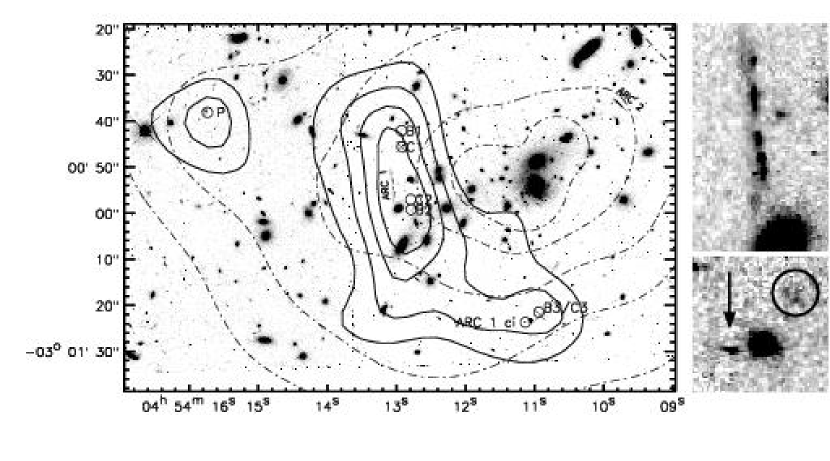
The HST F702W image is presented in Fig. 2, and shows in detail the lensed arcs reported originally in L99. ARC1 appears to contain knots surrounded by diffuse emission which were not previously resolved from ground-based imaging. These knots display a mirror symmetry, arguing that ARC1 corresponds to a fold-arc (two images merging together). We use this fact later in creating a lensing model for the cluster. North-east of the cluster centre is a second arc: ARC2, showing a very smooth light distribution. VLT spectra described later show that ARC1/2 are at very different redshifts, and thus are not two images of the same object. Furthermore, the colours of these two arcs are quite different ( AB for ARC1 versus 0.6 for ARC2), a finding first reported in L99 using lower resolution - and -band images.
Another notable object in the field is a very blue ( AB), morphologically disturbed source (which we label ‘P’) that seems to be coincident with the SCUBA point source eastward of the arc. We note also that the Chandra contours extend around this source, suggesting the presence of another massive component to the cluster.
2.3 Near IR Observations and EROs
The CFHT-IR camera on the 3.6-m Canada-France-Hawaii Telescope (CFHT) was used to image MS 0451.60305 in each of the -, -, and -band filters. The images were obtained in moderate conditions, with seeing roughly 1.0 arcsec. In each filter, observations were dithered in a hexagonal pattern, providing uniform coverage of a arcminute region. Several short (second) integrations were taken, for a total exposure time of ksec in , ksec in , and ksec in . Observations of the standard FS11 were taken to measure the zero points. The limiting magnitudes in the -, - and -band images were 24.4, 23.5, and 23.8 (AB, ) respectively.
Data were reduced using the dimsum package in IRAF, together with sextractor to detect objects and estimate fluxes within 2 arcsecond apertures. We compared the -selected catalogue against 84 objects detected in the shallower survey of Stanford et al. (1998). Although there is no evidence of bias between our catalogues, we did find an RMS scatter of 0.1 magnitudes between sources in each of the three NIR bands, and we use this as the lower limit to the error estimate for our -, -, and -band magnitudes. Our magnitudes also agree with a deeper Subaru NIR image described in Tanaka et al. (2003).
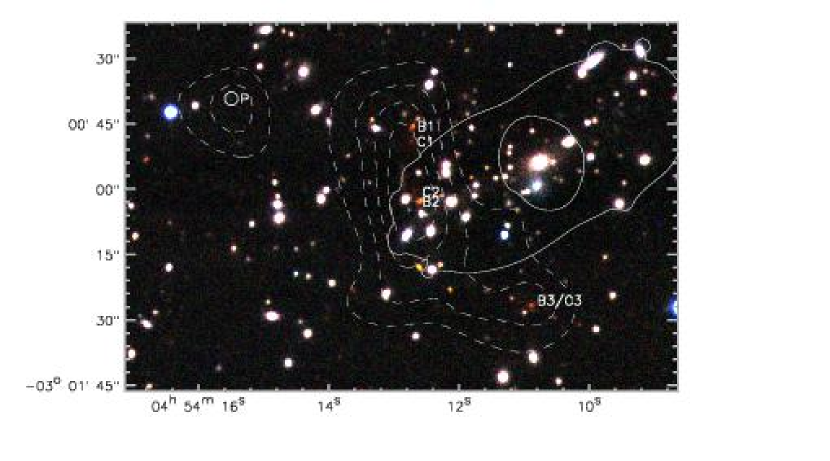
A colour-magnitude diagram (Fig. 3) using the and magnitudes, and a false colour image of the cluster created using the NIR images (Fig. 4) reveals objects with extremely red colours . In Section 3 we will describe the lensing model of the cluster, but it is important here to highlight sources B and C, which are a pair of EROs re-imaged in 3 places due to strong lensing. The first and second image, sources B1/C1 and B2/C2 are mirrored across the critical line in the lens model, and have similar magnification factors. Unfortunately B2/C2 are in a particularly crowded region of the image, making accurate photometry difficult. At the position of B3/C3, the lensing is much weaker, and thus the object separation decreases to the point where the two distinct objects overlap.
The connection between sub-mm galaxies and some EROs is well established; dust responsible for the sub-mm emission also reddens the optical-UV spectrum. NIR bright objects invisible in deep HST imaging were found coincident with sub-mm sources in observations towards other lensing clusters (Smail et al. 1999). Roughly one-third of the sub-mm galaxies detected in the UK 8-mJy survey have an ERO as the most likely counterpart (Ivison et al. 2002). In addition, Webb et al. (2004) claim that pairs of EROs denote regions of sub-mm emission, though not necessarily the source of it. And in general, stacking analyses of optical and NIR selected galaxies in sub-mm fields show a convincing trend for redder objects to be statistically more SCUBA-bright (Wehner et al. 2003, Borys et al 2004). These findings, along with the fact that the 3 ERO pairs here trace out the sub-mm contours quite convincingly, make this a strong candidate for the sub-mm arc counterpart.

2.4 Chandra observations
MS 0451.60305 was observed with the Chandra Advanced CCD Imaging Spectrometer (ACIS) detector for a total of ksec. Full processing details are contained in D03. The astrometry for a Chandra ACIS-S observation is typically accurate to about 1.0′′, but can have errors as large as 3.0′′. X-ray point source fluxes are described in Molnar et al. (2002). Two sources are detected within the field of the SCUBA observations, and are coincident with C1 and C3. The X-ray source coincident with C1 was detected with counts, while that of C3 has . The ratio of counts is the same as the ratio of magnification factors derived from the lensing model described in the next section.
Since a point source was not reported in D03 at the position of C2, we estimated the X-ray flux using a 2′′ aperture. The lensing model predicts that that C1 and C2 have approximately the same amplification factor, thus we expect counts. However, we only find counts between 0.5–keV at the position of C2. We note that photons from C2 pass through more of the cluster gas, since it is closer to the brighter X-ray centre than C1 (see Fig. 2). If we assume that the NIR fluxes are accurate, then the fainter C2 (by 0.5 magnitudes in ) suggests the number of counts from C2 should be around 25. Our estimate of 13 counts is still low compared to this expectation, but given the difficulty in extracting an X-ray flux estimate of point sources on top of a brighter, diffuse background (the cluster gas), it does not seem unreasonable. More accurate NIR imagery, coupled with more detailed modeling of extinction through the cluster, could resolve this issue. Based on the strength of the lensing model and colours/geometry of the EROs, we still conclude that the three B/C pairs are the same objects, with C also being an X-ray source (despite the apparent non-detection of X-rays in C2).
The X-ray profile discussed in D03 allows us to predict the SZ increment at 850m, which, in the absence of chopping, peaks at roughly mJy. By applying the astrometry from the sub-mm data, we constructed a simulated map of what the SZ signal would look like when the chopping is accounted for. The peak drops to mJy and the SZ emission falls off to roughly mJy at the position of the main arc. If we subtract this shape from the data it makes little difference to the flux levels or SNRs in the SCUBA map. On the other hand, the contamination of so much lensed sub-mm emission makes this particular field useless for sub-mm SZ studies, at least until much higher resolution images can be obtained (Zemcov et al. 2003). Indeed, measuring the SZ increment in any strong lensing cluster will prove difficult simply because the resolution is too poor to remove the enhanced number of point sources detected in the field.
2.5 VLT spectrum of ARC1
Deep multi-object spectroscopy of MS 0451.60305 was obtained in service mode for the FORS2-GTO programme: 68.A-0015 (PI: Appenzeller) on December 10th, 11th, 12th and 21st 2001, with the FORS-2 instrument (Appenzeller & Rupprecht 1992) on the VLT-Yepun (UT4). We retrieved these data from the ESO/VLT archive and reduced them using standard IRAF procedures. Two masks were prepared (‘M128’ and ‘M129’) and exposed with the high throughput/low resolution grism GRIS_150I (5.2Å/pixel). For each mask five exposures of 2.9 ksec each were obtained (totaling 14.5 ksec). ARC1 is part of the ‘M129’ mask, and ARC2 of the ’M128’ mask. The four nights had variable seeing, ranging from 0.6 to 1.0, and were likely not fully photometric. Nevertheless we obtained a crude flux calibration of these observations using the spectrophotometric standard star GD108.
ARC2 displays only one strong emission line at Å. We identify it as Oii, and thus calculate a redshift of . The derived redshift for ARC1 (Fig. 5) is based on the strongest interstellar absorption lines: Siii1260.42Å, Oi1302.17Å and Cii1334.5Å as well as Civ1548.19 and 1550.77 in absorption. There is also a hint of the triple Sivi lines at 1397Å and the Siii1526.70Å line.
The ARC1 spectrum lacks AGN signatures sometimes found in the spectra of radio selected sub-mm galaxies. Moreover, it appears to show Ly in absorption, a feature seen in only about 20% of the spectroscopic survey of sub-mm galaxies conducted by Chapman et al. (2004). That ARC1 does not look similar to most known sub-mm galaxy spectra does not necessarily mean it is not the host of the sub-mm emission. The set of blank-field sub-mm galaxies with spectroscopically determined redshifts are biased towards galaxies with strong Ly emission, and it is clear we are studying a sub-mm galaxy which is intrinsically much fainter (and possibly much different) than those reported in Chapman et al. (2003, 2004).

3 A lensing model for MS 0451.60305
In our first attempt to model the system we employed a simple isothermal ellipsoid for the cluster mass (using parameters from D03), and a second elliptical mass distribution to model the Brightest Cluster Galaxy (BCG). This allowed us to gauge the general properties of the lens, and showed that the ridge of sub-mm emission generically lies along the critical line for high redshift sources. However, the importance of determining the precise position and magnifications of the multiply lensed EROs necessitated a more detailed approach. Indeed, as the Chandra contours in Fig. 2 show, the mass within the central 1′ of the cluster is not smoothly distributed, and the BCG position and X-ray centroid are not coincident.
To model the mass distribution of this cluster we used both a cluster mass scale component and cluster galaxy mass component in a similar way to Kneib et al. (1996; see also Smith et al. 2003). Using the lenstool software (Kneib 1993) we interactively implemented the lensing constraints. The high resolution HST data show a clear mirror symmetry along the ARC1, making it the merging of 2 images (fold arc). A simple elliptical model allows us to identify its counter-image 3′′ to the south-east of B3/C3, which is much less amplified (see Table 1).
Similarly, the ERO B/C pair can then be included in the lensing model. B1/C1 and B2/C2 are straddling the critical line at redshift , thus by placing the B/C pair at , we easily identify B3/C3 as the third image of the B/C pair.
By combining the ARC1 and B/C constraints, we refined the mass model, and are able to place more precise limits of for the ERO B/C pair. It is therefore likely that both ARC1 and B/C are at the same redshift. If it is the case, then the separation between the LBG and the ERO pair in the source plane is only kpc, suggesting that these 3 galaxies are interacting.
Using the photometry derived from the optical and near-infrared data, as well as the magnifications estimated from the lensing model, we summarize, in Table 1, the list of objects highlighted in Fig. 2 and Fig. 4.
| ID | RA | DEC | F702W | F775W | F850LP | Mag. | ||||
|---|---|---|---|---|---|---|---|---|---|---|
| ARC1 | 04:54:13.0 | 03:00:55.9 | 1.0 | 50–100 | ||||||
| ci(1′′) | 04:54:11.1 | 03:01:26.6 | … | 4.7 | ||||||
| B1 | 04:54:12.8 | 03:00:44.1 | 2.5 | 8 | ||||||
| B2 | 04:54:12.7 | 03:01:01.3 | 2.2 | 10 | ||||||
| B2(1′′) | 2.5 | |||||||||
| C1 | 04:54:12.8 | 03:00:47.6 | 10 | |||||||
| C2 | 04:54:12.7 | 03:00:59.1 | 11 | |||||||
| B3/C3 | 04:54:10.9 | 03:01:24.5 | 3.1 | 5 | ||||||
| P | 04:54:15.6 | 03:00:38.7 | … | 1.5 |
4 Discussion
With the lensing model in hand, we are now able to further examine which galaxy hosts the sub-mm emission. Apart from the (we believe remote) possibility that the sub-mm emission arises from other sources entirely, there are 3 obvious possibilities, which we discuss in turn. We also comment on the additional sub-mm source to the east of the arc, which we label ‘P’.
4.1 Scenario 1: The blue arc as the source of the sub-mm emission.
Although the spectrum for ARC1 does not match that of a ‘typical’ sub-mm galaxy from the Chapman et al. (2004) sample, it is similar to the most absorbed quartile of the Lyman break galaxies (LBGs), which generally correlate with the reddest, most dust extincted varieties (see Shapley et al. 2003). It is this dust which can be responsible for the sub-mm emission, though using the rest frame UV spectra of LBGs to estimate the sub-mm flux is notoriously difficult (Chapman et al. 2000). In a sample of Lyman break galaxies with the most extreme reddening (and hence most likely chance to be sub-mm bright), only one (MMD-11) was detected.
Indeed, several other studies find a similar lack of sub-millimeter emission from individual LBGs (Webb et al. 2003, Borys et al. 2004). On the other hand, Peacock et al. (2001) stack LBGs in the deep sub-mm map of the Hubble Deep Field (Hughes et al. 1998) to estimate that the average 850m flux from an LBG is mJy/Myr-1. Given that the unmagnified sub-mm flux would be mJy if the LBG is the host, then it is entirely possible that we have simply detected an ordinary LBG producing stars at a rate of a few solar masses per year.
An argument against ARC1 being the sole sub-mm source is the fact that the sub-mm emission is much more extended than the optically detected arc. It extends at least 15 arcseconds further north (a full SCUBA beam-width). Over 45 arcseconds (3 beams) separate the arc from B3/C3, where the toe of the sub-mm emission to the south-west tapers off. Note that the ARC1 counter-image is too faint to be responsible for the toe, since the amplification factors predicted from the lens model are not consistent with the observed sub-mm flux. Even assuming the lowest reasonable magnification factor for ARC1, we would predict only mJy of 850m flux at the position of the ARC1 counter-image.
4.2 Scenario 2: Contribution of the multiply lensed EROs to the sub-mm flux.
Galaxies with very red colours often suggest the presence of large amounts of dust, and several sub-mm blank field surveys (Ivison et al. 2002, Webb et al. 2003, Borys et al. 2004) have found such objects coincident with sub-mm detections. The triply-imaged ERO pair in MS 0451.60305 is therefore a reasonable candidate for the counterpart to the sub-mm arc. The relative fluxes of objects B1/C1 and B3/C3 match the relative amplifications predicted from the lensing model. B2 is a little difficult to compare, given the uncertainty in the flux due to the contamination from a nearby source, and the discrepancy with C2 has already been discussed.
Unlike the last scenario, the position of the three images can easily accommodate the extremities of the extended emission. The sub-mm contours around B3/C3 suggest that it is a SCUBA point source, though the signal-to-noise is insufficient to be certain. Assuming B/C is the host of the sub-mm emission, and using the peak 850m flux of 12 mJy, we would predict 6 mJy at the position of B3/C3. This is essentially what is observed. If the EROs are the host of the sub-mm emission, then the unmagnified flux is mJy at 850m.
It is also worth noting the several red objects in southern part of field. These are in the same region as the southernmost extension of the sub-mm arc, and might be contributing sub-mm flux: Using colour-colour plots and the Pozzetti & Mannucci (2000) criteria for distinguishing dusty starbursts from passively evolved ones, Tanaka et al. (2003) show that both object B and an red object 4′′ to the northeast of B3/C3 are consistent with dusty starbursts. If so, this would help explain the extended sub-mm emission between B3/C3 and its counter-images.
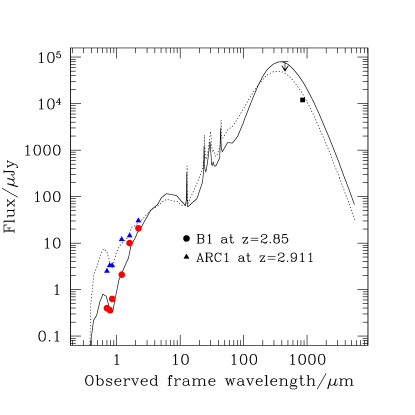
In Fig. 6 we plot the optical fluxes for the best detected object from this trio of pairs, B1, on a template SED obtained from the library of Efstathiou, Rowan-Robinson, & Siebenmorgen (2000). These combine the Bruzual & Charlot stellar population synthesis models (Bruzual & Charlot 1993) with a radiative transfer code , and produce SED templates that match local star-burst galaxy spectra. We translated the templates to and scaled them to match the NIR fluxes. As Fig. 6 shows, there is reasonable agreement between the assumed redshift, the measured photometry, and the SED template. There is some freedom in these models, and hence we have not attempted to provide detailed constraints on the star-burst age, formation history, and composition. The main point is that the data support the claim that the EROs can be responsible for the sub-mm flux. Ground based NIR spectroscopy, as well as Spitzer observations, will be of considerable help in determining the nature of this galaxy pair.
4.3 Scenario 3: Contribution from both
We have now established that both objects are capable of producing sub-mm flux, so naturally we need to ask if both objects are contributing to the sub-mm arc. To test this, we created a blank map the same size as the SCUBA data, and inserted sources at positions corresponding to B1, B2 and B3, as well as ARC1. The relative fluxes between B1, B2 and B3 was fixed by the lensing model predictions for amplification, leaving the flux ratio between ARC1 and B1 as the only remaining parameter. The final constraint is that the peak flux needs to match that observed, which in this case is 12 mJy. The results of these simulations are shown in Fig. 7.

We found that no contribution from ARC1 resulted in B1/2 being resolvable, which does not match the observed sub-mm image. In addition, ARC1 needs to contribute at least 2 mJy in order to ‘fill in’ the gap between B1/2. At more than 7 mJy, ARC1 dominates the contours, and fails to reproduce the extended nature of the source. Although it is difficult to precisely constrain the relative contributions, this exercises suggests that sub-mm emission from both the LBG arc and the ERO pair are required to explain the morphology and brightness of the sub-mm arc, with of the observed flux coming from the ERO B/C pair.
4.4 The sub-mm point source, ‘P’
Though the ERO pair and LBG arc just discussed are the focus of this paper, it is worth noting the blue galaxy ‘P’, which seems coincident with the SCUBA detected point source north-east of the arc. Because there is simply no other optically detected galaxy within the error circle (6′′) of the SCUBA source, it is reasonable to conclude that the objects are at least associated with each other, even if they are not necessarily the same thing.
Note in Fig. 2 how the X-ray contours bend around this object. This suggests the presence of another massive component interacting with the cluster, or perhaps a projection effect from another X-ray cluster. If the sub-mm object is behind the cluster, then it is only weakly lensed; the prediction is from our lensing model, meaning that the unmagnified 850m flux for this object would be about 4 mJy. The lack of a 450m detection is not very constraining. Using a wide range of temperatures and emissivities in a single dust component SED, we predict a 450m flux for . Since the 450m map has a upper limit comparable to this, we cannot rule out that the sub-mm source is actually coming from the cluster itself. This would be an interesting case, since it would suggest that star-formation is occurring in a massive sub-component merging with MS 0451.60305. Further spectroscopic and X-ray studies may unravel this particular mystery.
5 Conclusions and future work
We have presented broad-band sub-mm and near-IR images of the cluster MS 0451.60305 and attempted to understand the nature of the highly extended sub-mm emission. The only other case of a multiply lensed sub-mm detection in a cluster field has recently been reported in Abell 2218 (Kneib et al. 2004). They identified the source of the triple sub-mm image as a LBG galaxy (showing a complex structure, indicative of a close merger) in a group.
In the case of MS 0451.60305, the evidence suggests that the sub-mm emission is coming from at least two components: a blue arc at and a multiply imaged ERO pair predicted from the lens model to be at . Using a simple model for the 2 sources, we estimate that the multiply lensed EROs contribute 2/3 of the observed flux in the sub-mm arc. Correcting for the lensing amplification, we estimate that the unlensed fluxes at 850m are 0.1 mJy for the LBG and 0.4 mJy for the ERO pair.
The uncertainty in the redshift for the ERO keeps the possibility open that the ERO pair and LBG are at identical redshifts. This would place them only 10 kpc apart at , and implies that the objects are interacting and their interaction is likely to be the origin of a violent star-burst revealed by the strong sub-mm emission. To confirm that the LBG is effectively spatially connected with the ERO pair can only be determined by measuring the redshift of the EROs using NIR spectroscopy or via millimeter CO line search; Given the constraints on the redshifts of either candidate, sub-mm CO observations can be used to detect the CO(3-2) transition line that falls within the observation window of several ground-based heterodyne receivers.
To verify these conclusions, and to accurately separate the contributions from each component will require sub-mm/mm interferometry. The SCUBA flux is bright enough that it should be detectable using the IRAM Plateau de Bure interferometer. The SMA and ultimately ALMA will also have the power to resolve the components in great detail. With such further study, and using the lensing amplification of nature’s telescope, we should be able to provide a full accounting of the source of sub-mm emission in this intriguing system.
Acknowledgments
CB thanks the referee, Ian Smail, for comments that greatly improved the paper, Margrethe Wold and Duncan Farrah for useful discussions regarding NIR data reduction, as well as Dan Durand and Luc Simard at HIA for their assistance in recovering the ACS data. We also thank Stella Seitz for discussions regarding the VLT spectra, as well as Linda Tacconi and Dieter Lutz. This work was supported in part by the Natural Sciences and Engineering Research Council of Canada. JPK acknowledges support from Caltech and CNRS. The James Clerk Maxwell Telescope is operated by The Joint Astronomy Center on behalf of the Particle Physics and Astronomy Research Council of the United Kingdom, the Netherlands Organisation for Scientific Research, and the National Research Council of Canada. The HST data were recovered from the Canadian Astronomy Data Centre (CADC), which is operated by the Herzberg Institute of Astrophysics, National Research Council of Canada. The Guide Star Catalogue II is a joint project of the Space Telescope Science Institute and the Osservatorio Astronomico di Torino.
References
- (1) Appenzeller I., Rupprecht G.,1992, FORS, the Focal Reducer for the VLT, The Messenger, March, pg 18.
- (2) Blain A.W., Smail I., Ivison R.J., Kneib J.-P., Frayer D.T., 2002, Phys.Rept. 369, 111
- (3) Borys C., et al., 2004, MNRAS, in prep.
- (4) Bruzual A. G., Charlot S., 1993, ApJ, 405, 538
- (5) Chapman S.C., et al., 2004, in prep
- (6) Chapman S.C., Blain A. W., Ivison R. J., Smail I. R., 2003, Nature, 422, 695
- (7) Chapman S.C., Scott D., Borys C., Fahlman G.G., 2002a, MNRAS, 330, 92
- (8) Chapman S.C., et al. 2000, MNRAS, 319, 318
- (9) Chapman S.C., Shapley A., Steidel C., Windhorst R., 2002b, ApJL, 572, L1
- (10) Donahue M., Gaskin J. A., Patel S. K., Joy M., Clowe D., Hughes J. P., 2003, ApJ, 598, 190
- (11) Efstathiou A., Rowan-Robinson M., Siebenmorgen R., 2000, MNRAS, 313, 734
- (12) Ford, H., et al., 1998, Proc. SPIE, 3356
- (13) Gioia I.M., Maccacaro T., Schild R.E., Wolter A., Stocke J.T., Morris S.L.,Henry J.P., 1990, ApJS, 72, 567
- (14) Gioia I.M. & Luppino G.A., 1994, ApJS, 94, 583
- (15) Holland W.S., et al., 1999, MNRAS, 303, 659
- (16) Hughes D., et al., 1998, Nature, 394, 241
- (17) Ivison R. J. et al., 2002, MNRAS, 337, 1
- (18) Kneib J. P., Mellier Y., Fort B., Mathez G., 1993, A&A, 273, 367
- (19) Kneib J.-P., Ellis R. S., Smail I., Couch W. J., Sharples R. M., 1996, ApJ, 471, 643
- (20) Kneib J. P., van der Werf P. P.,Kraiberg-Knudsen K., Smail I., Blain A., Frayer D., Barnard V., Ivison R., 2004, MNRAS, accepted
- (21) Koekemoer A. M., Fruchter A. S., Hook R. N., & Hack W., 2002, Proceedings: The 2002 HST Calibration Workshop,Baltimore, MD, October 17 and 18, 2002. ed. S. Arribas, A. Koekemoer, and B Whitmore.
- (22) Luppino G.A., Gioia I.M., Hammer F., Le Févre O., Annis J.A., 1999, A&AS, 136, 117
- (23) Molnar S.M., Hughes J.P., Donahue M., Joy M., 2002, ApJ, 573, L91.
- (24) Peacock J. A. et al., 2000, MNRAS, 318, 535
- (25) Pozzetti L., Mannucci F., 2000, MNRAS, 317, L17
- (26) Reese, E.D., et al., 2000, ApJ, 533, 38
- (27) Smail I., Ivison R.J., Blain A.W., 1997, ApJ, 490, L5
- (28) Smail I., Ivison R. J., Kneib J.-P., Cowie L. L., Blain A. W., Barger A. J., Owen F. N., Morrison G., 1999, MNRAS, 308, 1061
- (29) Smith G. P., Edge A. C., Eke V. R., Nichol R. C., Smail I., Kneib J., 2003, ApJ, 590, L79
- (30) Shapley A. E., Steidel C. C., Pettini M., Adelberger K. L.,2003, ApJ, 588, 65
- (31) Stanford S. A., Eisenhardt P. R., Dickinson M., 1998, ApJ, 492, 461
- (32) Stompor R., et al., 2002, Physical Review D,65
- (33) Takata T., et al., 2003, PASJ, 55, 789
- (34) Tegmark M., 1997, ApJ, 480, L87
- (35) Webb T. M. A., et al., 2003, ApJ, 582, 6
- (36) Webb T. M. A., Lilly S. J., Clements D. L., Eales S., Yun M., Brodwin M., Dunne L., Gear W. K., 2003, ApJ, 597, 680
- (37) Wehner E. H., Barger A. J., Kneib J.-P., 2002, ApJ, 577, L83
- (38) Wright E. L., Hinshaw G., Bennett C. L., 1996, ApJ, 458, L53
- (39) Zemcov M., Halpern M., Borys C., Chapman S., Holland W., Pierpaoli E., Scott D., 2003, MNRAS, 346, 1179
Appendix A Map-making by direct matrix inversion
To make maps from data taken with SCUBA, one normally adds the measured signal into the pixel corresponding with the position of a bolometer in the ‘on’ position. For observations with in-field chopping however, this will result in a map with negative echos. Since the MS 0451.60305 field appears to be quite dense in bright sub-mm sources, it is necessary to deconvolve the chop to obtain a single-beam map. This can be posed as a linear algebra problem. Following the notation given in Stompor et al. (2002), the measurements that make up the time-stream data vector, are related to a pixelized region of sky, that has elements via a sparse MN mapping matrix, :
| (1) |
The vector is the noise estimate for each measurement with statistical properties described by . The best estimate of the flux in the pixelized map, , in a least squares sense, has a well known solution (Stompor et al. 2002, Tegmark 1997, Wright 1996):
| (2) | |||||
| (3) |
is an matrix that measures how much the pixels are correlated with each other. is the formal error estimate for pixel . is typically extremely sparse, with each row here having only three non-zero entries [] corresponding to the pixels that the primary and 2 off bolometers hit. Given that SCUBA observations are differential in nature, the matrix is formally singular, since there exists a non-zero vector where . Specifically, and unsurprisingly, the degeneracy is in the overall mean of the map, which SCUBA is insensitive to (i.e., setting to a constant).
measures how correlated the noise is in the time domain. For anything but uncorrelated noise this matrix is difficult to manage without special techniques, since is a matrix and can easily reach samples. The combined dataset for MS 0451.60305 has samples at 450/850m , corresponding to 12 hours of integration time.
Assuming uncorrelated noise, the matrix and vector can be populated in time order, requiring operations. Thus we are faced only with the task of inverting an matrix. 850m jiggle maps are typically binned into 3′′ pixels in order to reasonably sample the beam. Given the 2.3′ field of view of a jiggle map observation, the number of pixels is on the order of a few thousand, which is small enough that any modern workstation can invert the required matrix and obtain the solution in an acceptably short time.
The only caveat is in the selection of ‘dummy pixels’, which are used to account for positions a bolometer may hit that are outside the solution region. For example, the 1999 data used 180 arcsec chop-throws, which place the bolometers in the off position well outside the central target region. The procedure we adopt is to assume that there is no signal outside the target region, and assign a single dummy pixel. To verify the procedure, simulated data-sets were created, based on the astrometry information in the MS 0451.60305 observations. False sources were placed such that some of the time the chop would cancel out their signals. To correct for the mean of the map (which is forced to zero), we select a region of the map free of sources and compute the average signal, which is then applied to the whole map (there is some subjectivity to this procedure, since for real maps one will not know for certain which regions are devoid of signal). The for the reconstructed maps compared against the input source map was always within of the number of pixels in the map. In doing these tests, we also tested varying the number and position of dummy pixels to verify that they did not adversely affect the inversion.
This algorithm was then applied to the actual MS 0451.60305 data. First, maps from the 2 separate runs were solved and compared. The between these half maps is better than that obtained from the raw maps. The overall improvement was not very dramatic but this is not completely unexpected since the chop configuration only causes 2 of the sources in the map to interfere with each-other. Also, the 1999 data are of superior quality, and hence is weighted higher in the inversion. However, the improvement in consistency between the half maps is dramatic in the regions where there are chopped sources.
Although the gain may be marginal in some cases, in general this direct inversion technique can be straightforwardly applied to SCUBA jiggle-map data.It is easy to automate the procedure, with the only required input being how to treat bad bolometers, how to assign pixels outside the target region, and what to do about the DC level.