The Impact of Distance Uncertainties on Local Luminosity and Mass Functions
Abstract
In order to investigate discrepancies between recent published estimates of the the HI mass function (HIMF), we explore the impact of distance uncertainties on the derivation of the faint end slope of mass and luminosity functions of galaxies in the local volume by deriving HIMFs from mock HI surveys. We consider various survey geometries and depths and compare the HIMFs measured when using “real” distances, distances derived by assuming pure Hubble flow and distances assigned from parametric models of the local velocity field. The effect is variable and dependent on the exact survey geometry, but can easily lead to incorrect estimates of the HIMF, particularly at the low mass end. We show that at least part of the discrepancies among recent derivations of the HIMF can be accounted for by the use of different methods to assign distances. We conclude that a better understanding of the local velocity field will be necessary for accurate determinations of the local galaxy luminosity and mass functions.
Subject headings:
galaxies: luminosity function, mass function—galaxies: distances and redshifts— radio lines: galaxies1. Introduction
One of the perplexing discrepancies between observations and CDM theory revolves around the “missing satellite” problem. Numerical simulations in CDM predict a value for the logarithmic slope of the faint end of the halo mass function, , which is close to the value of that arises analytically from the Press-Schechter formalism (Press & Schechter 1974), but most recent determinations of the optical luminosity function (LF) in the local volume yield values of that are significantly flatter. Complementary to the results on the optical LF, several determinations of the local HI mass function (HIMF) have likewise yielded relatively flat faint-end slopes. The over-prediction of the number of low mass objects relative to those actually observed is considered one of the last remaining stumbling blocks for CDM, and points towards a new understanding of the baryon physics of galaxy formation. It is obviously desirable that all of the uncertainties in the observed luminosity and mass functions be well understood.
To derive a luminosity (or mass) function from observational data, the sample selection effects must be considered carefully. In most surveys, the lowest luminosity (or mass) objects are only visible nearby, and their contribution must be weighted accordingly. Fractional distance errors can be large for relatively nearby objects, and can thus have a very strong impact on determinations of the faint end characteristics of luminosity (or mass) functions. When those functions are evaluated using data obtained in clusters, the principal source of uncertainty lies in the assessment of membership; assuming that uncertainty is to first order independent on luminosity (or mass), it can have a small impact on the estimate of LF slopes. Determinations of the HIMF, however, have to rely on relatively shallow, wide area surveys to detect low HI mass objects over a sufficient volume, and are thus most susceptible to uncertainties associated with distance errors in the nearby population.
Primary distances (eg. cepheids, the tip of the red giant branch or surface brightness fluctuations, the best of which give distances to 10%) are available for galaxies, most within Mpc. Secondary distances (which rely on the above methods for calibration) carry larger errors ( 15–30%) but do account for peculiar velocities for some 5000 objects. For all other galaxies, the only indication of distance is their redshift. Outside of km s-1, pure Hubble flow works well, since a typical peculiar velocity of a few hundred km s-1 creates an uncertainty on the redshift distance of 10%. For closer galaxies, however, the relative error is much larger, and, for the nearest objects, whose recessional velocities are dominated by peculiar motions, the error can be a factor of two or more. Furthermore, peculiar velocities are not random but exhibit coherent flows towards local over-densities. In some directions, the redshift-distances of all (nearby) galaxies will be systematically under- or over- estimated if peculiar velocities are ignored.
The effects of peculiar velocities on distance determinations can be mitigated by the use of parametric models of the local velocity field. While clearly oversimplifications of the real flows, such models give a direction-dependent redshift-distance prescription. A recent example of such a model is the multi-attractor model of Tonry et al. (2000; hereafter TB00: also see Willick & Batra 2001).
In order to investigate the effects of distance uncertainties on local luminosity or mass functions, we consider here the derivation of the HIMF. Recent determinations of the local HIMF have yielded discrepant results on the abundance of low HI mass objects, namely: Zwaan et al. (1997; Z97), Rosenberg & Schneider (2002; RS02) and Zwaan et al. (2003; Z03). The Z03 HIMF is based on the HI Parkes All Sky Survey (HIPASS) Bright Galaxy Catalogue (BGC), while the Z97 and RS02 HIMFs are both based on drift scan surveys conducted at Arecibo during the period of its recent upgrade (respectively called AHISS, the Arecibo HI Strip Survey, and ADBS, the Arecibo Dual Beam Survey). A summary of the results of those surveys is provided in Table 1, parameterized as Schechter functions,
| (1) |
where , is the HI mass, and is the total number density of galaxies. The faint end slopes of the HIMF derived by the three surveys vary between and , yielding extrapolations below M⊙ that disagree by an order of magnitude, the RS02 HIMF having the steeper slope.
| Reference | Z97 | RS02 | Z03 |
|---|---|---|---|
| Survey | AHISS | ADBS | HIPASS |
| 0.0048 | 0.0047 | 0.0070 | |
| 9.86 | 9.94 | 9.85 | |
| -1.20 | -1.53 | -1.30 | |
| Survey area | 65 deg2 | 430 deg2 | 20,600 deg2 |
| for M⊙ | 100 Mpc | 13 Mpc | 7 Mpc |
| # galaxies | 61 | 265 | 1000 |
Previous studies of the impact of distance errors (from ignoring peculiar velocities) on HIMFs have modeled the effect, often called the ‘Eddington effect’, by adding random Gaussian noise to the distances. Using this model, RS02 conclude that the effect is negligible in their survey volume until velocity dispersions of 600 km s-1 are reached, while Z03 find that for an assumed velocity dispersion of 50-100 km s-1 in the local universe ( km s-1) the slope of the low mass end of the HIMF probably steepens by . Since the peculiar velocity field in the local universe is not random but rather dominated by in-fall onto the Virgo cluster, these models could easily hide the main bias. In this paper, we investigate whether all or part of the discrepancy among the three HIMF determinations can be accounted for by the effects of distance uncertainties introduced by the different methods used by Z97, RS02 and Z03 to assign distances.
Here, we construct mock catalogs designed to mimic the HI surveys conducted by Z97, RS02 and Z03 and then derive mock HIMFs under different distance assumptions. is assumed throughout, and the dependence on is explicitly listed using ).
2. Survey Simulations
We first construct a mock catalog of HI rich objects in the local universe, which is then “observed”. In order to account for the known local variations in the 3D distribution of galaxies, a version of the density and velocity fields derived from the IRAS Point Source Catalog Redshift Survey (PSC) with a value is used (kindly provided by E. Branchini, see Branchini et al. 1999 for details). This map extends to a distance of 120 Mpc with a grid spacing is 0.9375 Mpc in the inner 60 Mpc, and twice that in the outer shell. The map has been smoothed with a Gaussian filter of radius 3.2 Mpc.
The volume is seeded with HI rich galaxies according to the density field, and masses are assigned from a given HIMF. The HI sizes of the galaxies and velocity widths are calculated according to empirical scaling relations derived from our own HI survey data and from Broeils (1992). Inclinations are randomized, realistic scatter is added to the scaling relations (as measured from the empirical fit) and a turbulent velocity of 10 km s-1 is added to construct the observed velocity width.
The HI mass of a galaxy at a distance (in Mpc), and with observed HI line flux can be approximated as where is the peak flux in the HI line in Jy and is its width in km s-1. The detectability of a HI rich galaxy depends on both the peak flux and the width of the HI line. If we assume that smoothing of the spectrum is applied to match the width of the lines, up to a maximum of km s-1, the signal-to-noise ratio can be derived from the standard radiometer equation such that
| (2) |
where for km s-1, and for km s-1, accounting for the effects of smoothing; is the fraction of the source covered by the telescope beam; is the integration time; CBW is the channel bandwidth and describes the gain of the telescope. Specific details of the simulated observations are given in Section 3 below.
The observed HI mass of a galaxy is where is the distance assigned to the galaxy and is its true distance. From the set of “detections” we construct HIMFs by summing (the total volume within which a galaxy can be seen) weighted by the average density in that volume (from the PSC density field) in bins of . This method prevents over- or under- dense regions from giving an over- or under-estimate of number counts in certain bins. If , we recover the input HIMF. We investigate below the effect that has on the recovered HIMF for various survey geometries and depths.
3. Results and Discussion
3.1. Simulated HIPASS BGC
First, we consider a mock catalog constructed to mimic the HIPASS BGC which contains the 1000 galaxies in the southern sky with the largest peak HI flux (see Z03). To remove the effects of cosmic variance an average obtained from 10 simulations is used.
Most of the galaxies in the real BGC have their distances estimated using Hubble’s Law, and yet are within km s-1. We investigate what effect this assumption has (if any) on the derived HIMF. As noted in Table 1, the HIMF derived from the HIPASS BGC has a shallower low mass end slope than that derived from the ADBS in RS02. We will see if any part of this discrepancy can be accounted for by the use of Hubble’s Law to assign distances by Z03.
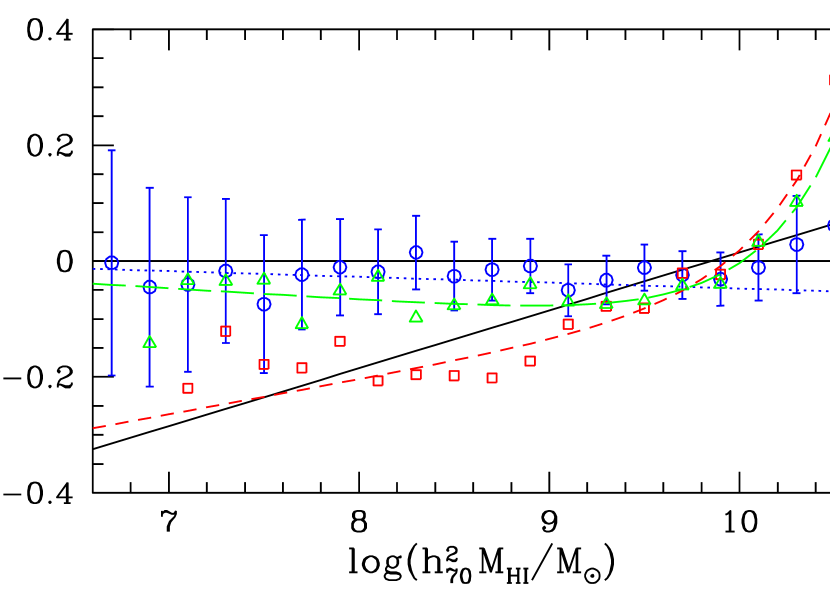
Figure 1 shows the difference between the input and reconstructed HIMFs for the input (or “true”) distances, distances derived by assuming Hubble flow, and distances from the multi-attractor model of TB00. Clearly, significant variations arise among the HIMFs constructed from the mock HIPASS BGC when different distance estimators are used. The HIPASS survey volume does not contain the Virgo Cluster and therefore has a fairly quiet local velocity field; however, as can be seen from the figure, the low mass slope of the HIMF will be underestimated if pure Hubble flow is assumed. In Figure 1, the input HIMF is the same as Z03 (see Table 1), except that the low mass slope has been steepened to . The HIMF recovered from this mock HIPASS BGC is close to that reported by Z03 when Hubble flow is assumed.
We suggest that an adjustment of should be applied to the Z03 low mass slope, making it . This correction makes the result consistent with the RS02 result of (where here the error on the RS02 result is estimated by scaling that reported for Z03 by ). This change in low mass slope, while interesting in the light of comparisons with CDM, has little effect in the total HI mass density implied by the surveys. The total mass density, dominated by galaxies, is already in agreement between the two surveys.
3.2. Simulated Virgo cluster survey
As the nearest rich cluster to us, Virgo represents the highest density region in the local Universe, and thus constitutes the obvious choice for the study of the HIMF in a high density environment. The northern hemisphere sky accessible to the Arecibo telescope covers both the Virgo cluster and comparably-far regions of lowest cosmic density located roughly in the anti–Virgo direction. The arrival in 2004 of the Arecibo L-Band Feed Array (ALFA) will revolutionize mapping capability at the Arecibo telescope and will allow study of possible variations in the HIMF in different density environments, already suggested by RS02 but with low statistical significance. Here, we investigate the potential of a proposed ALFA survey of an area centered on the Virgo cluster (RA=, DEC=), assuming Jy, and with s (drift scan) and CBW=25 kHz. The mean noise in such a survey would be 4 mJy/beam (at our assumed maximum resolution of 5 km s-1). This can be compared to 20 mJy/beam for HIPASS and 8.6 mJy/beam for the ADBS, see Barnes et al. (2001) and RS02; here both values have been scaled to a resolution of 5 km s-1. We also consider an equal area in the anti-Virgo region. (RA=, DEC=). This region of the sky is not accessible to Arecibo, but for the purposes of illustrating the effects of distance uncertainties on the construction of HIMFs, the combination of such a Virgo-anti-Virgo survey provides a good comparison between the nearest regions of high and low cosmic density.
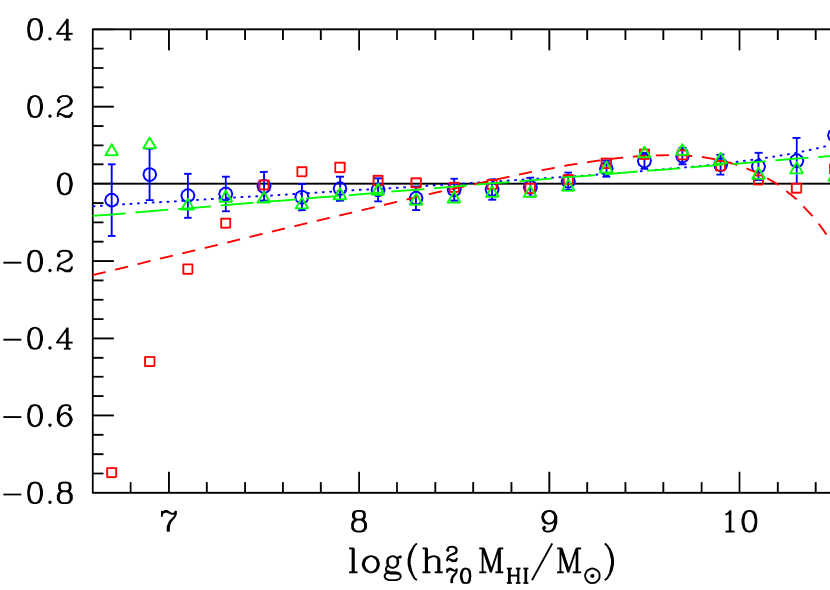
In the Virgo region, we are able to reconstruct the input HIMF well when the “true” distances are used, and reasonably well with distances taken from the multi-attractor model of TB00. However, if pure Hubble flow is assumed, the number of galaxies at the low mass end of the HIMF is seriously underestimated (see Figure 2). The lowest mass galaxies in our mock survey are seen only in the foreground of Virgo (the mass limit at 17 Mpc, the approximate distance of the Virgo cluster, is M⊙ from Eqn 2 assuming WHI=100 km s-1 and CBW=25 kHz). If pure Hubble flow is assumed the vast majority of these foreground galaxies will have their distances (and hence masses for a given HI flux) overestimated, since they are in-falling towards Virgo.
The two recent Arecibo–based derivations of the HIMF (Z97 and RS02) include part of the Virgo cluster within the overall survey area. The low mass end slopes derived from these surveys differ by (with Z97 having the shallower slope). In RS02, the multi-attractor model of TB00 is used to assign distances, while in Z97 pure Hubble flow is assumed. However, the difference between the two HIMFs cannot be explained by their use of different distance estimators. The Z97 survey was designed to be extremely sensitive but covers a very small area. In deeper surveys, we expect the effect described above diminishes. We have constructed a Z97-like survey (of similar depth and area), and, as expected, the HIMF can be reconstructed equally well in such a deep survey with all three distance estimates. We therefore must resort to the usual arguments of small-number statistics (noting that there were only 65 galaxies in the Z97 HIMF) and differing treatments of completeness to explain the discrepancy between the HIMFS of Z97 and RS02.
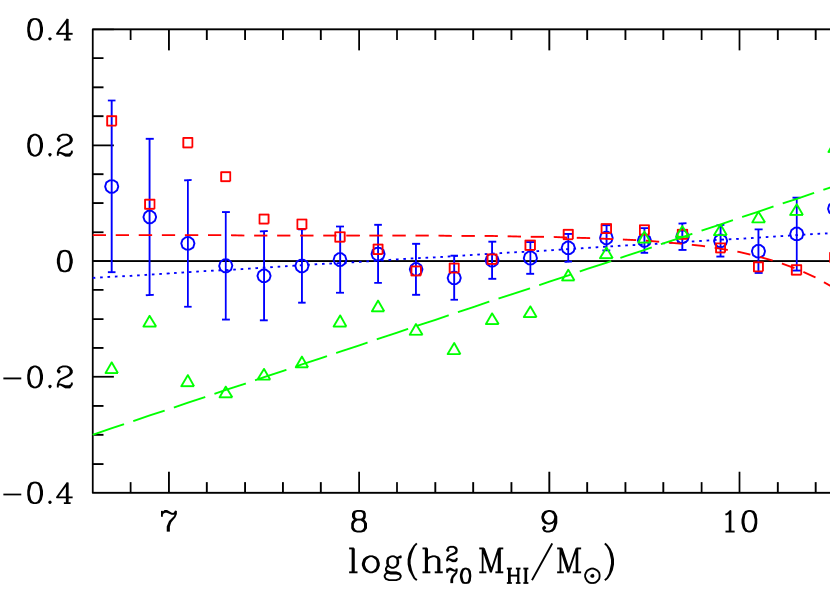
In the Anti-Virgo region, the input HIMF can be reconstructed well using either “true” distances or by assuming Hubble flow. Here the use of the multi-attractor model of TB00 causes the largest bias; acting to create an underestimate of the number of low mass HI galaxies (see Figure 3). The multi-attractor model of TB00 is based on distances to 300 elliptical galaxies. There are approximately 30 of these galaxies in the Virgo region discussed here, but fewer than 5 in the anti-Virgo region. At the depth of these HI surveys, the anti-Virgo region is relatively under-dense, making it unavoidable that there will be few tracer galaxies in that direction. This undersampling has the effect of forcing the model for the velocity field to fit better towards Virgo at the expense of the fit in the anti-Virgo direction. The multi-attractor model of TB00 consistently over-estimates the distance for a given velocity in the anti-Virgo direction leading to the observed underestimate of the number of low mass galaxies (as discussed above).
4. Conclusions
We have used mock HI survey data to demonstrate that distance uncertainties can create serious biases in the low mass end of the HIMF; similar arguments could be applied to studies of the field galaxy optical LF. When the effects of the local peculiar velocity field are ignored, incorrect estimates of the HIMF will be derived. The exact nature and size of the bias will depend both on the survey geometry and its depth.
In a survey constructed to simulate the HIPASS BGC, the low mass HIMF slope is underestimated if peculiar velocities are neglected. We suggest that the HIMF reported by Z03 suffers from this problem, which when corrected, would bring the Z03 and RS02 HIMFs into agreement within their errors. The adjusted value of the Z03 low mass slope is , which is to be compared with the RS02 value of . This change does not affect the implied HI mass density since it is dominated by galaxies.
For a survey where low mass galaxies are seen only in the foreground of Virgo, the distances (and therefore masses) of the nearby low mass galaxies will be overestimated and the low mass end of the HIMF seriously underestimated if in-fall onto Virgo is neglected. In deeper surveys, the effect becomes negligible, so that differences in the adopted distances alone cannot explain the discrepancy between the Z97 and RS02 HIMFs.
A simulated survey in the anti-Virgo region points to the limitations of currently available models for the local velocity field. In such a survey, use of distances taken from a multi-attractor model for the local velocity field leads to an underestimate of the low mass HIMF slope. Currently available flow models are not well constrained in the anti-Virgo direction because of a lack of galaxies with primary distances in the region. Velocity field models based on larger numbers of tracer galaxies will be required to solve this problem.
The use of a good model for the local peculiar velocity field is found to be essential to provide distances for nearby galaxies for which no redshift-independent distances are available. Without such a model, it is difficult to derive an unbiased HIMF, and in particular, the low mass end may be in error. Disentangling the effects of environment and evolution of the HIMF will not be possible unless the local flow model is well understood. Other applications where distances to galaxies are needed will also benefit from a better understanding of local flows.
References
- Barnes et al. (2001) Barnes, D.G., et al. 2001, MNRAS, 322, 486
- Broeils (1992) Broeils, A.H. 1992. Ph.D. thesis, U. Groningen.
- Branchini et al. (1999) Branchini, E., et al. 1999, MNRAS, 308, 1.
- Press & Schechter (1974) Press, W. & Schechter, P. 1974, ApJ, 187, 425
- Rosenberg & Schneider (2002) Rosenberg, J.L. & Schneider, S.E. 2002, ApJ, 567, 247 (RS02).
- Tonry et al. (2000) Tonry, J.L., et al. 2000, ApJ, 530, 625 (TB00).
- Willick & Batra (2001) Willick, J.A., Batra, P. 2001, ApJ, 548,564.
- Zwaan et al. (1997) Zwaan, M.A., et al. 1997, ApJ, 490, 173 (Z97).
- Zwaan et al. (2003) Zwaan, M.A., et al. 2003, AJ, 125, 2842 (Z03).