The evolution of substructure III: the outskirts of clusters
Abstract
We present an investigation of satellite galaxies in the outskirts of galaxy clusters taken from a series of high-resolution -body simulations. We focus on the so-called “backsplash population”, i.e. satellite galaxies that once were inside the virial radius of the host but now reside beyond it. We find that this population is significant in number and needs to be appreciated when interpreting the various galaxy morphology environmental relationships and decoupling the degeneracy between nature and nurture. Specifically, we find that approximately half of the galaxies with current clustercentric distance in the interval 1 – 2 virial radii of the host are backsplash galaxies which once penetrated deep into the cluster potential, with 90% of these entering to within 50% of the virial radius. These galaxies have undergone significant tidal disruption, loosing on average 40% of their mass. This results in a mass function for the backsplash population different to those galaxies infalling for the first time. We further show that these two populations are kinematically distinct and should be observable within existent spectroscopic surveys.
keywords:
galaxies: clusters – galaxies: formation – galaxies: evolution – n-body simulations1 Introduction
The relationship between galaxy morphology and local environment (i.e. the morphology-density relation) was first noticed by Hubble & Humason (1931), where they reported that field and cluster galaxy populations differ. Oemler (1974) extended this finding by showing that the relationship held for differing clusters richness. The field truly emerged when Dressler (1980) demonstrated the strong relationship over five orders of magnitude between the local density of galaxies and the proportions of different morphological types. Bhavsar (1981), de Souza et al. (1982), and Postman & Geller (1984) extended this work further to include the environments of both loose and compact groups. Recently, Aguerri et al. (2004) performed a thorough analysis of 116 bright galaxies in the Coma cluster, finding that bluer objects are located at larger projected radii while simultaneously showing a larger velocity dispersion than their red counterparts. Moreover, the bluest objects also host the most prominent disks contrary to systems observed close to the cluster centre or in high-density environments. Environmental dependence of galactic stellar populations is also seen in the Butcher-Oemler effect (Butcher & Oemler 1978, Kodama & Bower 2001) with clusters at higher redshifts showing a greater fraction of blue objects than are seen at present.
The above observational work supports the idea that galaxies in clusters are substantially different from galaxies in the field. But the origins of these morphology-density relationships are still not fully understood with several large and small scale mechanisms proposed to explain their existence, including ram pressure stripping (Gun & Gott 1972), tidal stripping/star formation (Merritt 1983, 1984), starvation (Larson, Tinsley & Caldwell 1980), galaxy merger and harassment (Icke 1985; Moore et al. 1996) and dynamics (Tsuchiya & Shimada 2000).
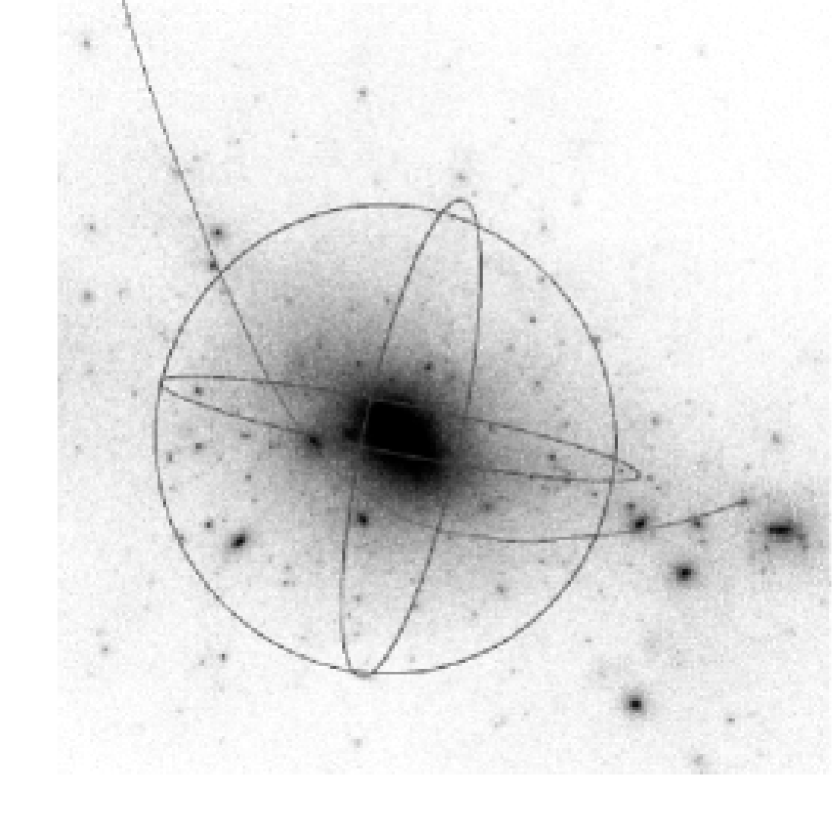
Recent cosmological simulations (both hydrodynamical and -body) have provided valuable insight into the mechanisms responsible for the morphology-density relationship (Springel et al. 2001; Goto et al. 2003; Okamoto & Nagashima 2003). In the analysis which follows, we focus on the dynamics of satellite galaxies taken from a series of high-resolution, fully self-consistent, cosmological simulations of eight galaxy clusters. We concentrate on the outskirts of these clusters, i.e. distances in the range , which (observationally) have only recently been probed through wide-field optical imaging and spectroscopy (Miyazaki et al. 2002; Lewis et al. 2002). We will demonstrate that a rich population of galaxies exist beyond the virial radius most of which have previously spent time near the cluster centre and can be seen in Figure 1. We characterise the spatial, velocity and mass properties of this population and contrast these with those of the spatially coincident newly infalling galaxies.
Our work complements the earlier studies of Balogh et al. (2000) and Mamon et al. (2004). Balogh et al. investigated the particle backsplash from cosmological simulations and found that 50 20% of the particles within had passed through the radius. Mamon et al. recently extended this work to calculate the maximum backsplash distance for particles to be and for galaxies .
The outline of the paper is as follows. Section 2 provides a description of the cosmological simulations employed. We investigate the number distribution of galaxies in the cluster outskirts in Section 3, with the mass distribution discussed in Section 4 and the velocity distribution of the satellites investigated in Section 5. We finish with our summary and conclusions in Section 6.
2 Simulation Details
Our analysis is based on a suite of eight high-resolution -body simulations (Gill, Knebe & Gibson 2004a) carried out using the publicly available adaptive mesh refinement code MLAPM (Knebe, Green & Binney 2001) in a standard CDM cosmology (). Each run focuses on the formation and evolution of a dark matter galaxy cluster containing of order one million particles, with mass resolution and force resolution 2 which is of the order 0.05% of the host’s virial radius. These simulations have the required resolution to follow the satellites within the very central regions of the host potential (5–10% of the virial radius) and the time resolution to resolve the satellite dynamics with good accuracy (170 Myrs). Such temporal resolution provides of order 10-20 timesteps per orbit per satellite galaxy, Thus allowing these simulations to be used in a previous paper Gill et al. (2004b) to accurately measure the orbital parameters of each individual satellite galaxy.
The clusters were chosen to sample a variety of environments and their details are summarised in (Gill, Knebe & Gibson 2004a). We define the virial radius as the point where the density of the host (measured in terms of the cosmological background density ) drops below the virial overdensity . is based upon the dissipationless spherical top-hat collapse model and is a function of both cosmological model and time. We further applied a lower mass cut for all the satellite galaxies used in this paper at (100 particles). For further specific details of the host halos such as masses and density profiles please refer to the earlier papers in the series (cf. Gill, Knebe & Gibson 2004a and Gill et al. 2004b).
For later reference and comparison to previous studies by Balogh et al. (2000) and Mamon et al. (2004) we relate to other definitions of the virial radius, namely and . According to the NFW profile (Navarro, Frenck & White 1997) the dark matter density in the outer regions of halos drops like and hence and .
3 Number distribution of galaxies in the cluster outskirts
The fact that galaxies in clusters are different from galaxies in the field has been attributed to a variety of mechanisms acting on a variety of scales. It has been suggested that galaxies can “rebound” up to (Mamon et al. 2004), thus blurring the definition of “cluster” and “field”. In this section we investigate cluster galaxy “backsplash”: how significant is the population of galaxies that once passed through a cluster’s virial radius but now resides in its outskirts?

In Figure 2 we plot for all of our eight simulated clusters the minimum distance a galaxy reached to the cluster centre throughout its history versus its current distance . Both distances have been normalised by the cluster’s present day virial radius . There are four distinct populations of satellites visible in this figure:
1. : (the infalling population)
These satellites are falling in for the first time.
2. and : (infalling sub-population)
This population is made up of subhalos orbiting satellites,
i.e. sub-subhalos.
3. and : (backsplash satellites)
These satellites once passed through the virial radius
of the respective host but have “rebound” to the outskirts
of the galaxy cluster.
4. and : (the bound population)
This is the “normal” satellite population orbiting within the virial radius and bound to the host.

Our data sets indicates that the maximum backsplash distance encountered is which is larger than the value presented in Mamon et al. (2004)111refer to Section 2 for conversion of to . yet not widely in disagreement, further very few backsplash galaxies exist beyond .
A more quantitative analysis reveals that 30% of all satellites with are outside the host’s virial radius at . Further, 50% of all galaxies with a current distance in the range are in fact backsplash galaxies, consistent with the value % quoted by Balogh et al. (2000) (based on cluster particles as opposed to gravitationally bound satellites though).
Only 2% of the backsplash population has had more than one orbit (i.e. eight satellites in total) and most stem from single passages through the host’s virial radius, respectively. And each of these eight “multiple passage” backsplash galaxies are found in the range [, 1.2] which is close to the host.
We now investigate the depth to which backsplash galaxies penetrate the cluster potential. To this extent we plot in Figure 3 the normalised number distribution of the minimum distance for the entire satellite population (thick histogram) and the restricted set of satellites currently outside the virial radius (thin histograms). It is interesting to note that the distributions are fairly similar for , i.e. they both peak near 0.25. We stress that this is the minimum distance as measured over the lifetime of the host halo and hence is not to be confused with the last pericentre whose distribution peaks at about 35% of (Gill et al. 2004b). Figure 3 reveals that the a number of the galaxies that are now in the outskirts of the cluster have had passages as close to the host as their bound counterparts which implies that the former are on highly radial orbits. This is consistent with the findings of Solanes et al. (2001) who found evidence that gas-poor spirals in HI deficient clusters move in orbits more radial than those of the gas-rich objects. In fact, 90% of our backsplash satellites once passed within the inner 50% of the virial radius.
In summary the number of backsplash galaxies is significant and should be accounted for when interpreting the galaxy morphology-density relationship. These galaxies penetrate deep within the cluster potential, as deep as their bound counterparts. Hence, they should be sampling the large and small-scale transformation mechanisms alluded to in Section 1. For example, if we used the prescriptions outlined in Treu et al. (2003), these galaxies would also have undergone starvation, ram pressure stripping, tidally triggered star formation and significant tidal stripping, thus confusing any correlation of the galaxy’s morphology with local environment.

4 Mass distribution of the galaxies in the cluster outskirts
One way to gauge the significance of these transformation mechanisms is to investigate the mass loss of a galaxy during its encounter with the cluster. To this extent we focus only on the backsplash population and plot the relative mass lost over the lifetime of the host as a function of minimum distance for each of these satellite in Figure 4. We find that the closer a satellite gets to the host the stronger the tidal stripping. This result is not surprising but needs to be viewed from the perspective of the backsplash population: galaxies in the outskirts experienced significant tidal interactions and mass loss, in some cases up to 80% of their original mass.
Further to that we see little dependence of present day clustercentric distance on the mass lost (not presented though). At all distances outside the virial radius the average mass lost for each backsplash galaxy is 40%.
Since the population of backsplash galaxies has undergone significant tidal stripping we expect the mass spectrum to be different from that of the galaxies infalling for the first time. In Figure 5 we plot the relative number distribution of satellites with a certain mass measured in terms of the host’s virial mass . The thin histogram represents the backsplash population and the thick histogram shows the infalling population. To better discriminate between these two populations we fitted the mass spectra to a simple power-law
| (1) |
There is a marginal difference between the slopes, the backsplash population having whereas the infalling satellites distribution is characterised by . The steeper slope of the backsplashed galaxies reflects the lack of larger satellites and an over-abundance of smaller galaxies, respectively. This tilt in the mass spectrum is readily explained by the mass loss highlighted in Figure 4. We note that the first mass bin was not used in fitting the power-law as it simply reflects the absolute mass cut of (i.e. we did not use a relative mass cut with respect to the mass of the host).

5 Velocity properties of galaxies in the cluster outskirts
To populate the outskirts of clusters, galaxies that once passed through the virial radius and close to the centre of the host must have had high velocities. In this section we explore the relative velocities of satellite galaxies within the cluster and its outskirts.
5.1 A kinematically distinct backsplash population
Figure 6 shows the absolute value of the relative velocity between a satellite galaxy and the host cluster as a function of current clustercentric distance. We present the results for two populations again, namely the infalling satellites that are still outside the virial radius (diamonds) and the backsplash galaxies alongside galaxies within the virial radius (crosses).

At the virial radius the maximum relative velocity for a galaxy in our data set is 1500 with no galaxy farther away having a greater velocity. This finding can be used to explore the two competing models for the ram-pressure stripping observed in NGC 4522, a spiral galaxy in the Virgo cluster with a distance close to the virial radius (Vollmer et al. 2001). Kenney et al. (2004) suggested two possible scenarios to explain its ongoing ICM-ISM stripping: either NGC 4522 is experiencing stripping at this distance due to bulk motions and local density enhancements of the ICM produced by shocks in the ICM, or – since ram-pressure stripping is proportional to – the galaxy has a very high relative velocity, of order 4000. As hinted by Kenney et al., such a velocity is extremely unlikely, and as shown in Figure 6 only in the very central regions of clusters do galaxies reach these high relative velocities.
Figure 6 furthermore shows that the backsplash population is quite distinct kinematically; the infalling satellites have significantly larger velocities than the backsplash galaxies. This provides a possible mechanism to observationally detect these rebound satellites.
To investigate this in more detail we divided all (infalling and backsplash) satellites into three radial bins between 1 and 2 . In Figure 7 we show the distribution of the relative velocities for all satellites in the respective bin (solid lines). The dotted (dashed) lines are for the backsplash (infalling) population alone, normalised to the total number of satellites (i.e. the actual distribution is simply the sum of these two distributions). From the distributions presented in Figure 7 it is rather obvious that the backsplash population should be detectable by simply plotting the velocity distribution function (VDF) for cluster galaxies in the range : there are two distinct peaks with the lower velocity peak indicative of the rebound satellites. Moreover, as we move further away from the host the separation between the two populations becomes even more pronounced.
One might still pose the question though, if the backsplash population can be identified by their “flight path”, i.e. the orientation of their velocity vector. In Table 1 we therefore summarise the numbers of backsplash galaxies moving towards (“approaching”) and away (“receding”) from the centre of the host. This demonstrates that the backsplash galaxies cannot simply be selected by the direction of their velocity as they appear to move in both directions. However, as distance increases we do find a higher percentage of backsplash galaxies moving away from the host.
| distance | receding galaxies | approaching galaxies |
|---|---|---|
| (1.00 - 1.33) | 102 | 106 |
| (1.33 - 1.67) | 87 | 57 |
| (1.67 - 2.00) | 47 | 22 |

5.2 Observational impact
Thus far, we have relied upon the fact that our simulation data provides full six dimensional velocity and spatial information. In this section we extend the velocity distribution function to the “observer’s plane” by restricting the data to projected distances and line-of-sight velocities; we make this transformation by placing the potential observer at infinity.
In Figure 8 we show the distribution of the line-of-sight velocities (still with respect to the host) for galaxies with projected distances between 1.0 and 2.0 virial radii. Velocities have also been convolved with a velocity uncertainty of 100, typical of that encountered in existing multi-object spectroscopic surveys such as the 2dFGRS (Colless et al. 2001). The dotted histogram shows the backsplash galaxies while the dashed histogram represents the infalling galaxies (both normalised to the total number of satellites). The solid histogram is the sum of both distributions.
Not surprisingly, this figure appears quite different from Figure 7 due to the loss of information when transforming from 6-dimensional space to 3-dimensional space. The kinematically distinct bimodal populations are no longer readily separable. However, if the backsplash population does not exist, one should simply observe the dashed histogram in Figure 8. The presence of a backsplash population “distorts” the Gaussian velocity distribution function such that it increases with decreasing line-of-sight velocity.
Figure 8 should now be comparable to extant cluster data sets such as the 2dFGRS (Lewis et al. 2002). Lewis et al. show VDFs for 17 clusters (of order 50 galaxies per cluster). Stacking the 17 cluster VDFs, eliminating all galaxies within the (projected) virial radius, should yield a composite 1–2 VDF with galaxies; such a composite VDF should either support or refute our predicted result (Figure 8). However, this is just a first step to a fair comparison. The next step would require colour, surface brightness and kinematic selection.

6 Conclusions
Observational data supports the idea that galaxies in clusters are substantially different from galaxies in the field. There is a clear correlation between galaxy morphology and density of the local environment. However, the origin of this relation is far from being understood.
In this study we have presented an analysis of satellite galaxies that once passed through the virial radius close to the centre of their respective host halo, but are now found outside the virial radius in the outskirts of the cluster. We have shown that this backsplash population is not negligible and needs to be accounted for when interpreting the various galaxy morphology relationships and decoupling the degeneracy between nature and nurture.
We must also appreciate that the infalling population is not expected to be pristine. Rather, we would expect that infall galaxies have undergone some sort of pre-processing in groups before entering the cluster too as indicated by the sub-subhalos in Figure 2.
Our results can be summarized as follows:
-
•
30% of all galaxies that ever came closer to the host than its virial radius are now located in the range [,2.5],
-
•
50% of all galaxies in the region [,2] are backsplash galaxies,
-
•
90% of the backsplash galaxies penetrated deeper than 50% of into the host’s potential,
-
•
during their passage through the cluster, on average the backsplash galaxies lose 40% of their mass, thus
-
•
the mass spectrum of the backsplash population has a steeper power-law slope than their infalling counterparts, thus it has fewer massive galaxies and more light ones,
-
•
the velocities of the infalling satellites is too small to account for ram-pressure stripping in the cluster outskirts,
-
•
the backsplash population has a factor of two smaller relative velocity than the infalling satellites, making it kinematically distinct.
When transforming the last result into the observers plane though, the velocity separation between the infalling and backsplash population is removed. However, the backsplash population should still be detectable as it is responsible for a continuous rise in the distribution function towards low line-of-sight velocities.
Our results suggest that we not only expect the backsplash population to experience various large-scale transformation mechanisms, but also small-scale ones, undergoing starvation, ram pressure stripping, tidally triggered star formation and significant tidal stripping.
7 Acknowledgments
SPDG wishes to thank Erica Ellingson and Bernard Vollmer for useful discussions. The simulations presented in this paper were carried out on the Beowulf cluster at the Centre for Astrophysics & Supercomputing, Swinburne University. The financial support of the Australian Research Council is also gratefully acknowledged. Finally, we wish to thank Michael Balogh for helpful correspondences.
References
- [Aguerri] Aguerri, J.A.L., Iglesias-Paramo, J., Vilchez J.M., Munoz-Tunon, C., 2004, ApJ, 127, 1344
- [Balogh] Balogh, M. L., Navarro, J. F., Morris, S.L., 2000, ApJ, 540, 113
- [Bahvsar] Bahvsar S., 1981, ApJ, 246, L5
- [Butcher] Butcher, H., Oemler, A., 1978, ApJ, 226, 559
- [Colless] Colless M., et al. 2001, MNRAS, 328, 1039
- [deSouza] de Souza R.E., Capelato H.V., Arakaki L., Logullo C., 1982, ApJ, 263, 557
- [Dressler] Dressler A., 1980, ApJ, 236, 351
- [Gill1] Gill, S.P.D., Knebe, A., Gibson, B.K., 2004a, MNRAS, in press
- [Gill2] Gill, S.P.D., Knebe, A., Gibson, B.K., Dopita, M. A.., 2004b, MNRAS, in press
- [Goto] Goto, T., Yamauchi, C., Fujita, Y., Okamura, S., Sekiguchi, M., Smail, I., Bernardi, M., Gomez, P., 2003, MNRAS, 346, 601
- [Gunn] Gunn, J.E. & Gott, R.J., 1972, ApJ, 176, 1
- [Hubble] Hubble E., Humason M.L., 1931, ApJ, 74, 43
- [Icke] Icke V., 1985, A&A, 144, 115
- [Kenney] Kenney, J. D. P., van Gorkom, J. H., Vollmer, B., astro-ph/0403103, 2004, accepted for ApJ
- [Kodama] Kodama, T., Bower, R. G., 2001, MNRAS, 321, 18
- [knebe01] Knebe A., Green A., Binney J., 2001, MNRAS, 325, 845
- [Lacey] Lacey, C., Cole, S., 1996, MNRAS, 281, 716
- [Larson] Larson, R. B., Tinsley, B. M., & Caldwell, C. N., 1980, ApJ, 237, 692
- [Lewis] Lewis I., et al. 2002, MNRAS, 334, 673
- [Mamon] Mamon, G. A., Sanchis, T., Salvador-Sole, E., Solanes, M. J., 2004, A&A, 414, 445
- [Merritt1] Merritt, D., 1983, ApJ, 264, 24
- [Merritt2] Merritt, D., 1984, ApJ, 276, 26
- [Miyazaki] Miyazaki, S., et al. 2002, PASJ, 54, 833
- [Moore] Moore, B., Katz, N., Lake, G., Dressler, A., & Oemler, A., 1996, Nature, 379, 613
- [nfw] Navarro J., Frenk C.S., White S.D.M., 1997, ApJ, 490, 493 (NFW)
- [Oemler] Oemler A., 1974, ApJ, 194, 1
- [Okamoto] Okamoto T., Nagashima M., 2003, ApJ, 587, 500
- [Postman] Postman M., Geller M.J., 1984, ApJ, 281, 95
- [Solanes] Solanes, J. M., Manrique, A., Garcia-Gomez, C., Gonzalez-Casado, G., Giovanelli, R., Haynes, M. P., 2001, ApJ, 548, 97
- [Springel] Springel, V., White, S.D.M., Tormen, G., Kauffmann, G., 2001, MNRAS, 328, 726
- [Treu] Treu, T., Ellis, R., Kneib, J., Dressler, A., Smail, I., Czoske, O., 2003, ApJ, 591, 53
- [Tsuchiya] Tsuchiya, T., Shimada, M., 2000, ApJ, 532, 294
- [Vollmer] Vollmer, B., Braine, J., Balkowski, C., Cayatte, V., Duschl, W. J., 2001‘, A&A, 374, 824