CIRPASS near-infrared integral-field spectroscopy of massive star clusters in the starburst galaxy NGC 1140
Abstract
We analyse near-infrared integral field spectroscopy of the central
starburst region of NGC 1140, obtained at the Gemini-South telescope
equipped with CIRPASS. Our m wavelength coverage
includes the bright [Fe ii]m emission line, as
well as high-order Brackett (hydrogen) lines. While strong [Fe ii] emission, thought to originate in the thermal shocks associated
with supernova remnants, is found throughout the galaxy, both Br 12–4
and Br 14–4 emission, and weak CO(6,3) absorption, is predominantly
associated with the northern starburst region. The Brackett lines
originate from recombination processes occurring on smaller scales in
(young) Hii regions. The time-scale associated with strong [Fe
ii] emission implies that most of the recent star-formation
activity in NGC 1140 was induced in the past Myr. Based
on the spatial distributions of the [Fe ii] versus Brackett line
emission, we conclude that a galaxy-wide starburst was induced several
tens of Myr ago, with more recent starburst activity concentrated
around the northern starburst region.
This scenario is (provisionally) confirmed by our analysis of the
spectral energy distributions of the compact, young massive star
clusters (YMCs) detected in new and archival broad-band Hubble
Space Telescope images. The YMC ages in NGC 1140 are all Myr, consistent with independently determined estimates of the
galaxy’s starburst age, while there appears to be an age difference
between the northern and southern YMC complexes in the sense expected
from our CIRPASS analysis. Our photometric mass estimates of the NGC
1140 YMCs, likely upper limits, are comparable to those of the
highest-mass Galactic globular clusters and to spectroscopically
confirmed masses of (compact) YMCs in other starburst galaxies. Our
detection of similarly massive YMCs in NGC 1140 supports the scenario
that such objects form preferentially in the extreme environments of
interacting and starburst galaxies.
keywords:
galaxies: individual: NGC 1140 – galaxies: starburst – galaxies: star clusters – infrared: galaxies1 Introduction
The southern starburst dwarf galaxy NGC 1140 (Mrk 1063) is remarkable in the number of compact, young, massive star clusters (YMCs) that it has formed recently in the small volume of its bright emission-line core (roughly pc at the galaxy’s distance111based on the galaxy’s heliocentric velocity, corrected for the Virgocentric flow, and assuming H km s-1 Mpc-1; adopted from the HyperLeda database at http://www.univ-lyon1.fr/ of mag or Mpc). Based on Hi and optical observations, and comparison with models (Hunter, van Woerden & Gallagher 1994b, hereafter H94b), it exhibits the characteristics of a recent merger event, which has presumably induced the YMC formation in its centre; the galaxy is unusually bright (; de Vaucouleurs et al. 1991, hereafter RC3) for its dwarf (or amorphous) morphological type, and shows low-level shells and filaments in its Hi distribution (H94b), which are presumably remnants of a past interaction. Within 3.3 Holmberg radii , the radius where the V-band surface brightness reaches mag arcsec-2; at mag arcsec-2 the galaxy measures about kpc), it contains a total mass of , based on its Hi rotation curve; of this mass is in the form of Hi. The total mass contained within is (H94b).
The formation of compact YMCs seems to be a key feature of intense episodes of recent, active star formation. They have been identified, mostly with the Hubble Space Telescope (HST), in several dozen galaxies, often interacting or undergoing active starbursts (see, e.g., Holtzman et al. 1992, O’Connell, Gallagher & Hunter 1994, de Grijs, O’Connell & Gallagher 2001, Whitmore 2003, and references therein). Their sizes, luminosities, and masses – usually based on broad-band optical observations – are generally consistent with theoretical expectations for young globular clusters (see also de Grijs, Bastian & Lamers 2003b). However, they cover a wide range of masses and luminosities, and also include those of the most extreme supermassive and superluminous clusters. YMCs are also important as probes of their host galaxy’s star formation history, its chemical evolution, the stellar initial mass function (IMF), and other physical characteristics in starbursts. This is so because each cluster approximates a coeval, single-metallicity, simple stellar population. Such systems are among the simplest to model, and their ages and metallicities and, in some cases, IMFs can be estimated from their integrated spectra (Ho & Filippenko 1996a,b, Gallagher & Smith 1999, Smith & Gallagher 2001, Mengel et al. 2002).
1.1 NGC 1140: A disturbed appearance across the board
Observations in optical broad-band, H narrow-band, and the Hi radio continuum are consistent with the interpretation that NGC 1140 is in the final stages of a galactic merger (e.g., Hunter et al. 1994a, hereafter H94a; H94b). At faint optical light levels it shows multiple, misaligned shell-like structures. These are reminiscent of the shells associated with some elliptical galaxies that are thought to be remnants of a past tidal encounter (e.g., Schweizer & Seitzer 1988, Hernquist & Spergel 1992). The galaxy is also unusual in its content and overall morphology: its optical appearance is dominated by a supergiant Hii region encompassing most of its centre, with an H luminosity equivalent to that produced by OB stars (H94a), far exceeding that of the giant Hii region 30 Doradus in the Large Magellanic Cloud (LMC; H94b). Its gas fraction, gas-to-luminosity ratio, and Hi velocity dispersion are unusually high, and its H velocity profiles remarkably broad, by roughly an order of magnitude, for the mid-spiral type galaxy one would expect, based on its total mass (H94b). Although NGC 1140 has a small dwarf companion galaxy (which might suggest that gravitational interactions with this companion may have induced part of the recent active star cluster formation), these observations led H94b to conclude that the galaxy is most likely the product of the accretion of a low surface brightness gas-rich companion by a relatively normal mid-type spiral galaxy of roughly equal mass in the last Gyr. This picture is consistent with the low metallicities (see Section 4.1) and complex Hi morphology (including a warped disc) and velocity field.
1.2 The massive star cluster population
The presence and characteristics of the central supergiant Hii region in NGC 1140 are consistent with simple conceptual models of enhanced central star formation associated with a tidal encounter (see H94b). Its core contains six blue, very luminous compact YMCs222H94a show convincingly that these objects are much more likely to be YMCs than either luminous red supergiants or objects similar to the most luminous unstable stars – with ages Myr (H94a) – such as commonly found in regions of intense star formation. These are comparable to or brighter than Galactic globular clusters (GCs) at similar ages, and thought to be entirely responsible for the ionisation of the supergiant Hii region in NGC 1140 (H94a). It appears that most of the recent star formation in NGC 1140 has occurred in, or is associated with, the YMCs: while its overall average recent star formation rate, yr-1 (based on a variety of tracers of the recent star formation rate and depending on – among others – the slope and high-mass cut-off assumed for the IMF; e.g., Storchi-Bergmann, Calzetti & Kinney 1994, H94b, Calzetti 1997, Takagi, Arimoto & Hanami 2003), is similar to the equivalent rates of the significantly more massive giant irregular and spiral galaxies, the average recent star formation rate in the YMCs alone is implied to be near 1 M⊙ yr-1 (H94a), if their IMFs are similar to the solar neighbourhood IMF.
In Section 2 we describe in detail both the broad-band HST imaging observations of the few dozen compact YMCs (i.e., the six very bright clusters discussed above, in addition to a larger population of less luminous compact star clusters) in NGC 1140’s central starburst, and our near-infrared (NIR) integral-field spectroscopy. We then apply sophisticated age dating techniques to the HST observations in Section 4 and discuss the spectroscopic evidence for a possible age gradient (see Section 3). These results are discussed in the context of NGC 1140’s recent star formation history and its current supernova rate (SNR) in Sections 5 and 6, respectively, upon which we summarise our main results and conclusions in Section 7.
2 Observations and data reduction
2.1 Spectroscopy
The H-band spectroscopy of NGC 1140 was performed with the Cambridge Infrared Panoramic Survey Spectrograph (CIRPASS; Parry et al. 2000) at the f/16 focus on the 8-m Gemini-South telescope, at Cerro Pachon in Chile. CIRPASS is a NIR fibre-fed spectrograph, connected to a 490-element integral field unit (IFU). The variable lenslet scale was set to 0.36 arcsec diameter, and the hexagonal lenslets are arranged in the IFU to survey an approximately rectangular area of arcsec, which provides sufficient sampling of the unusually bright diffuse light in NGC 1140. The detector is a 1k1k Hawaii-I HgCdTe Rockwell array. CIRPASS can operate in the range m (but with best results in the range m), and a 400l/mm grating was used which produced a dispersion of 2.25Å pixel-1 and a coverage of m for each grating setting.
The grating was tilted to place the wavelength range m on the detector, covering most of the H-band transmission window. A filter at m blocked out redder wavelengths to reduce the dominant NIR background contribution. The detector pixels do not quite critically sample the spectral resolution (unresolved sky lines have FWHM = 1.7 pixels, or 3.8Å), and the resolving power is .
The observations were made on the night of UT 6 August 2002 during the Director’s discretionary time instrument commissioning/IFU-demonstration science on Gemini-South. The observations were taken in non-photometric conditions, with a seeing of arcsec FWHM, and spanned the airmass range .
We obtained three 40-minute exposures of the galaxy, and one 40-minute offset sky exposure (offset by 200 arcsec). The long axis of the IFU was aligned along a north–south axis. In between each of the individual 40-minute exposures, we dithered by 2 lenses, or arcsec. Although we had noticed that our last 40-minute exposure was affected by high winds (and therefore blurred), during the analysis stage we found that the guiding of one of the other exposures had experienced problems as well due to wind shake. Thus, the CIRPASS results discussed in this paper are based on the single 40-minute exposure obtained under the best available conditions.
For each individual integration of 40 minutes per pointing, the array was read out non-destructively every 10 minutes (i.e., 5 times per pointing, including an initial read to reset the detector). Each of these “loops” comprised 10 multiple reads of the detector, which were averaged to reduce the read-out noise (30- per read) by . The average of each loop was subtracted from the average of the next loop of non-destructive reads, to form 4 sub-integrations of 10 minutes at the same telescope pointing. Comparison of these sub-integrations enabled cosmic ray strikes to be flagged, and a combined frame of 40 minutes was produced by summing the four sub-integrations, ignoring pixels affected by cosmic rays. An initial subtraction of sky and dark current was performed using the offset sky frame. Known bad pixels were also interpolated at this stage.
The 490 fibres span the 1k detector, with pixels per fibre. A lamp was used to illuminate 10 calibration fibres immediately before the observations, in order to accurately determine the position of the fibres on the array and to focus the spectrograph at the desired wavelength range. There is significant cross-talk between adjacent fibres and we use an optimal-extraction routine333The CIRPASS data reduction software is available from http://www.ast.cam.ac.uk/optics/cirpass/docs.html (R.A. Johnson et al., in prep.) to determine the spectrum of each fibre, thereby for each pixel on the array solving the contribution of flux from adjacent fibres.
Immediately after the science integrations, spectral flat fields were obtained (by means of exposures of the illuminated dome), and these were also optimally extracted and their average flux normalised to unity. The extracted science data was then flat-fielded through division by the extracted normalised dome lamp spectra, thus calibrating the response of each individual fibre.
Wavelength calibration was achieved by matching the OH lines in the sky exposure with the calibrated sky lines in the Maihara et al. (1993) atlas. Again, the individual fibre spectra were optimally extracted, and for each fibre a cubic fit was performed to the centroids of the dozen brightest telluric OH lines, leaving r.m.s. residuals of 0.2Å. The 490 fibre spectra stacked on the slit were rectified (mapped to the same wavelength) with a fifth-order polynomial transformation in (i.e., along the wavelength axis) and (because the wavelength distortion changes as a function of fibre position). This transformation was applied to the sky-subtracted, extracted, flat-fielded science frames. A higher-order background subtraction was then applied to the rectified data, to remove sky residuals from the beam switching caused by variation in the OH-line intensity. The individual rectified, background-subtracted fibre spectra composing the two-dimensional (2D) intermediate spectrum partially shown in Fig. 3 (in Section 3 below), were subsequently rearranged into their physical positions in 2D on the sky. Because of the hexagonal close packing arrangement of the lenslets, alternate rows are offset by half a lens: in making the cubes this was accounted for by regridding each lenslet by two in the spatial dimensions (i.e. each lenslet is 2x2 sub-pixels of diameter 0.18 arcsec).
Although the conditions were non-photometric, relative flux calibration was obtained through observations of the standard star HIP105206 ( mag), taken on a different (photometric) night at similar airmass. The standard star spectrum was reduced in the same way as the science data, and the total flux was obtained by summing lenslets (1.5 arcsec diameter). The spectral type of this star (A1V) meant that it had few stellar features, so normalisation through division by an appropriate black body (normalised to the H-band magnitude) provided a flux calibration, and corrected for the atmospheric absorption.444We note that early A-type stars are characterised by deep Brackett absorption lines, although a suitable black-body spectrum is adequate to describe the stellar spectrum’s overall shape, and thus to provide a general relative flux calibration. One potential problem associated with the standard star’s fairly broad Brackett absorption lines is that using it for flux calibration may introduce artificial emission lines in our galaxy spectra. Therefore, we masked out the spectral regions affected by the Brackett (and helium) absorption lines and replaced these by sections of the appropriate black-body spectrum, before applying our flux calibration. The total effective throughput was determined to be per cent on the sky for the middle of the H band. Since our observations were taken under non-photometric conditions, this essentially implies that we can at best obtain lower limits to the derived fluxes.
2.2 Imaging
As part of HST programme GO-8645, we obtained observations of NGC 1140 through the F300W (“UV”) and F814W (I ) filters (Windhorst et al. 2002), with the galaxy centre located on chip 3 of the Wide Field Planetary Camera 2 (WFPC2). Observations in the F336W (U ), F555W (V ) and F785LP (broad I) passbands, obtained with the Wide Field/Planetary Camera (WF/PC; PC, chip 5), i.e., prior to the first HST refurbishment mission, were retrieved from the HST Data Archive. We have summarised our combined set of broad-band HST observations in Table 1.
| Filter | Exposure time | Centrea | PIDb | ORIENTc |
|---|---|---|---|---|
| (sec) | (∘) | |||
| F300W | 1800 | WF3 | 8645 | 71.93 |
| F336W | 2350, 1200, 1400 | PC1 | 2389 | 68.88 |
| F555W | 2100, 2400 | PC1 | 2389 | 68.88 |
| F785LP | 60, 2230 | PC1 | 2389 | 68.88 |
| F814W | 200 | WF3 | 8645 | 71.93 |
Notes: a – Location of the galactic centre; b – HST programme identifier; c – Orientation of the images (taken from the image header), measured North through East with respect to the V3 axis (i.e., the X=Y diagonal of the WF3 CCD ).
Pipeline image reduction and calibration of the WF/PC and WFPC2 images were done with standard procedures provided as part of the iraf/stsdas555The Image Reduction and Analysis Facility (IRAF) is distributed by the National Optical Astronomy Observatories, which is operated by the Association of Universities for Research in Astronomy, Inc., under cooperative agreement with the National Science Foundation. stsdas, the Space Telescope Science Data Analysis System, contains tasks complementary to the existing iraf tasks. We used Version 3.0 (August 2002) for the data reduction performed in this paper. package, using the updated and corrected on-orbit flat fields and related reference files most appropriate for the observations.
Our selection of the (compact) YMC sample in NGC 1140’s central starburst is limited by the WF/PC image quality. We therefore start with the H94a sample of 14 objects, of which objects [H94a]1–9 and 14 are also found on the WFPC2 field of view (FoV; see Fig. 1 for the cluster identifications). Careful comparison of the WFPC2 and WF/PC images reveals five additional fainter, but well-defined cluster-type objects, subsequently referred to as objects 15 – 19. The coordinates of all objects in common on the WF/PC and WFPC2 FoVs are listed in Table 2, and shown in Fig. 1.
| IDa | R.A. (J2000) | Dec. (J2000) | |||||
|---|---|---|---|---|---|---|---|
| (h mm ss.sss) | (dd mm ss.ss) | (mag) | (mag) | (mag) | (mag) | (mag) | |
| 1+2+3 | 2 54 33.079 | 10 01 39.66 | 16.26 0.02 | 16.72 0.02 | 17.45 0.02 | 17.33 0.03 | 18.94 0.04 |
| 1 | 33.057 | 39.38 | 16.50 0.05 | 17.07 0.02 | 17.93 0.02 | 17.99 0.03 | 18.51 0.05 |
| 2 | 33.072 | 39.62 | 16.37 0.03 | 18.17 0.04 | 19.25 0.06 | 19.48 0.16 | 19.11 0.08 |
| 4 | 33.075 | 40.63 | 17.65 0.05 | 19.68 0.13 | 20.19 0.08 | 20.13 0.07 | 19.66 0.07 |
| 5 | 33.073 | 42.10 | 17.92 0.05 | 18.90 0.06 | 20.18 0.14 | 19.51 0.15 | 20.03 0.13 |
| 6+7 | 33.056 | 42.92 | 18.08 0.09 | 18.91 0.08 | 18.26 0.03 | 17.45 0.02 | 18.17 0.03 |
| 6 | 33.058 | 42.67 | 18.47 0.09 | 19.47 0.07 | 18.76 0.02 | 17.96 0.02 | 18.73 0.03 |
| 7 | 33.069 | 42.95 | 21.71 1.51 | 20.23 0.13 | 19.81 0.06 | 19.03 0.06 | 19.86 0.04 |
| 8 | 32.250 | 56.71 | 22.99 0.23 | 21.34 0.44 | 21.63 0.26 | 20.56 0.09 | 21.30 0.03 |
| 9 | 32.930 | 29.64 | 20.07 0.04 | 20.81 0.18 | 20.95 0.10 | 20.52 0.07 | 20.85 0.03 |
| 14 | 34.758 | 35.87 | 22.43 0.18 | 18.55 0.02 | 20.30 0.02 | ||
| 15 | 33.179 | 18.31 | 20.77 0.05 | 20.04 0.02 | |||
| 16 | 33.072 | 41.38 | 19.76 0.41 | 21.38 0.34 | |||
| 17 | 32.968 | 36.24 | 22.31 0.52 | 20.40 0.14 | 21.73 0.18 | 20.97 0.14 | 21.69 0.11 |
| 18 | 33.058 | 36.14 | 20.20 0.12 | 23.82 2.76 | 21.88 0.22 | 20.87 0.15 | 20.29 0.05 |
| 19 | 33.127 | 34.66 | 20.12 0.09 | 20.72 0.14 | 21.51 0.15 | 20.73 0.10 | 21.51 0.11 |
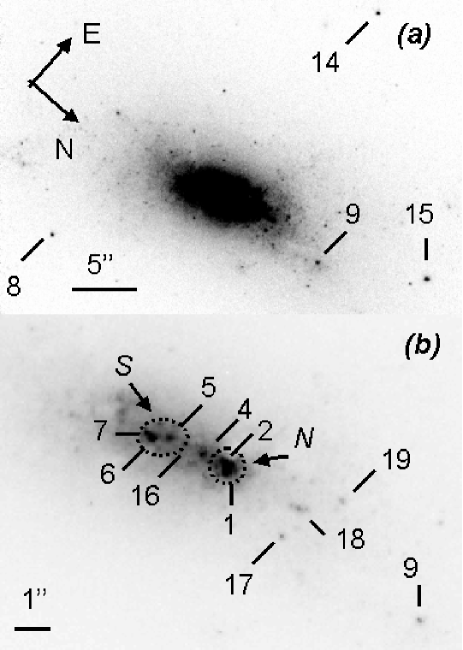
We obtained daophot aperture photometry for all of the objects in Table 2, in all passbands. The correct choice of source and background aperture sizes is critical for the quality of the resulting photometry. Due to the varying source separations and background flux levels, we concluded that we had to assign apertures for source flux and background level determination individually to each cluster candidate by visual inspection. Our photometry includes most, if not all, of the light of each YMC/star-forming region. At the distance of NGC 1140, an aperture of radius 4 – 7 pixels ( arcsec) corresponds to a projected linear diameter of pc. Compact YMCs (as well as Galactic GCs) are characterised by effective radii of pc (see, e.g., de Grijs et al. 2001, Whitmore 2003, and references therein), so that such objects would appear as point sources in our NGC 1140 images. Therefore, we applied point-source aperture corrections to our photometry, based on comparisons with artificial PSFs generated using the Tiny Tim software package (Version 6.1, 6 May 2003; Krist & Hook 2003).
The photometric calibration, i.e., the conversion of the instrumental aperture magnitudes, thus obtained, to the HST-flight system (stmag), was done by simply using the appropriate zero-point offsets for each of the individual passbands, after correcting the instrumental magnitudes for geometric distortions, charge transfer (in)efficiency effects, and the exposure times (see de Grijs et al. [2002] for an outline of the data reduction procedures). The resulting stmag magnitudes for our objects are also listed in Table 2. The uncertainties are the formal uncertainties, including those due to variations in the background annuli and Poisson-type noise.
Special care needs to be taken when calibrating the F300W and F336W aperture magnitudes. These filters suffer from significant “red leaks” (Biretta et al. 2000, chapter 3). Fortunately, the response curve of the F300W red-leak region resembles the transmission curve of the F814W filter, being most dominant in the Å range; the red leak of the F336W filter is roughly similar to the red half of the F814W filter response function. This implies that we can use our F814W observations to correct, to zeroth order, the F300W and F336W fluxes for red-leak contamination. For starburst galaxies dominated by young hot stellar populations the red-leak contamination should be almost negligible (Biretta et al. 2000). Adopting Eskridge et al.’s (2002) most straightforward assumption, i.e., that the red leak cannot account for any more than all of the counts in any given area of a few pixels in the F300W and/or F336W images, we derive a maximum contribution of the red leak in NGC 1140 to both the F300W and the F336W filters of per cent of the total count rates in the respective images. We applied these corrections to the F300W and F336W images before obtaining the aperture photometry.
In Fig. 2 we compare our calibrated aperture-corrected WF/PC photometry with the previously published stmag values of H94a (representing the objects’ total fluxes). H94a decided to exclude the F336W images from their analysis because of (i) the fairly low exposure levels compared to their longer-wavelength observations, and (ii) the filter’s potentially serious red leak for which they could not correct. While our F555W and F785LP magnitudes for the objects in common generally match theirs relatively closely (the r.m.s. difference in both the F555W and the F785LP filters is 0.22 mag), there is some dependence on the choice of our apertures, in particular for the F555W magnitudes. The slight dependence of the relationship between aperture size and magnitude difference implies either that we may have somewhat underestimated our point-source aperture corrections compared to the PSF fits of H94a, or that some of the objects might be marginally extended star-forming regions rather than individual YMCs (see Section 4.2 for a discussion of the relevant implications for our results if this were the case), or a combination of both. Some of the scatter in the data points, however, is caused by H94a’s choice of background annulus (8 – 15 pixels), which is not in all cases appropriate in view of the object density in the galaxy’s central starburst region. In our re-analysis of the WF/PC images we have taken great care to include as much of the source flux as practically possible without being affected significantly by neighbouring objects or background fluctuations, and to select suitable background annuli, on a per-object basis.

3 CIRPASS spectroscopy of the central starburst
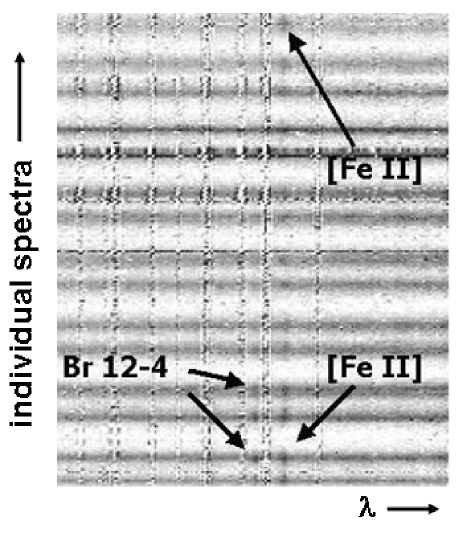
The wavelength range from m covers a number of emission lines expected to be strong in star-forming areas and active starburst regions. Despite the strong OH emission lines affecting this section of the H band (with origins in the Earth’s atmosphere), we identified four strong emission lines in a significant fraction of the lenslets covering the NGC 1140 starburst, three of which were located in spectral regions well away from the sky lines, and clearly resolved. This is largely thanks to the relatively high spectral resolution of the CIRPASS instrument. In addition to strong [Fe ii] emission (at m), we also detect three high-order Brackett (hydrogen) lines, Br 12–4 (m), Br 13–4 (m) and Br 14–4 (m). However, the Br 13–4 flux is significantly compromised by a nearby strong sky line. In Fig. 3 we show a small section of our final, reduced set of spectra, including the [Fe ii] and Br 12–4 lines, using an inverted look-up table to emphasize the emission lines; in Fig. 4 we show the integrated spectra of both starburst regions in a more traditional way, combining 24 and 17 individual CIRPASS lenses for the spectra of regions NGC 1140-N and S, respectively. The [Fe ii] line on the one hand, and the high-order Brackett lines on the other arise through different physical mechanisms (see Section 5.1 for a full discussion). We also detect a weak absorption feature at the wavelength range expected for the CO(6,3) band head (at m, after correcting for the galaxy’s redshift), in the most active starburst regions, in particular in NGC 1140-N. In this northern starburst region, we measure an equivalent width (EW) of the CO feature of Å (using the Origlia, Moorwood & Oliva [1993] models as our template), which we consider a reasonably robust measurement despite the poor signal-to-noise (S/N) ratio. In the southern starburst region, the continuum was detected but the S/N ratio was not sufficient for reliable absorption-line studies, or EW measurements. In addition, there is a lack of theoretical analyses of the H-band CO feature at the spectral resolution offered by CIRPASS. This therefore presents a good case for follow-up spectroscopy in the K band, where the CO features are much stronger.
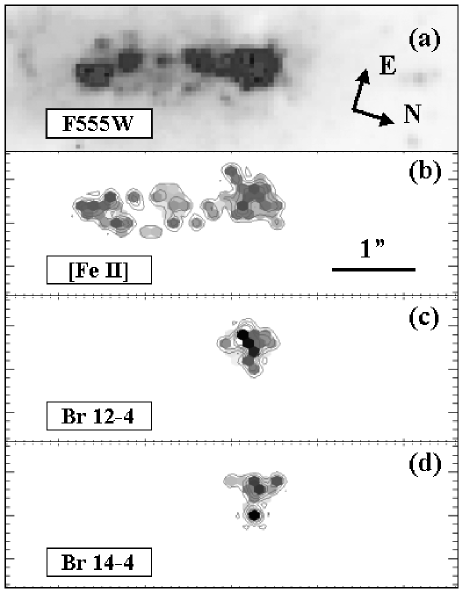
In Fig. 5 we show the flux distribution of the [Fe ii], Br 12–4 and Br 14–4 emission lines across the face of NGC 1140, compared to the higher resolution HST F814W morphology. The flux distribution of the [Fe ii] line is clearly more extended than those of the Brackett lines. While [Fe ii] emission is found throughout the galaxy, the emission from all of the high-order Brackett lines (including Br 12–4, Br 13–4 and Br 14–4) is found predominantly associated with the northern starburst region, including the compact YMCs [H94a]1–3. We will refer to the southern and northern starburst areas, traced in turn by the [Fe ii] emission and by both the [Fe ii] and Br lines, as NGC 1140-S and N, respectively. These two starburst regions include clusters [H94a]5–7 and [H94a]1–3, respectively. Our flux measurements – and other spectral features – associated with these regions are based on the composite properties of the 17 and 24 individual CIRPASS lenses centred on the peak of the [Fe ii] emission in regions S and N, respectively. The morphologies of the lines’ EWs and FWHMs show a similar, and consistent, picture; the largest EWs and FWHMs are found coincident with the highest intensities (see Table 4 for the relevant flux and EW measurements). Although the observing conditions under which the CIRPASS data were obtained were non-photometric, the fact that we observe all wavelengths simultaneously over the entire 2D FoV enables us to say with confidence that this different spatial distribution is real. This is one of the major advantages of using IFUs.
By (median) combining the [Fe ii] flux in the starburst regions NGC 1140-S and N, we find and 16520.5Å, respectively, and respective composite EWs for these regions of EW and 4Å; the uncertainties in the line centres and line widths are both Å, while the uncertainties in the EW measurements are on the order of 30 per cent. The mean of the [Fe ii] line centres corresponds to a NIR redshift for the galaxy of or, equivalently, a heliocentric radial velocity of km s-1 (where the uncertainty includes both the difference in the line centres between the northern and southern starburst regions, and also the uncertainty in the actual line centre mesurements), which is in the same range as the most recent optical redshift measurements (e.g., , Dahari 1985; km s-1, RC3), and slightly lower than recent measurements based on Hi 21cm data (e.g., km s-1, RC3; km s-1, Haynes et al. 1998). The composite Br 12–4 and Br 14–4 lines in NGC 1140-N are centred on (Br 12–4) = 16491.5Å and (Br 14–4) = 15962.0Å, respectively. This corresponds to redshift measurements of and for Br 12–4 and Br 14–4 in this region, respectively. The maximum offset associated with bulk peculiar motions in the gas is km s-1.
The overall Br 14–4 to Br 12–4 flux ratio in the most active extended starburst region, NGC 1140-N, is Br 14–4Br 12–4 (where the individual flux measurements are in units of erg s; see Table 4), with an uncertainty of roughly 50 per cent because of the low S/N ratio of both emission lines outside the very core of region N, in particular for Br 14–4; the likely total systematic uncertainties in the individual measurements (caused by both calibration and random uncertainties) are on the order of 30 per cent. This line ratio is, within the uncertainties, comparable to the theoretical predictions of Hummer & Storey (1987) for Case B recombination physics, who – for a range of electron densities and temperatures – calculate line ratios upward of 0.6 for these transitions.


4 Star cluster properties revealed by the Hubble Space Telescope
4.1 Technique and main results
In Anders et al. (2004a; see applications in Anders et al. [2004b] and de Grijs et al. [2003c]) we developed a reliable method to determine cluster ages (in the range from a few to a few yr), masses, metallicities and extinction values robustly and simultaneously based on high-resolution HST/WFPC2 imaging observations in a minimum of four broad-band passbands covering the entire optical wavelength range from the UV/U to the I band (and preferably extending to the NIR) or their equivalents in non-standard passband systems (see also de Grijs et al. [2003a], in particular for a discussion on the systematic uncertainties involved in estimating the individual YMC metallicities). We tested our method using both artificial star clusters of various ages (Anders et al. 2004a) and also by using the young clusters in the centre of the nearby starburst galaxy NGC 3310, and confirmed the previously suggested starburst scenario in that galaxy (de Grijs et al. 2003c). By combining our new WFPC2 observations with the archival WF/PC data, we span at least as long a wavelength range with adequate passband separation, although the WF/PC spatial resolution is significantly poorer than that of WFPC2.
With the lessons learnt from Anders et al. (2004a) and de Grijs et al. (2003a,c) in mind, in particular regarding the systematic uncertainties involved in using broad-band SEDs to obtain individual YMC properties, we applied a similar three-dimensional (3D) minimisation to the SEDs of our NGC 1140 YMCs and star-forming complexes. The minimisation was done with respect to the Anders & Fritze–v. Alvensleben (2003) simple stellar population (SSP) models, which include the contributions of an exhaustive set of nebular emission lines and gaseous continuum emission, shown to be important during the first few yr, depending on the metallicity assumed. We thus obtained, for each individual object, the most likely combination of age, mass, and internal extinction, E. For our mass estimates we assumed a Salpeter-type IMF with a lower-mass cut-off around 0.08 M⊙ and an upper mass cut-off between 50 and 70 M⊙, the exact mass depending on the cluster’s metallicity, as provided by the Padova isochrones used for our SSP comparison (see in particular Schulz et al. 2002 and Anders et al. 2004a).
We realise that recent determinations of the stellar IMF deviate significantly from a Salpeter-type IMF at low masses, in the sense that the low-mass stellar IMF is significantly flatter than the Salpeter slope. The implication of using a Salpeter-type IMF for our cluster mass determinations is therefore that we have overestimated the individual cluster masses (although the relative mass distribution of our entire cluster sample remains unaffected). Therefore, we used the more modern IMF of Kroupa, Tout & Gilmore (1993) to determine the correction factor, , between our masses and the more realistic masses obtained from the Kroupa et al. (1993) IMF (both normalised at ). This IMF is characterised by slopes of for , for , and for . Depending on the adopted slope for the lowest mass range, we have therefore overestimated our individual cluster masses by a factor of for an IMF containing stellar masses in the range .
The internal extinction was modelled assuming a Calzetti et al. (2000) starburst galaxy-type extinction law666We realise that an LMC-type extinction law is more appropriate for compact cluster-like objects in starburst galaxies than the Calzetti et al. (2000) law, which applies to more extended starburst regions, but note that the differences between both laws are smaller than the combined observational and model uncertainties over the wavelength range covered by our HST observations.; we adopted an extinction resolution of E mag. Galactic foreground extinction toward NGC 1140 is estimated at mag, or E mag (Schlegel, Finkbeiner & Davis 1998), and was corrected for using a standard Galactic extinction law.
Independently measured metallicities for the compact NGC 1140 YMCs have not been published, but recent metallicity estimates for the galaxy’s ISM, based on oxygen abundances, , range from (Stasińska, Comte & Vigroux 1986, Marconi, Matteucci & Tosi 1994, Heckman et al. 1998) to (Storchi-Bergmann et al. 1994, Calzetti 1997, Guseva, Izotov & Thuan 2000). With a solar oxygen abundance of (Allende Prieto, Lambert & Asplund 2001), this translates to .
Because of (i) the very significant effects in UV and optical passbands of the age–metallicity degeneracy for the very young ages expected (de Grijs et al. 2003a,c), (ii) the coincidence of the youngest NGC 1140 YMC ages with the youngest age range covered by our models (Schulz et al. 2002, Anders & Fritze–v. Alvensleben 2003), where the contributions of the red supergiant (RSG) stars (which significantly affect the evolutionary tracks around 10 Myr) are not yet well-understood (see, e.g., Massey & Olsen 2003; we use the Padova tracks in our models; they do include a description of the RSG phase, which is however very uncertain), (iii) the partial overlap between the F785LP and F814W filter transmission curves, thus reducing the robustness with which we can obtain our parameters (Anders et al. 2004a, de Grijs et al. 2003c), and (iv) the lack of the NIR passbands that we would have used ideally to constrain the YMC metallicities (Anders et al. 2004a, Parmentier, de Grijs & Gilmore 2003), we decided to assume a generic metallicity of for all of the compact NGC 1140 YMCs, instead of trying to fit their metallicities independently. If (i) the starburst event responsible for the formation of the NGC 1140 YMCs indeed induced (compact) YMC formation on a galaxy-wide scale on short time-scales, and would thereby simultaneously cause significant mixing of the ISM (due to, e.g., ram-pressure effects), and (ii) prior to the recent starburst event star formation occurred throughout the galaxy at low levels with roughly comparable star formation rates (averaged over long, relatively quiescent periods), one should not expect the YMCs to have significantly varying metallicities. This assumption seems therefore justified by physical arguments on the one hand, and technical limitations on the other.
The results of our fits to the ages, masses and (internal) extinction values are tabulated in Table 3, for those YMCs for which we obtained fits with reasonable minimum values. We show both our best-fit estimates and the most likely parameter ranges (denoted by ‘min.’ and ‘max.’), following the technique described in Anders et al. (2004a) and successfully applied in Anders et al. (2004b) and de Grijs et al. (2003a,c). The uncertainties include the range encompassed by the best-fit 31.74 per cent (i.e., ) of our SSP models around the mean (see Anders et al. 2004a).
| ID | E (mag) | Age ( yr)a | Mass () | ||||||
|---|---|---|---|---|---|---|---|---|---|
| Min. | Best | Max. | Min. | Best | Max. | Min. | Best | Max. | |
| 2 | 0.14 | 0.20 | 0.26 | 1.1 | 1.6 | 2.1 | 0.9 | 1.3 | 1.7 |
| 4 | 0.45 | 0.45 | 0.50 | 1.6 | 1.6 | 1.6 | 1.4 | 1.4 | 1.6 |
| 5 | 0.00 | 0.00 | 0.00 | 2.4 | 2.4 | 2.8 | 0.4 | 0.4 | 0.5 |
| 6 | 0.50 | 0.50 | 0.60 | 1.2 | 2.0 | 2.0 | 6.3 | 7.1 | 7.5 |
| 7 | 0.75 | 0.75 | 0.80 | 1.2 | 1.2 | 1.2 | 3.7 | 3.7 | 4.4 |
| 9 | 0.25 | 0.30 | 0.35 | 2.0 | 2.0 | 3.2 | 0.5 | 0.5 | 0.7 |
| 17 | 0.30 | 0.35 | 0.35 | 1.2 | 1.2 | 1.2 | 0.2 | 0.2 | 0.2 |
| 19 | 0.45 | 0.50 | 0.50 | 1.2 | 1.2 | 1.2 | 0.4 | 0.4 | 0.4 |
Note: a – These ages are derived from fits to broad-band SEDs, and may have a scale uncertainty toward high ages, as discussed in the text.
4.2 Implications
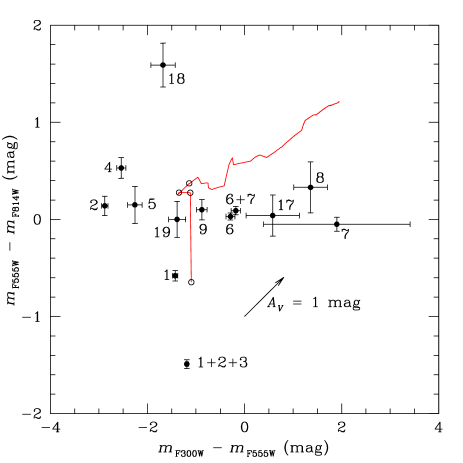
We will illustrate the uncertainties involved in the multi-parameter analysis of the broad-band SEDs by means of a two-colour diagnostic figure, Fig. 6. Here, we show the distribution of the compact NGC 1140 YMCs in the plane defined by the and colours. Overplotted on the distribution of data points is the model of the Anders & Fritze–v. Alvensleben (2003) set of SSPs; the open circles on this model indicate ages of 4, 8, 12, and 20 Myr, respectively, from the bottom upward. We also show the effect of 1 mag of visual extinction. The inclusion of a more dominant RSG phase than in the present model set would introduce a “loop” in the model close to the area where most of the clusters are concentrated. In principle, if our CO band head detection had been of sufficient S/N ratio and spatial resolution, the presence or absence of this CO feature in the CIRPASS spectra of the individual YMCs could potentially provide additional constraints on the importance of the uncertain RSG phase, although CO features are in fact present at a relatively large range of ages; showing that they are caused by the presence of RSGs requires both very good S/N ratios and better models than currently available. Unfortunately, the spatial resolution of our CIRPASS observations is significantly poorer than the HST WFPC2 resolution, and as such we can only conclude that the strongest starburst region, encompassing clusters [H94a]1,2,4, shows some evidence for the presence of the CO(6,3) band head feature, although we do not have enough information to match these low-S/N detections to any of the individual YMCs.
From this simple diagnostic figure, it follows that our multi-parameter analysis (Table 3) may have resulted in overestimates of a number of the YMC ages, and that at least the scatter of data points on the redward side of the model may be explained by extinction, with a similar degree of confidence. While intrinsic variations in the cluster IMFs may introduce additional scatter, such a scenario is not supported by our observations; high-resolution spectroscopy would be required to resolve this issue satisfactorily (e.g., Smith & Gallagher 2001, Mengel et al. 2002). On the other hand, since we have likely overestimated our YMC masses by a factor of a few to up to an order of magnitude (e.g., by assuming a Salpeter IMF, as discussed above, and by overestimating the cluster ages based on broad-band photometry, see below), stochastic effects may be responsible for at least part of the spread in Fig. 6: at these masses, of a few M⊙ (corrected for our overestimates), IMF sampling effects become noticeable and significant (Lançon & Mouhcine 2000, Bruzual 2002, Bruzual & Charlot 2003).
Despite the large uncertainties inherent to the broad-band SED analysis, by combining the diagnostic diagram of Fig 6 with the results summarised in Table 3 we see that complex [H94a]1–3 may be somewhat younger than complex [H94a]6–7, despite our relatively coarse age resolution of 4 Myr at these young ages (with a minimum model age of 4 Myr). [Regarding the individual YMCs, we could not obtain a satisfactory best-fit result for cluster 1 due to intrinsic problems related to the crowding of its immediate environment and the associated contamination of the WF/PC fluxes; cluster 3 could not be identified robustly as a separate compact object in the WFPC2 images.]
It appears, therefore, that there may be a small age gradient from complex [H94a]1–3 to complex [H94a]6–7. Although we justified our assumption of a mean YMC metallicity of in Section 4.1, we also performed our multi-parameter fits using the two adjacent steps in metallicity included in our models, i.e., 0.2 and . While – as expected – we notice the effects of the well-known age-metallicity degeneracy, the relative results, including the hint of an age gradient across the galaxy, remain the same. In other words, this possible age gradient is unlikely to be caused by our assumption of the YMC’s metallicity, unless there are significant metallicity variations from cluster to cluster. We will use these results for our interpretation of the galaxy’s recent star-formation history in Section 5.1. One should keep in mind, however, that our absolute age estimates are merely indicative, because our SSP models are not fully adequate to deal very robustly with very young star clusters: our lower age limit of 4 Myr and the 4-Myr age resolution, in addition to the inclusion of uncertain descriptions in the models, or absence, of stellar evolutionary phases such as the RSG and Wolf-Rayet stages, respectively, which play an important role at these ages, render absolute age estimates rather uncertain (see, e.g., Homeier, Gallagher & Pasquali [2002] for the implications of including an uncertain description of the RSG phase in the models, although Whitmore & Zhang [2002] make a case for less significant effects, based on their observations of YMCs in the Antennae galaxies). These effects will tend to make us overestimate the ages of the youngest objects, with ages within our youngest two age bins. However, relative age estimates, and therefore age gradients, are much more robust and can more reliably be used as diagnostics (see de Grijs et al. 2003a,c, Anders et al. 2004a), in particular at these young ages, where the colour evolution is rapid.
Our analysis in this paper represents the first one-to-one comparison of medium-resolution spectroscopy results with results from fits to broad-band HST SEDs using SSP models with newly updated input physics, most importantly the inclusion of an extensive set of gaseous emission-line and continuum emission. The large uncertainties resulting from the broad-band SEDs fits compared to the more accurate CIRPASS results therefore serve as an important lesson regarding the reliability of imaging data in the context of SSP evolutionary scenarios.
A conclusive test of the proposed scenario giving rise to an age gradient across the galaxy would be to obtain narrow-band Heii observations of the galaxy, a prime diagnostic of the presence of Wolf-Rayet stars associated with active starburst events. If one can obtain observations of high spatial resolution, so that the YMCs can be well separated from unrelated contamination from nearby objects, additional high-S/N Balmer-line EWs could potentially also provide evidence for the suggested age gradient.
Our photometric mass estimates of the compact NGC 1140 YMCs are comparable to the Galactic GCs comprising the high-mass wing of the GC mass distribution, even if we have overestimated our cluster masses by up to a factor of 3.5 (e.g. Mandushev, Staneva & Spassova 1991, Pryor & Meylan 1993) and to the spectroscopically confirmed masses of the so-called “super star clusters” in M82 (M82-F; Smith & Gallagher 2001), and the Antennae galaxies (Mengel et al. 2002). Our detection of similarly massive YMCs in NGC 1140 supports the scenario that such objects form preferentially in the extreme environments of interacting and starburst galaxies (cf. de Grijs et al. 2001, 2003a). This galaxy adds to the number of cases where rapid star formation has evidently produced compact YMCs. A subsequent paper (R. de Grijs et al., in prep.) will be dealing with the photometric versus spectroscopic mass estimates of the YMCs in NGC 1140. If we overestimated the ages of the brightest objects significantly, due to the model limitations discussed above, the actual masses of these objects will be lower, by an additional factor of , somewhat depending on the metallicity. As a caveat inherent to the nature of our data and its analysis, it should be realised, however, that even at HST resolution, point-like sources at the distance of NGC 1140 may in fact be more extended star-forming regions or multiple subclusters (and therefore potentially physically different from GC-type progenitors), although the vast majority of the compact YMC candidates in NGC 1140 have effective sizes smaller than the HST PSF.
H94a assumed a generic internal extinction of mag toward all YMCs in NGC 1140, based on the galaxy’s Balmer decrement (H94b). The average internal extinction in NGC 1140 appears to be moderately low overall, with estimates ranging from E mag (Storchi-Bergmann et al. 1994, H94b, Calzetti et al. 1994, 1995, Calzetti 1997), based on detailed modelling of the internal dust properties, or mag (assuming a Milky Way-type extinction law). This is consistent with the low extinction in the H emission line measured by Buat et al. (2002), mag, and with the low -band effective optical depths of derived by Takagi et al. (1999, 2003; but see Section 5.2). The latter results are fairly independent of both the extinction law assumed and the mass fraction of the galaxy involved in the starburst. Rosa-González, Terlevich & Terlevich (2002), on the other hand, derive a significantly higher global internal extinction, of mag. Nevertheless, it should be kept in mind that a fairly low global extinction estimate does not preclude a patchy extinction distribution. In addition, most of these extinction estimates are based on H/H line flux ratios, which introduces a bias towards the more actively star-forming regions. Thus, our varying extinction estimates for the YMCs in the central starburst (ranging between and mag, with most clusters being affected by mag; cf. Fig. 6) are not inconsistent with the low extinction estimates derived for the galaxy as a whole. Based on a comparison of our F300W/F336W and F814W images, it appears indeed that the clusters with the highest extinction estimates in Table 3, [H94a]4 and complex 6+7, are located in regions with higher-than-average patchy extinction.
5 Starburst time-scales
5.1 [Fe ii] vs. Brackett line emission
In Section 3 we showed that while the [Fe ii] line emission roughly follows the distribution of the YMCs across the face of NGC 1140, the high-order Brackett lines are predominantly confined to the northern starburst region. The luminosity of this region is, at optical continuum wavelengths, dominated by a complex of three of the most massive compact YMCs in the galaxy, [H94a]1–3.
The [Fe ii] line on the one hand, and the Brackett 12–4 and 14–4 lines on the other originate in physically distinct processes, each governed by their unique time-scale(s). It is well-established that [Fe ii]m line emission originates through two different mechanisms. Strong, compact [Fe ii] emission originates in partially ionised zones or shock-excited gas produced by SNe. In addition, more diffuse, spatially extended [Fe ii] emission seems to be associated with galactic superwinds. In active galactic nuclei, containing large numbers of partially ionised clouds and a strong photo-ionising source, [Fe ii] emission originates in the partially ionised zones (see Thompson [1995] and references therein), while in starburst galaxies, compact [Fe ii] emission is thought to arise from discrete SNRs (e.g., Oliva, Moorwood & Danziger 1989, Lumsden & Puxley 1995, Vanzi & Rieke 1997, Morel, Doyon & St-Louis 2002, Alonso-Herrero et al. 2003). Its excitation requires both the destruction of dust grains (which contain a large fraction of the interstellar iron) and large transition zones between Hii regions and regions of neutral hydrogen, in association with a hard ionising source (so that the electron temperature is sufficiently high to excite the forbidden [Fe ii] transitions; e.g., Oliva et al. 1989). Such spatial scales therefore imply that thermal shock excitation is favoured (Oliva et al. 1989, Vanzi & Rieke 1997).
Hydrogen Brackett lines, on the other hand, are formed by recombination in ionised gas associated with sources having a strong Lyman continuum, such as Hii regions created by young, massive stars. The [Fe ii]m/Br ratio is therefore a good diagnostic to distinguish between the ionisation structures favouring either “fast” shock-driven (as in SNRs) or UV destruction (as in Hii regions) excitation (see, e.g., Oliva et al. 1989, Vanzi & Rieke 1997 and references therein). The strong (high-order) Brackett line emission will fade effectively after Myr, while the [Fe ii] emission remains observable significantly longer; the [Fe ii]/Brackett line ratio is therefore expected to be age dependent.
This difference in origin is quantitatively supported by our line strength measurements. While both the composite Br 12–4 and Br 14–4 emission lines in NGC 1140-N are unresolved (with measured FWHMs of Å and Å for Br 12–4 and Br 14–4 respectively, compared to the widths of unresolved sky lines of FWHM Å), the [Fe ii] lines are clearly resolved. We measure FWHMs of Å and Å in starburst regions S and N, respectively, corresponding to intrinsic linewidths of 5.9Å and 4.2Å (FWHM), after correcting for the widths of the unresolved lines. This implies that the velocity dispersions across regions S and N are and km s-1, respectively, which is consistent with the scenario that we are seeing outflows in our [Fe ii] emission, most likely driven by the combination of SNe and stellar winds associated with the starburst.
It has been suggested that the [Fe ii] line emission reaches a maximum luminosity when the expansion of the entire SNR (of SN type Ia) becomes radiative after its initial adiabatic phase (Lumsden & Puxley 1995, Morel et al. 2002; see also Shull & Draine 1987). This occurs some yr after the SN explosion, when radiative cooling occurs on shorter time-scales than the dynamical time-scale. The presence of strong [Fe ii] emission indicative of SNRs can therefore help to set limits on a galaxy’s star formation history. The last SNe in a quenched starburst region occur at a time comparable to the longest lifetime of an SN progenitor after the end of the starburst activity. Following Iben & Laughlin (1989) and Hansen & Kawaler (1994), the time spent between the zero-age main sequence and planetary nebula phase by an progenitor star, which is generally adopted as a lower limit for Type II SNe (e.g., Kennicutt 1984), corresponds to Myr.
Thus, for NGC 1140 we conclude that the presence of strong [Fe ii] emission throughout the central galaxy implies that most of the recent star-formation activity was induced some Myr ago. However, based on our CIRPASS spectroscopy alone, we cannot exclude the possibility that much of the unresolved [Fe ii] emission outside the distinct peaks is associated with older, dissolved SNRs that have expanded into the galaxy’s ISM in the mean time.
The Br 12–4 and Br 14–4 emission, concentrated around NGC 1140-N, is most likely associated with recombination processes in (younger, ionised) Hii regions. This implies, therefore, that the most recent starburst event has transpired in this more confined area of the NGC 1140 disc. Thus, based on the [Fe ii] versus Brackett line emission, we conclude that a galaxy-wide starburst was induced several tens of Myr ago, with more recent starburst activity concentrated around the northern starburst region, NGC 1140-N, and the massive, compact YMCs [H94a]1–3. This is quantitatively supported by the stronger CO(6,3) absorption feature detected in this region, compared to the southern starburst, which again implies that this emission is between about 7 and 10 Myr old, if it is indeed associated with the presence of RSG stars. In fact, since the high-order Brackett lines will essentially disappear after about 8 Myr, the presence of both the Brackett lines and the CO(6,3) absorption feature places tight constraints on the age of NGC 1140-N.
The scenario sketched above is quantitatively and qualitatively confirmed by our results based on broad-band HST imaging observations. There appears to be a small age difference between YMC complexes [H94a]1–3 and [H94a]6–7 in the sense expected from our CIRPASS analysis (although we should keep in mind the caveats related to the broad-band analysis that were discussed in detail in Section 4.2).
| Feature | EWa | ||
|---|---|---|---|
| (erg s-1 cm-2) | (erg s-1 cm-2 Å-1) | (Å) | |
| 1. NGC 1140-N | |||
| [Fe ii] | 48 | 1.1 | 4 |
| Br 12–4 | 13 | 1.2 | 2 |
| Br 14–4 | 28 | 1.2 | 1 |
| CO | 5 | ||
| Continuum | 0.9 | ||
| 2. NGC 1140-S | |||
| [Fe ii] | 56 | 0.8 | 8 |
| Continuum | 0.3 | ||
Note – a The uncertain continuum level, in part caused by the underlying stellar absorption features (cf. Fig. 4) – such as the CO(4,1), CO(5,2), CO(6,3) and CO(7,4) bands, which will be present in a stellar population as soon as the supergiant or giant stars appear; OH absorption is usually less important (cf. Lançon & Wood 2000) – implies that the inherent uncertainties of our EW measurements are on the order of 30–50 per cent, in particular for ages Myr.
As a final check of the validity of our arguments we refer to the flux measurements reported in the various sections of this paper, an overview of which is given in Table 4. In principle, our detection of a possible age gradient across the face of NGC 1140 could have been introduced artificially, i.e., by the limited sensitivity of the IFU, in particular in region NGC 1140-S. The crucial test is therefore to determine whether we should have been able to detect any flux from the high-order Brackett lines in NGC 1140-S if the ratio of the [Fe ii] line flux to that of the Br 12–4 and Br 14–4 lines were roughly constant from NGC 1140-N to S. From the previous discussion, the measurements collected in Table 4, and from Fig. 5, it follows that we did not detect any integrated Br 12–4 or 14–4 flux in the southern starburst region, above a noise level in the individual fibre spectra. However, by itself this does not mean that the ratios between regions N and S must be different per se. In fact, if we consider the peak fluxes in NGC 1140-N, the ratio of [Fe ii] to either of the Brackett lines is close to unity within the uncertainties (which are on the order of 30 per cent for all measurements), but their integrated flux ratios are significantly higher. This indicates that, while the peak ratios come from the same set of fibres, the overall distribution of the Brackett line emission in NGC 1140-N is less extended spatially than that of the [Fe ii] emission.
As already briefly referred to, from Figs. 5c and d it follows that in neither of the Br 12–4 nor the Br 14–4 lines we detect any flux above our detection level, in any of the fibres in region NGC 1140-S. This includes the fibres coincident with the peak flux measurement in the [Fe ii] line. If, however, as in region N, the peak flux ratios would also be close to unity in NGC 1140-S, we should have detected at least high-order Brackett line emission at the peak position, because the [Fe ii] emission in the NGC 1140-S peak is significant in terms of the S/N ratio. Therefore, this “sanity check” implies that the [Fe ii] to Brackett line ratio is a function of position in the NGC 1140 core, and thus it seems likely that the suggested age gradient is indeed real.
We therefore conclude that there is no region of intense, current star formation in NGC 1140-S similar to the active starburst area observed in NGC 1140-N. The star formation level must therefore have declined in region S compared to that in N.
5.2 Comparison with independent determinations
Based on their preliminary analysis of the star cluster population in NGC 1140, H94a concluded that the accretion of a companion galaxy triggered an extended starburst and subsquent compact YMC formation in the core of the merger remnant. Stellar population synthesis of both an IUE UV spectrum of the central region (suggesting a population of OB stars) and of HST optical colours (and by analogy to [compact] YMC properties in a number of other starburst galaxies) indicates that the clusters [H94a]1–4 might be Myr old, while clusters [H94a]6 and 7, on the other end of the central high-intensity region, are somewhat older, at Myr. In addition, a blue arclet extending outward from clusters 6 and 7 contains a string of smaller Hii regions or 30 Doradus/R136-type star clusters, with slightly redder colours than the compact YMCs, which are likely older but otherwise similar objects. A small age gradient appears therefore to be present throughout the galaxy’s central region. Finally, relatively blue optical colours in the galaxy’s outer regions – where also redder, slightly less luminous star clusters are found – suggest that extensive star formation occurred throughout NGC 1140 within the last Gyr (H94a); current star formation could possibly be sustained for Gyr, based on the available gas mass and the global star-formation rate (H94b). We note that while we are able to confirm H94a’s age estimates of clusters [H94a]6 and 7 to within the uncertainties, we cannot confirm the very young ages postulated for clusters 1–3 based on our broad-band SED analysis (but see Fig. 6, which suggests that complex [H94a]1–3 might indeed be younger than 4 Myr) due to the technical limitation that our minimum model age is 4 Myr (and the fact that our models include uncertain descriptions of the poorly-understood RSG stellar evolutionary phase, and no description of the evolution of Wolf-Rayet stars). Nevertheless, our HST results are consistent with the age difference implied by the H94a analysis.
The time-scales derived for both the duration of the starburst event induced in the centre of NGC 1140, and also for substantial fluctuations of the star formation rate during the starburst, based on both our CIRPASS spectroscopy, and independently confirmed by our fits to the broad-band SEDs of the few dozen compact YMCs, are consistent with the detailed analyses of the stellar population composition in the disc of NGC 1140 by both Takagi et al. (1999) and Cid Fernandez, Leão & Rodrigues Lacerda (2003), based on broad-band SEDs and high-resolution optical spectroscopy, respectively. The latter authors derive a mean starburst age of , or Myr; they argue that almost half ( per cent) of the disc stellar population is younger than a few yr, with a further per cent being as young as a few yr.
Takagi et al.’s (1999) estimates concur with these results. Their starburst age estimates range from 25 to 40 Myr, depending on both the extinction law assumed and the mass fraction of the galaxy involved in the starburst. In their most recent analysis (Takagi et al. 2003), however, they derive a starburst duration of about 300 Myr, based on an analysis of UV–optical SEDs and allowing for additional gas infall over the galaxy’s lifetime. Their age derivation is, however, significantly affected by the age–extinction degeneracy, which is of particular importance around the starburst age adopted for NGC 1140.
6 NGC 1140’s current supernova rate
Significant effort has been invested in the use of the [Fe ii] luminosity of a given galaxy as indicator of its overall SN rate (e.g., Calzetti 1997, Vanzi & Rieke 1997, Alonso-Herrero et al. 2003 and references therein). Although our CIRPASS observations were obtained under non-photometric conditions, we can still derive a rough SN rate based on the [Fe ii] line flux. To do so, we used standard star observations taken on a different night, which implies that the calibration does not take into account the differences in transparency of the atmosphere between both nights. Since our observations were taken under non-photometric conditions, this essentially implies that we can at best obtain a lower limit to the galaxy’s SN rate.
The median combined [Fe ii] flux of the southern starburst region NGC 1140-S is ergs cm-2 s-1. Assuming a distance to NGC 1140 of 20 Mpc, this corresponds to a luminosity of ergs s-1. For the northern starburst region, the combined [Fe ii] flux of ergs cm-2 s-1 corresponds to an integrated luminosity of ergs s-1.
Using Vanzi & Rieke’s (1997) calibration of the relationship between [Fe ii] luminosity and SN rate, based on the SN rate of 0.11 SN yr-1 for the prototype starburst galaxy M82 (Huang et al. 1994), we derive SN rates of SN yr-1 for both regions. In line with the higher [Fe ii] luminosity for M82 measured by Alonso-Herrero et al. (2003), we arrive at a roughly double SN rate if we use their calibration. We caution that the uncertainties in these SN rates are at least a factor of two, since such are the uncertainties in M82’s SN rate itself. It thus follows that our derived SN rates are of a similar order of magnitude as those in the active starburst nucleus of M82. However, since our CO(6,3) absorption feature is weaker than that seen in M82 (cf. Förster-Schreiber et al. 2001, their Fig. 2), the NGC 1140 starburst is likely somewhat older than the one in M82’s active centre.
For comparison, Calzetti (1997) predicted SN rates – based on the long-slit NIR spectra of Calzetti, Kinney & Storchi-Bergmann (1996) – for the very central region of NGC 1140-N ranging from SN yr-1 (i.e., roughly an order of magnitude lower than ours) for stars with minimum mass of , based on the current star-formation rates obtained from Br luminosities and for upper masses to the IMF of 100 and , respectively. The significant difference in the SN rates derived from Calzetti’s (1997) spectra (which cover only the very central section of the NGC 1140-N starburst region), compared to the SN rate we derive from our CIRPASS data covering a larger area imply, therefore, that the SN activity associated with the active starburst in NGC 1140-N is significantly extended on spatial scales and not just confined to the area of the highest-intensity [Fe ii] emission.
From a comparison of the integrated [Fe ii] luminosities in regions S and N, it follows that the strength of the starburst is similar in both regions. The integrated flux of the N+S starburst activity, as traced by the [Fe ii] emission, ergs cm-2 s-1, comprises per cent of the total [Fe ii] flux within our common CIRPASS/HST FoV777Note that the sum of the [Fe ii] fluxes determined in regions S and N is per cent smaller than the integrated flux in regions S and N taken together, and determined independently. This difference is most likely due to uncertainties in the [Fe ii] line profile fits, in particular at low S/N ratios. This also implies that, in addition to the uncertainties introduced by the relative photometry, our systematic uncertainty in the [Fe ii] fluxes and luminosities and the derived SN rates is on the order of (at least) 10 per cent.: the integrated flux from the 177 CIRPASS lenses covering the HST FoV corresponding to that shown in Fig. 5a is ergs cm-2 s-1. Thus, our CIRPASS observations have revealed the presence of a large fraction ( per cent) of diffuse [Fe ii] emission throughout the entire centre of NGC 1140. For the high-order Brackett lines the situation is very different indeed; there is a negligible fraction of Br 12–4 and Br 14–4 flux present outside the NGC 1140-N starburst site, which further supports our interpretation that these lines are associated with the most active star formation in the galaxy.
7 Summary and conclusions
We have analysed NIR integral field spectroscopy of the nearby southern starburst galaxy NGC 1140, obtained at the Gemini-South telescope equipped with CIRPASS. The wavelength coverage used for this programme, m from m, includes the bright [Fe ii]m emission line, as well as the high-order Brackett lines Br 12–4 and Br 14–4, which are all clearly resolved in the NGC 1140 central starburst region, and located well away from contaminating OH sky lines. Additional HST imaging observations covering the UV/optical range have been used to place these CIRPASS results in the context of interaction-induced star cluster formation and evolution.
NGC 1140 is remarkable in the number of compact YMCs formed in its bright, compact emission-line core, which were most likely triggered by a recent merger event with a gas-rich companion galaxy. The total energy output of these YMCs far exceeds that of the local “super” star cluster R136 in the core of the 30 Doradus starburst region in the LMC. Our CIRPASS spectroscopy, combined with the broad-band HST images, probes the complex transitions between the YMCs and the galaxy’s ISM, which we use to test predictions of models for radiative and supernova-induced shocks.
The flux distribution of the [Fe ii] line is clearly more extended than those of the Brackett lines. While [Fe ii] emission is found throughout the galaxy, both Br 12–4 and Br 14–4 emission is predominantly associated with the northern starburst region. It is now well-established that the strong [Fe ii]m line emission in starbursts originates predominantly in SNRs. The Brackett lines, on the other hand, are formed by recombination in ionised gas associated with sources having a strong Lyman continuum, such as Hii regions created by young, massive stars. The [Fe ii] emission and the young region as a whole may, in fact, represent the broad base of a galactic outflow, or wind, in its early stages.
The presence of strong [Fe ii] emission in NGC 1140’s core, indicative of SNRs, can help to set limits on its star formation history. The last SNe in a quenched starburst region occur at a time comparable to the longest lifetime of an SN progenitor after the end of the starburst activity. Thus, for NGC 1140 we conclude that the presence of strong [Fe ii] emission throughout the central galaxy implies that most of the recent star-formation activity was induced in the past Myr.
The Br 12–4 and Br 14–4 emission, concentrated around NGC 1140-N, is most likely associated with recombination in (younger) Hii regions. This implies, therefore, that the most recent starburst event has transpired in this more confined area of the NGC 1140 disc, around the northern starburst region and the massive, compact YMCs [H94a]1–3.
This scenario is provisionally confirmed by our fits based on broad-band HST imaging observations (despite the large associated uncertainties), and by the preliminary analysis of H94a. Using the method developed in Anders et al. (2004a) and de Grijs et al. (2003c), we derive the YMC ages, masses, and extinction values simultaneously from the HST broad-band passband coverage; we assume a generic metallicity for all NGC 1140 YMCs of , which we justify by emphasizing technical limitations of our metallicity fits at the young ages expected for the compact NGC 1140 YMCs. Such a metallicity is also supported by previous, independent estimates. The ages derived for the NGC 1140 YMCs are all Myr (or perhaps significantly younger, in view of the uncertainties inherent to our method of analysis of broad-band SEDs), consistent with independently determined estimates of the galaxy’s starburst age, while there appears to be an age difference between YMC complexes [H94a]1–3 and [H94a]6–7 in the sense expected from our CIRPASS analysis. Our photometric mass estimates of the NGC 1140 YMCs, likely representing upper limits, are comparable to the Galactic GCs comprising the high-mass wing of the GC mass distribution and to the spectroscopically confirmed masses of the compact YMCs in M82 and the Antennae galaxies. Our detection of similarly massive YMCs in NGC 1140 supports the scenario that such objects form preferentially in the extreme environments of interacting and starburst galaxies.
Finally, we derive lower limits to the SN rates in the NGC 1140 starburst regions S and N of SN yr-1, within a factor of , which implies a similar starburst vigour as seen in the actively starbursting nucleus of the nearby prototype starburst galaxy M82. The two spatially-confined starburst sites S and N emit per cent of the integrated [Fe ii] flux in the galaxy, with the remainder being distributed in a diffuse component. The high-order Brackett lines, on the other hand, exhibit a negligible diffuse component, but are confined to starburst region N.
Acknowledgments
This paper is partially based on observations obtained at the Gemini Observatory, which is operated by the Association of Universities for Research in Astronomy, Inc. (AURA), under a cooperative agreement with the U.S. National Science Foundation (NSF) on behalf of the Gemini partnership: the Particle Physics and Astronomy Research Council (PPARC, UK), the NSF (USA), the National Research Council (Canada), CONICYT (Chile), the Australian Research Council (Australia), CNPq (Brazil) and CONICET (Argentina). We are grateful to Matt Mountain for the Director’s discretionary time to demonstrate the scientific potential of integral field units (the PI’s of this demonstration science programme are Andrew Bunker, Gerry Gilmore, and Roger Davies). We thank the Gemini Board and the Gemini Science Committee for the opportunity to commission CIRPASS on the Gemini-South telescope as a visitor instrument. We thank Phil Puxley, Jean René-Roy, Doug Simons, Bryan Miller, Tom Hayward, Bernadette Rodgers, Gelys Trancho, Marie-Claire Hainaut-Rouelle and James Turner for the excellent support received. CIRPASS was built by the instrumentation group of the Institute of Astronomy in Cambridge, UK. We warmly thank the Raymond and Beverly Sackler Foundation and PPARC for funding this project. Andrew Dean, Anamparambu Ramaprakash and Anthony Horton all assisted with the observations in Chile, and we are indebted to Dave King, Jim Pritchard & Steve Medlen for contributing their instrument expertise. The optimal extraction software for this 3D fibre spectroscopy was written by Rachel Johnson and Andrew Dean. This research is also partially based on observations with the NASA/ESA Hubble Space Telescope, obtained at the Space Telescope Science Institute (STScI), which is operated by AURA under NASA contract NAS 5-26555. JSG thanks the University of Wisconsin Graduate School for research support, and the Department of Physics and Astronomy at University College London for their hospitality for work on this paper. This research has made use of NASA’s Astrophysics Data System Abstract Service.
References
- [] Allende Prieto C., Lambert D.L., Asplund M., 2001, ApJ, 556, L63
- [] Alonso-Herrero A., Rieke G.H., Rieke M.J., Kelly D.M., 2003, AJ, 125, 1210
- [] Anders P., Bissantz N., Fritze–v. Alvensleben U., de Grijs R., 2004a, MNRAS, 347, 196
- [] Anders P., de Grijs R., Fritze–v. Alvensleben U., Bissantz N., 2004b, MNRAS, 347, 17
- [] Anders P., Fritze–v. Alvensleben U., 2003, A&A, 401, 1063
- [] Biretta J.A., et al., 2000, WFPC2 Instrument Handbook, Version 5.0 (Baltimore: STScI)
- [] Bruzual A.G., 2002, Geisler D., Grebel E., Minniti D., eds., Proc. IAU Symp. 207, Extragalactic Star Clusters, Astron. Soc. Pac., San Francisco, p. 616
- [] Bruzual A.G., Charlot S., 2003, MNRAS, 344, 1000
- [] Buat V., Boselli A., Gavazzi G., Bonfanti C., 2002, A&A, 383, 801
- [] Calzetti D., 1997, AJ, 113, 162
- [] Calzetti D., Kinney A.L., Storchi-Bergmann T., 1994, ApJ, 429, 582
- [] Calzetti D., Kinney A.L., Storchi-Bergmann T., 1996, ApJ, 458, 132
- [] Calzetti D., Bohlin R.C., Kinney A.L., Storchi-Bergmann T., Heckman T.M., 1995, ApJ, 443, 136
- [] Calzetti D., Armus L., Bohlin R.C., Kinney A.L., Koornneef J., Storchi-Bergmann T., 2000, ApJ, 533, 682
- [] Cid Fernandes R., Leão J.R.S., Rodrigues Lacerda R., 2003, MNRAS, 340, 29
- [] Dahari O., 1985, ApJS, 57, 643
- [] de Grijs R., Anders P., Bastian N., Lynds R., Lamers H.J.G.L.M., O’Neil Jr. E.J., 2003a, MNRAS, 343, 1285
- [] de Grijs R., Bastian N., Lamers H.J.G.L.M., 2003b, ApJ, 583, L17
- [] de Grijs R., Fritze–v. Alvensleben U., Anders P., Gallagher J.S. iii, Bastian N., Taylor V.A., Windhorst R.A., 2003c, MNRAS, 342, 259
- [] de Grijs R., Johnson R.A., Gilmore G.F., Frayn C.M., 2002, MNRAS, 331, 228
- [] de Grijs R., Lee J.T., Mora Herrera M.C., Fritze–v. Alvensleben U., Anders P., 2003d, New Astron., 8, 155
- [] de Grijs R., O’Connell R.W., Gallagher J.S. iii, 2001, AJ, 121, 768
- [] de Vaucouleurs G., de Vaucouleurs A., Corwin Jr. H.G., Buta R.J., Paturel G., Fouqué P., 1991, Third Reference Catalogue of Bright Galaxies, Version 3.9 (RC3)
- [] Eskridge P.B., et al., 2003, ApJ, 586, 923
- [] Förster-Schreiber N.M., Genzel R., Lutz D., Kunze D., Sternberg A., 2001, ApJ, 552, 544
- [] Gallagher iii J.S., Smith L.J., 1999, MNRAS, 304, 540
- [] Guseva N.G., Izotov Y.I., Thuan T.X., 2000, ApJ, 531, 776
- [] Hansen C.J., Kawaler S.D., 1994, Stellar Interiors: Physical Principles, Structure, and Evolution, New York: Springer
- [] Haynes M.P., Hogg D.E., Maddalena R.J., Roberts M.S., van Zee L., 1998, AJ, 115, 62
- [] Heckman T.M., Robert C., Leitherer C., Garnett D.R., van der Rydt F., 1998, ApJ, 503, 646
- [] Hernquist L., Spergel D.N., 1992, ApJ, 399, L117
- [] Ho L.C., Filippenko A.V., 1996a, ApJ, 466, L83
- [] Ho L.C., Filippenko A.V., 1996b, ApJ, 472, 600
- [] Holtzman J.A., et al., 1992, AJ, 103, 691
- [] Homeier N., Gallagher iii J.S., Pasquali A., 2002, A&A, 391, 857
- [] Huang Z.P., Thuan T.X., Chevalier R.A., Condon J.J., Yin Q.F., 1994, ApJ, 424, 114
- [] Hummer D.G., Storey P.J., 1987, MNRAS, 224, 801
- [] Hunter D.A., O’Connell R.W., Gallagher J.S. iii, 1994a, AJ, 108, 84 (H94a)
- [] Hunter D.A., van Woerden H., Gallagher J.S. iii, 1994b, ApJS, 91, 79 (H94b)
- [] Iben Jr. I., Laughlin G., 1989, ApJ, 341, 312
- [] Kennicutt R.C., 1984, ApJ, 277, 361
- [] Krist J., Hook R., 2003, The Tiny Tim User’s Guide, Version 6.1; http://www.stsci.edu/software/tinytim/tinytim.html
- [] Kroupa P., Tout C.A., Gilmore G.F., 1993, MNRAS, 262, 545
- [] Lançon A., Mouhcine M., 2000, Lançon A., Boily C., eds., Massive Stellar Clusters, Astron. Soc. Pac., San Francisco, p. 34
- [] Lançon A., Wood P.R., 2000, A&AS, 146, 217
- [] Leitherer C., Schaerer D., Goldader J.D., et al., 1999, ApJS, 123, 3
- [] Lumsden S.L., Puxley P.J., 1995, MNRAS, 276, 723
- [] Mandushev G., Staneva A., Spassova N., 1991, A&A, 252, 94
- [] Marconi G., Matteucci F., Tosi M., 1994, MNRAS, 270, 35
- [] Massey P., Olsen K.A.G., 2003, ApJ, 126, 2867
- [] Mengel S., Lehnert M.D., Thatte N., Genzel R., 2002, A&A, 383, 137
- [] Maihara T., Iwamuro F., Yamashita T., Hall D.N.B., Cowie L.L., Tokunaga A.T., Pickles A., 1993, PASP, 105, 940
- [] Morel T., Doyon R., St-Louis N., 2002, MNRAS, 329, 398
- [] O’Connell R.W., Gallagher iii J.S., Hunter D.A., 1994, ApJ, 433, 65
- [] Oliva E., Moorwood A.F.M., Danziger I.J., 1989, A&A, 214, 307
- [] Origlia L, Moorwood A.F.M., Oliva E., 1993, A&A, 280, 536
- [] Parmentier G., de Grijs R., Gilmore G., 2003, MNRAS, 342, 208
- [] Parry I.R., et al., SPIE, 4008, 1093
- [] Pryor C., Meylan G., 1993, in Djorgovski S.G., Meylan G., eds., Structure and Dynamics of Globular Clusters, Astron. Soc. Pac., San Francisco, p. 357
- [] Rosa-González D., Terlevich E., Terlevich R., 2002, MNRAS, 332, 283
- [] Schlegel D.J., Finkbeiner D.P., Davis M., 1998, ApJ, 500, 525
- [] Schulz J., Fritze–v. Alvensleben U., Möller C.S., Fricke K.J., 2002, A&A, 392, 1
- [] Schweizer F., Seitzer P., 1988, ApJ, 328, 88
- [] Shull J.M., Draine B.T., 1987, in: Interstellar Processes, Hollenbach D.J., Thronson Jr. H.A., eds., Dordrecht: Reidel, p. 283
- [] Smith L.J., Gallagher J.S., iii, 2001, MNRAS, 326, 1027
- [] Stasińska G., Comte G., Vigroux L., 1986, A&A, 154, 352
- [] Storchi-Bergmann T., Calzetti D., Kinney A.L., 1994, ApJ, 429, 572
- [] Takagi T., Arimoto N., Vansevičius V., 1999, ApJ, 523, 107
- [] Takagi T., Arimoto N., Hanami H., 2003, MNRAS, 340, 813
- [] Thompson R.I., 1995, ApJ, 445, 700
- [] Vanzi L., Rieke G.H., 1997, ApJ, 479, 694
- [] Whitmore B.C., 2003, in: A Decade of Hubble Space Telescope Science, STScI Symp. ser. 14, Livio M., Noll, K., Stiavelli M., eds., Cambridge: CUP, p. 153
- [] Whitmore B.C., Zhang Q., 2002, AJ, 124, 1418
- [] Windhorst R.A., et al., 2002, ApJS, 143, 113