Evolution of planetary nebulae
We investigate the bright cut-off of the O iii planetary nebula luminosity function (PNLF), that has been suggested as a powerful extragalactic distance indicator in virtue of its observed invariance against populations effects. Theoretical PNLFs are constructed via Monte-Carlo simulations of populations of PNe, whose individual properties are described with the aid of recent PN synthetic models (Marigo et al. 2001), coupled to a detailed photoionisation code (CLOUDY). The basic dependences of the cut-off magnitude are then discussed. We find that : (i) In galaxies with recent or ongoing star formation, the modelled PNLF present values between and , depending on model details. These are very close to the observationally-calibrated value for the LMC. (ii) In these galaxies, the PNLF cut-off is produced by PNe with progenitor masses of about 2.5 , while less massive stars give origin to fainter PNe. As a consequence is expected to depend strongly on the age of the last burst of star formation, dimming by as much as 5 magnitudes as we go from young to 10-Gyr old populations. (iii) Rather than on the initial metallicity of a stellar population, depends on the actual [O/H] of the observed PNe, a quantity that may differ significantly from the initial value (due to dredge-up episodes), especially in young and intermediate-age PN populations. (iv) Also the transition time from the end of AGB to the PN phase, and the nuclear-burning properties (i.e. H- or He-burning) of the central stars introduce non-negligible effects on . The strongest indication derived from the present calculations is a serious difficulty to explain the age-invariance of the cut-off brightness over an extended interval, say from 1 to 13 Gyr, that observations of PNLFs in galaxies of late-to-early type seem to suggest. We discuss the implications of our findings, also in relation to other interpretative pictures proposed in the past literature.
Key Words.:
planetary nebulae: general – Stars: evolution – Galaxies: stellar content – Galaxies: distances1 Introduction
The Planetary Nebula luminosity function (PNLF) constitutes one of the most attractive indicators to set out the extragalactic distance scale. From the observational side, PNe can be identified in galaxies from the LMC to as far as the Virgo cluster, and are numerous in some of the key galaxies that link the “local” distance scale given by Cepheids, with the more distant scale given by the surface brightness fluctuations (SBF) method, the Tully-Fisher relation, and SNe Ia. The PNLF is suitable for determining distances as far as 20–25 Mpc, beyond which exposure times for reasonable S/N-ratios become prohibitively long. The importance of the PNLF for the cosmological distance ladder is fully described by e.g. Ciardullo (2003), Ciardullo & Jacoby (1999) and Jacoby, Ciardullo & Feldmeier (1999), Jacoby (1997), to whom we refer for all details.
In practice, the PNLF as a candle works in the following way: Once the flux in the O iii emission line, (in cgs units), is measured for a sample of PNe in an external galaxy, it is converted to magnitude,
| (1) |
(Jacoby 1989). The number of objects at any given bin constitutes the PNLF, , which can be fitted over the brightest magnitudes by the function
| (2) |
(see Ciardullo et al. 1989). The key quantity is the cut-off magnitude . According to several arguments (see below), its corresponding absolute value, , appears to be constant in most galaxies, hence providing an excellent (secondary) standard candle. Therefore, a measure of gives a distance estimate in a single step, provided that interstellar reddening is suitably taken into account. The present-day calibration of , based on a sample of galaxies with SBF and Cepheid distances, and correcting for a small metallicity dependence, is (Ciardullo et al. 2002).
The possibility of systematic variations in the value of among galaxies has been investigated in several different ways. From the observational side, the evidences for a nearly constant maximum luminosity for PNe are numerous, as reviewed by e.g. Ciardullo (2003) and Jacoby (1997). The main points are: (1) does not significantly change with galactocentric radius in the galaxies M31, M81, NGC 4494 and NGC 5128, where significant population gradients should be present. (2) There is no hint of large systematic variations in among galaxies of different types in the galaxy clusters/groups of M81, NGC 1023, NGC 5128, Fornax, Leo I, and Virgo. Overall, this is indicating that age and metallicity variations have little effect on . On the other hand, comparison with Cepheid distances reveals a small non-monotonic dependence on metallicity, expressed by the system’s oxygen abundance, which can be compensated for by a relation quadratic in [O/H] (Ciardullo et al. 2002).
Although these observational arguments seem compelling, they are not accompanied by a solid, unique theoretical framework. In other words, different authors do not agree on the reasons why should be constant, reaching seemingly contradictory conclusions over the years. First, early theoretical arguments by Jacoby (1989) and PN modelling by Dopita et al. (1992) explain why the O iii flux depends little on the PN metallicity. At the same time, the PNLF simulations by Méndez et al. (1993) indicate that a substantial dependence on population age might be present, as indicated by the differences in the best fits of the LMC and Milky Way PNLFs. Dopita et al. (1992) also suggest that a dependence on age should be present. While Méndez et al. (1993) claim that the bright end of the PNLF is populated by optically-thin objects, Dopita et al. (1992) model optically-thick objects only and, after metallicity and population corrections, succeed in reproducing the PNLF and the constant cutoff brightness. Similar open questions concern the importance of hydrogen- (Méndez et al. 1993) vs. helium-burning (Ciardullo et al. 1989; Jacoby 1989) central stars.
More recently, the apparent lack of predicted population age effects is explained by Ciardullo & Jacoby (1999) by compensating circumstellar extinction. Young and massive central stars should be very luminous and result in over-luminous PNe (i.e. beyond the standard ), which is not observed. The proposed solution by Ciardullo & Jacoby (1999) is that, since the most massive asymptotic giant branch (AGB) stars likely become dust-enshrouded because of heavy mass loss, the related circumstellar extinction would reduce the O iii emission from these objects, always to at least or below. Provided that PNe with lower-mass progenitors are present, then the observed cut-off magnitude would be . If this is the case, one has yet to understand which is the typical age of the PNe that contribute to the cut-off, and explore the metallicity effects in the relevant age intervals.
The theoretical investigations of the PNLF, quoted above, have different levels of sophistication in the models. Because of the complexity of the problem, simplifications and severe assumptions about the properties of PNe and their progenitor stars have always been introduced, like for instance: an initial–final mass relation (hereinafter also IFMR) independent of metallicity (e.g. Méndez et al. 1993), either optically-thin or thick PNe (Dopita et al. 1992; Méndez et al. 1993; Stanghellini 1995; Méndez & Soffner 1997), a narrow mass range being responsible for the bright end of the PNLF (Jacoby 1989; Dopita et al. 1992), and the restriction to either H- or He-burner central stars only. All these assumptions can be improved in some way, by using the full results of stellar evolution and the population synthesis theory.
In the present paper, we elaborate on the theoretical framework for the PNLF predictions, based on our own simulations. The starting point for such a project has been the construction of an updated synthetic code, that follows the PN evolution as a function of basic stellar parameters, such as progenitor mass, metallicity, type of post-AGB evolution, etc. The complete code is described in Marigo et al. (2001; hereafter Paper I), together with basic comparisons with the available data for Galactic PNe. Note that this code is much more complex than those previously used to investigate the PNLF, as it takes into account the chemical composition and wind velocity of the ejected material as predicted by AGB models, the interaction of the multiple winds as the PN expands, the effect of shell thickening due to ionisation, etc. Moreover, there is no artificial assumption about the conditions of optical thickness of the nebulae. The underlying model used to produce theoretical PNLFs is therefore more realistic and much less dependent on explicit or hidden assumptions than previous approaches. We will recapitulate the key features of our theoretical model in Section 2.1.
Despite all improvements, the Marigo et al. (2001) models still treated some characteristics of the ionized nebulae in a simplified way. For instance, the electronic temperature was introduced as a parameter and kept constant during the complete PN evolution. The emission line fluxes were then derived by simple formulas based on this temperature, on element abundances, and on the estimated sizes of the Strömgren spheres for different ions. Since the flux of the optical forbidden lines – and in particular the O iii one – depends strongly on and the actual amount of ionized material, this simplification is clearly inadequate for an investigation of the PNLF. Hence, in this paper (Section 2.2) we relax the above-mentioned approximations by incorporating the photoionisation code CLOUDY (Ferland 2001) into our PN models, thereby improving them further, and particularly towards the direction of accurate predictions of spectral features.
Then, in Sect. 3 we describe the generation of simulated PN samples in galaxies, firstly performing some basic comparisons with the empirical data of Galactic PNe. We show how present models can reproduce, to a large extent, some well-known properties of observed PNe, such as the correlations between the ionized mass and nebular density with the radius, and those between particular emission line ratios.
In Sect. 4 we move to analyse the predicted synthetic PNLF, with the aim to discuss the expected behaviour of the bright cut-off, . We will in particular focus on the nature of the objects responsible for the bright cut-off, analysing the dependence of on physical and technical factors.
Finally, Sects. 5 and 6 summarise the results of present models in terms of basic dependences of the cut-off, and draw a few conclusions about the PNLF method, at the same time highlighting the main points of discrepancy between our findings and the picture used so far to interpret the PNLF results.
2 Synthetic model for PN populations
2.1 Overview of the PN model
We follow the evolution of a single PN by using the synthetic code from Paper I. The main aspects of our PN models are:
-
•
The stellar evolution prior to the PN-phase is taken for a large grid of initial masses and metallicities from Girardi et al. (2000) for phases up to the first thermal pulse, and from Marigo et al. (1999) and Marigo (2001) during the complete TP-AGB phase (the AGB-phase with thermal pulses occuring). The TP-AGB evolution includes the main phase of mass loss, which later gives origin to the PN shell. We use the model predictions to follow the evolution in time and radius of the wind ejecta and their chemical composition.
-
•
We use post-AGB evolutionary tracks from Vassiliadis & Wood (1994) to model the evolution of the PN central star (CSPN). Such tracks are available for both H- or He-burning regimes. A transition time, , is assumed between the end of the TP-AGB and the beginning of the post-AGB track at K. The CSPN tracks allow the computation of quantities such as the flux of UV ionising photons and the velocity of the fast wind.
-
•
The PN shell is ionized by the UV photons and expands due to its initial ejection velocity. As a major improvement of synthetic models we include the following dynamical effects: the shell shaping by the inner fast wind emitted from the hot CSPN (following Volk & Kwok 1985), the successive engulfment of external layers expelled at early times with lower expansion velocities, and the interaction of multiple winds, including the effect of shell-thickening due to ionisation (based on Kahn 1983).
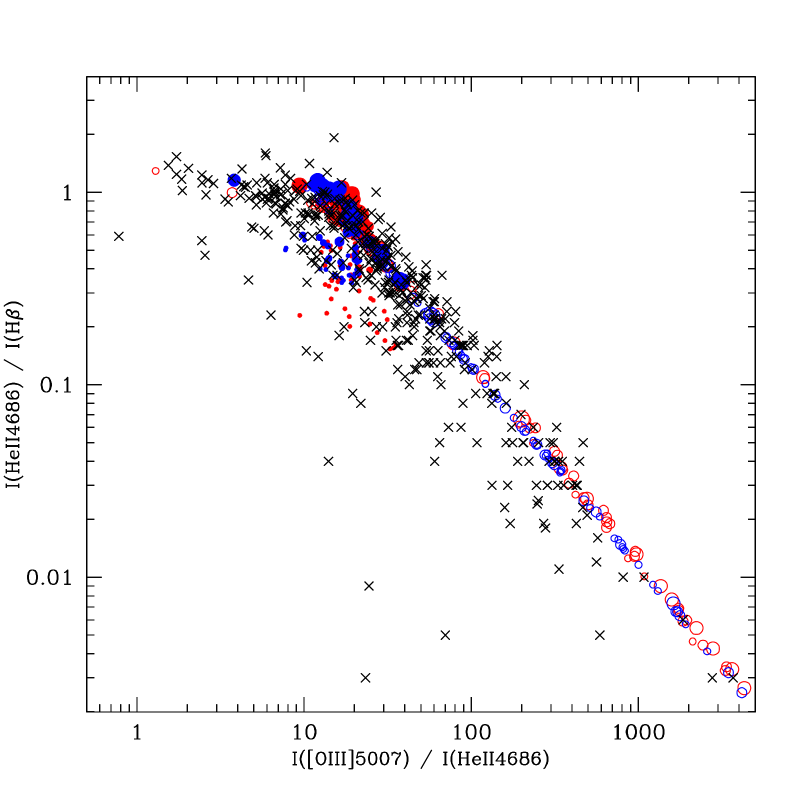
In the original model (Paper I), the description of ionisation is simplified. The electron temperature in the nebula is assumed to be constant and close to K for the entire H+ region. Furthermore, the sizes of the H+, He+, He++ regions are derived from simple considerations about the sizes of the different Strömgren radii, i.e. the radii below which the corresponding ionising photons would be responsible for complete ionisation. Moreover, the size of the O++ region, whence the O iii line is emitted, is simply assumed to be equal to the He+ region; this latter assumption is based on the similarity between the He+ and O++ ionisation potentials (54.4 and 54.9 eV, respectively). Of course, these assumptions directly affect the predictions for emission lines such as He ii and O iii. Despite these simplifications, it is demonstrated in Paper I that our PN models can reproduce quite well the observed correlation between the line ratios He ii/ and O iii/He ii.
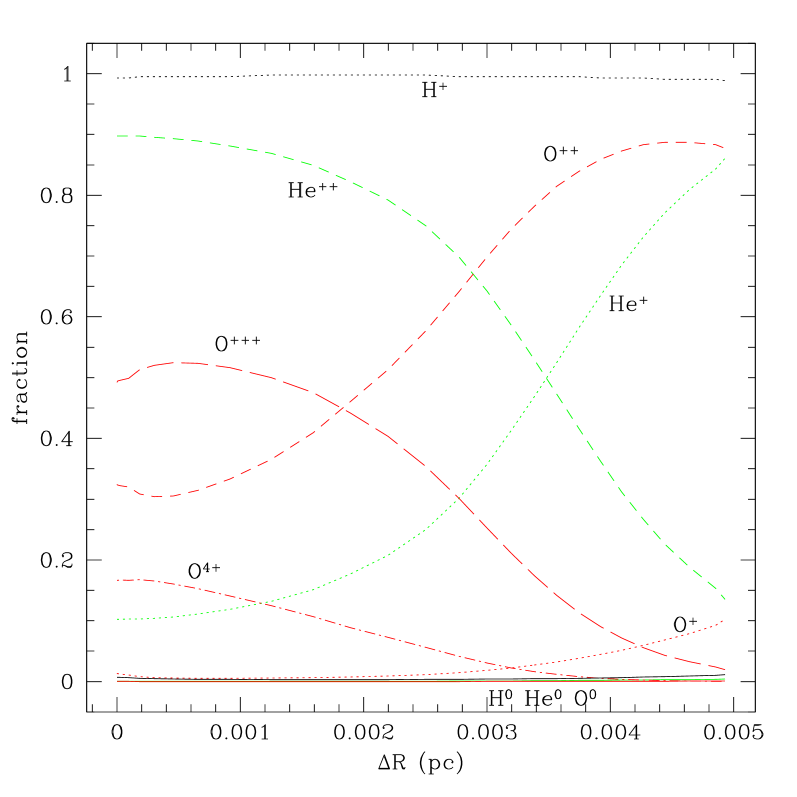
Nonetheless, these assumptions clearly are not adequate for an accurate modelling of the absolute O iii flux from PNe, which is our main target in the present paper because: (1) the flux of any collisionally-excited forbidden line is very sensitive to the electron temperature , that therefore should not be assumed constant, but rather it needs to be consistently computed from the equations of energy balance inside the nebular material; and (2) according to detailed photoionisation models, the O++ ionised region is neither expected to have sharp edges, nor is the O++ fraction expected to follow so closely the He+ one. These points are illustrated in Fig. 1.
To overcome the limitations of Paper I in this respect, the proper choice is to apply a complete photoionisation code to our evolutionary models. This step is described in the following section.
2.2 Incorporation of CLOUDY
We opt for the photoionisation code CLOUDY (Ferland 2000, 2001), version 94, which is a publicly-available, widely-used and well-tested tool for describing the structure of ionised regions and their emission spectra. CLOUDY and other similar photoionisation codes have already been applied in the evolutionary modelling of PNe by a number of authors, among them Volk (1992), Stasińska (1989), Stasińska & Szczerba (2001) Dopita & Meatheringham (1990), Dopita et al. (1992), Dopita & Sutherland (2000), Phillips (2000). However, in all those cases the treatment of the underlying stellar population and of the nebula expansion was very crude, compared to our method of Paper I.
In order to couple CLOUDY to our evolutionary code, we proceed in the following way:
-
1.
The former synthetic code (Paper I) is run for a guess electron temperature of K.
-
2.
At each time step, the radial structure (density, velocity, chemical composition, etc.) of the ionised shell is taken from the synthetic code and provided as input to CLOUDY.
-
3.
CLOUDY is then used to solve for the energy balance, ionisation structure, and emissivities as a function of radius. From the CLOUDY output, we extract the most relevant information such as the volume-averaged electron temperature and the outcoming fluxes in some of the main emission lines.
To simulate the nebular structure given to CLOUDY a number of parameters must be specified. For the present work, we adopt an expanding-sphere geometry with covering factor equal to (see Ferland 2001 for details), inner and outer radii and , and uniform hydrogen density (refer to Paper I for the precise definitions of the quantities). All the 30 chemical elements allowed by CLOUDY are considered. For most elements, a scaled-solar abundance, corresponding to the adopted value, is assumed. The adopted fractions of H, He, C, N, O, Ne and Mg, on the contrary, are the ones predicted from the evolution of the PN progenitor, with all dredge-up events as well as hot-bottom burning being followed in detail (see Marigo 2001). It should be remarked that the abundances of these elements in the main expanding PN shell may change with time, due to the accretion of successive outer layers ejected from the progenitor star at previous stages of its nucleosynthetic evolution. Note that such a variable PN composition is being considered for the first time in a theoretical model for the PNLF.
As for the central star, and values are converted into photon fluxes by using the following libraries of intrinsic stellar spectra, already available in CLOUDY: ATLAS9 from Kurucz (1993) for K, and the PN nuclei non-LTE models from Rauch (1997) for K.
2.3 Consistency and accuracy checks
Initially, our intention was to iterate over the sequence of operations 1 to 3 outlined at the beginning of Sect. 2.2, i.e. provide the output from CLOUDY as a new guess to the synthetic PN model, and iterate steps 1 to 3 until convergence to a single value of had been reached. In practice, it has become clear that this iteration is not necessary, for the following reasons:
First, the output values from CLOUDY turn out to be, in general, of the same order as the input value of K, especially during the phase in which the highest and O iii luminosities are attained. Typical values are comprised between and a maximum value of K. Lower values are present only in the very initial phases of nebular ionisation (as the central star is heating up), and in very latest phases of recombination (as the central star fades on the white dwarf track). These stages of low present either very low nebular emissivities, or very low surface brightnesses, and likely do not correspond to observable PNe.

Second, the input provided to our synthetic code has a very small impact on the structure and evolution of the nebula, and consequently hardly affects the output values from CLOUDY. This is illustrated in Fig. 2 which presents the output from CLOUDY for a few models, corresponding to the same PN progenitor star but adopting three different values the input temperature , i.e. , , and and K. Evidently, the output values differ just little between the various cases. For the main phase of PN evolution, in the age interval between 2 000 and 4 000 yr (where the O iii luminosity attains the highest values), the values differ by less than 4%. The differences are caused by the modest changes in the density – and hence radial thickness – of the nebular shell, for which the input plays a minor role.
For this same set of models, Fig. 2 also presents the resulting absolute magnitude in the O iii111 is computed from Eq. (1), assuming a PN distance of 10 pc., , as a function of time. Again, the trial input has just a modest impact on the line flux calculated by CLOUDY. The largest differences are of about mag for the models illustrated in Fig. 2; we find that at larger stellar masses, that produce the brightest PNe, the differences are even lower. From tests we have performed, we expect that on average, by using a constant of K, the typical PN models will have magnitudes as accurate as to about mag.
Such an accuracy may not seem good enough for the study of a potential standard candle. However, we should recall that this theoretical indetermination of is comparable to the global uncertainty affecting the observational derivation of (see Jacoby et al. 1990). Moreover, we expect that the errors in our predicted will be mostly systematic, whereas our study intends to explore mainly the differential effects – i.e. the changes in between different galaxies. We also remark that, although the absolute values of is of high interest, an accurate theoretical calibration of its value is still out of reach, as we will demonstrate in this paper.
2.4 Summary of parameters
The low sensitivity of our results to the input guess , effectively cancels this quantity from our list of input parameters. The adjustable parameters that remain in our models are:
-
•
the initial mass and metallicity ;
-
•
the transition time ;
-
•
the choice of either H- or He-burning post-AGB track.
Other important quantities like the initial He content, and the CSPN mass, are defined by the relationships already incorporated in the synthetic evolution models, such as the helium-to-metal enrichment ratio (see Girardi et al. 2000), and the initial–final mass relation (see Marigo 2001), which has a dependence on metallicity.
The typical values for , and the type of post-AGB evolution, have a great impact on the evolution of single PN. For a given mass and metallicity, they completely settle the evolutionary timescale of the central star, and hence the duration of the PN phase. It is worth recalling the present uncertainties in these key ingredients of our models:
The transition time is very badly predicted by theory. Its value depends on several details of the final phase of mass loss after the termination of the AGB-phase, when the star is getting hotter. Main factors driving are the velocity by which the residual stellar envelope is peeled off from the star, and the velocity by which the same envelope is burnt from below by nuclear reactions. Educated guesses about these processes can be made (see e.g. the discussion in Stanghellini & Renzini 2001), but lead to a general picture of great uncertainty, in which the only firm conclusions are that should generally decrease with stellar mass, and have values of the order of hundreds to thousands of years. Alternatively, values can be evaluated from evolutionary codes including shell-burning and reasonable prescriptions for mass-loss (e.g. Wood & Faulkner 1986). From such models, Vassiliadis & Wood (1994) find higher values between 3 000 and 20 000 yr, but with no obvious correlation with mass. Moreover, the derived depends critically on the particular phase of the pulse cycle at which the star leaves the AGB. Therefore, is very uncertain, and even for the optimistic case in which the mass-loss rates were known in detail, a large star-to-star variation of might be expected.
In our models, we decided to compute PN grids for single values of constant . This approach is useful for calibrating the typical values of , which is otherwise essentially unknown. In Paper I, we found that data about Galactic PNe, as for example the relation between mass and radius of the ionized matter, can be reproduced well with shorter transition times of 1000 years or below.
The type of post-AGB evolution is also determined, mainly, by the phase of the pulse cycle in which the star leaves the AGB (Iben 1984; Wood & Faulkner 1986; Vassiliadis & Wood 1994): if it occurs during the quiescent phases between thermal pulses, a classical H-burning track is followed, otherwise the central star starts the post-AGB as a He-burning object. In principle, both H- and He-burning cases are to be expected in samples of PNe. The main challenge of theory, in this case, is to constrain the expected ratio of H- and He-burning stars.
In our models, we compute PN grids for either H- or He-burning tracks. The resulting synthetic samples can then be mixed in varying proportions, before they are compared with data.
For the present study extensive grids of PN models are calculated with the following input parameters:
-
•
, , , which correspond rougly to the SMC, LMC, and solar composition;
-
•
, and yr;
-
•
both H- and He-burning tracks.
Each grid corresponds to at least 20 tracks computed for stellar masses between and . All models adopt the prescription for the terminal wind velocity (Paper I). Additional sets with different values – namely 800 and 2500 yr – are calculated for the , H-burning case.
3 Properties of synthetic PN samples
3.1 Modelling populations of PNe
In order to simulate populations of PNe in external galaxies, we employ a simple population synthesis approach. Since the PN lifetimes, , are much shorter than the main sequence lifetimes of their progenitors, , the initial mass distribution of PNe – the number of PNe from stars with initial mass – is fairly well described by:
| (3) |
where is the initial mass function (IMF), and is the star formation rate (SFR, in mass per unit time) at the galactic age .
In the present work, we simply assume a Salpeter (1955) IMF, . The stellar quantities, and , are interpolated from the existing grid of models to any given value of initial mass and metallicity . Given an age , the stellar metallicity is selected from a given age–metallicity relation (AMR) .
By assuming a given star formation history and , Eq. (3) is used to construct the probability distribution function of initial masses. Then, any synthetic sample of PNe is randomly generated with the aid of a simple Monte Carlo method, provided that the above distribution is complied with. Hence, for each star, a random age is selected in the interval . Finally, all stellar parameters (nebular masses, radii, velocities, emission fluxes, and the properties of central stars) are obtained from interpolation in the existing PN model grids.
It should be recalled that the resulting synthetic samples strictly obey the basic theories of stellar evolution and population synthesis of galaxies, and therefore they present some of the intrinsic selection effects and biases that are inherent to these theories. For instance, tracks with higher PN-phase lifetimes are naturally more represented in these samples. In order to simulate observed samples, additional selection criteria should be imposed, such as e.g. a given limit in O iii magnitude and/or surface brightness. In the present work, such selection criteria are assumed a posteriori, when required for the comparison with empirical data.
For each one of PN model grids, we simulate synthetic PN samples until a number of PNe brighter than is reached. This guarantees an adequate sampling of the brightest part of the PNLF.
3.2 Comparison with empirical data
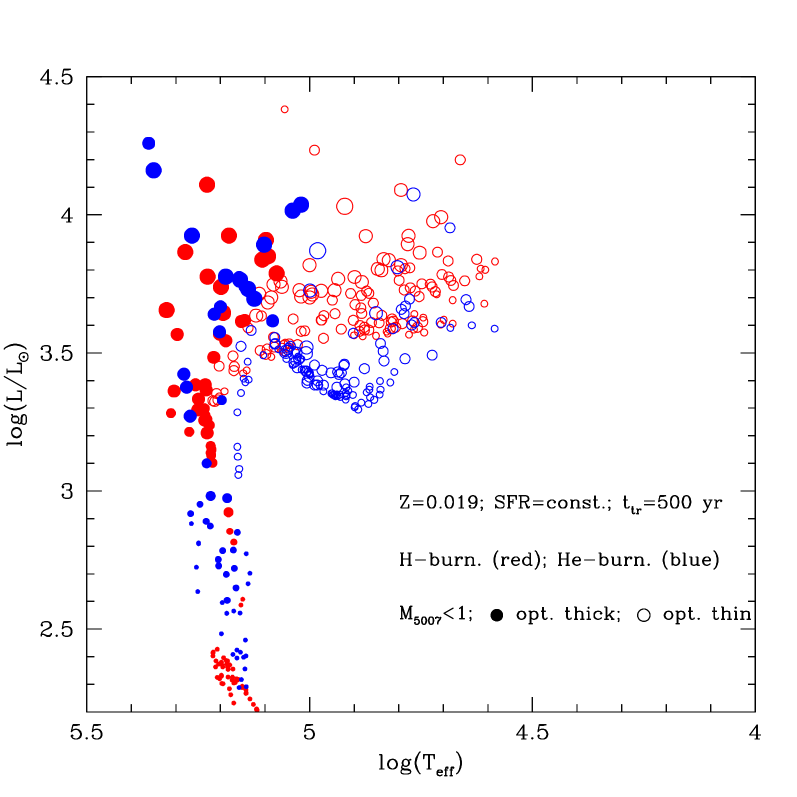
Figures 3–6 illustrate the predicted properties of synthetic samples of PNe and their central stars for exemplifying choices of the input parameters (namely: constant metallicity ; yr; H/He-burning tracks; constant SFR) and selection criteria (specified in the captions). Similar plots can be obtained for different input parameters.
Let us start with Fig. 3 that shows the predicted distribution of the PN central stars in the HR diagram, as a function of the O iii luminosity (larger circles correspond to more luminous PNe). On average, central stars with higher luminosity and larger effective temperature produce brighter PNe in the O iii line. We see that PNe – emitting in the O iii line – should be optically-thin to the H-ionising flux as long as their central stars are evolving along the horizontal part of their post-AGB tracks; later they may become optically-thick as the PN nuclei start fading. Moreover, we notice that He-burning central stars of optically-thick PNe tend to concentrate towards lower luminosities compared to H-burning objects.
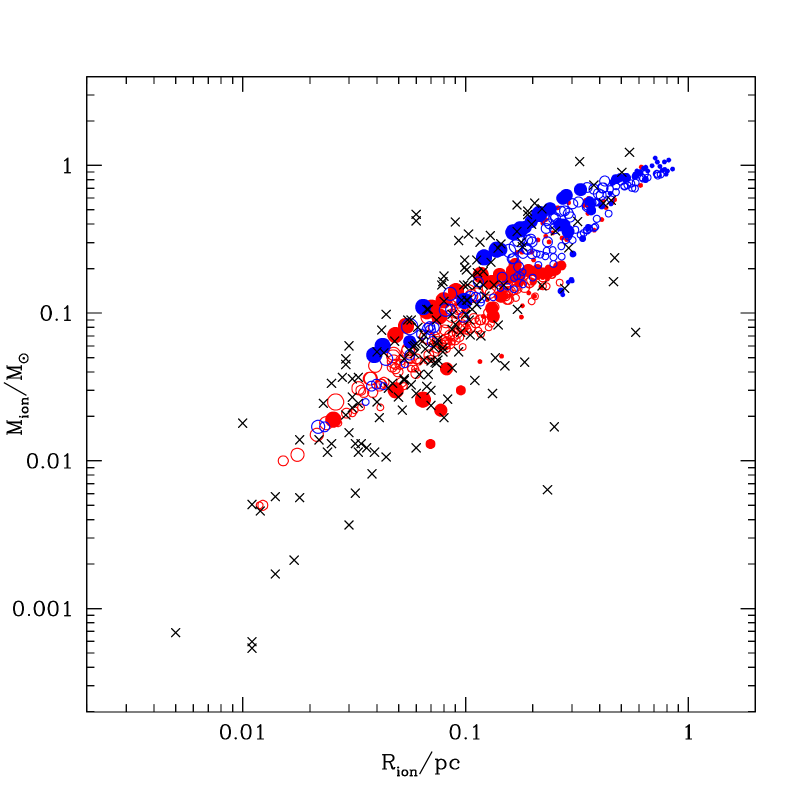
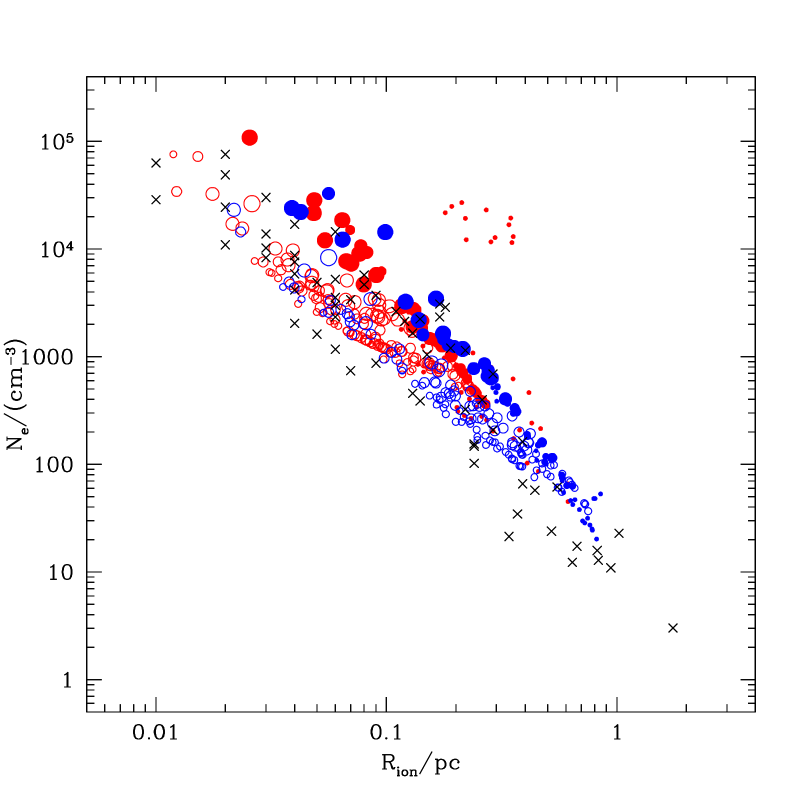
Figures 4–6 display how synthetic samples of PNe distribute over a few relevant diagrams, where observed PNe are found to follow clear correlations between the involved nebular parameters, namely: the ionised mass, the nebular radius, the electron density and specific intensity line ratios. For a complete discussion of the diagrams we refer to Paper I, where the empirical data are compared to predictions of individual parameters as a function of the PN age for a representative set of PN models. In our present study, the comparison is instead performed in terms of statistical properties, with the aid of synthetic populations of PNe.
A few remarks should be made at this point. First, we see that the synthetic samples recover the observed data quite well, which confirms the good agreement already obtained in Paper I.
For the ionised mass-radius and electron density – radius relationships (Figs. 4 and 5) we have the interesting result that, for the given set of adopted parameters, the observed excursion in radius is accounted for by including both H- and He-burning tracks, the latter group mainly contributing at larger radii. This is explained by the larger evolutionary timescales of the He-burning stars, so that more expanded nebulae are expected at given ionised mass. We also note that the observed points at lower masses in Figs. 4 could be recovered by widening the selection criteria in our simulated sample, i.e. including also PNe that are fainter than (which is our present upper limit in magnitude).
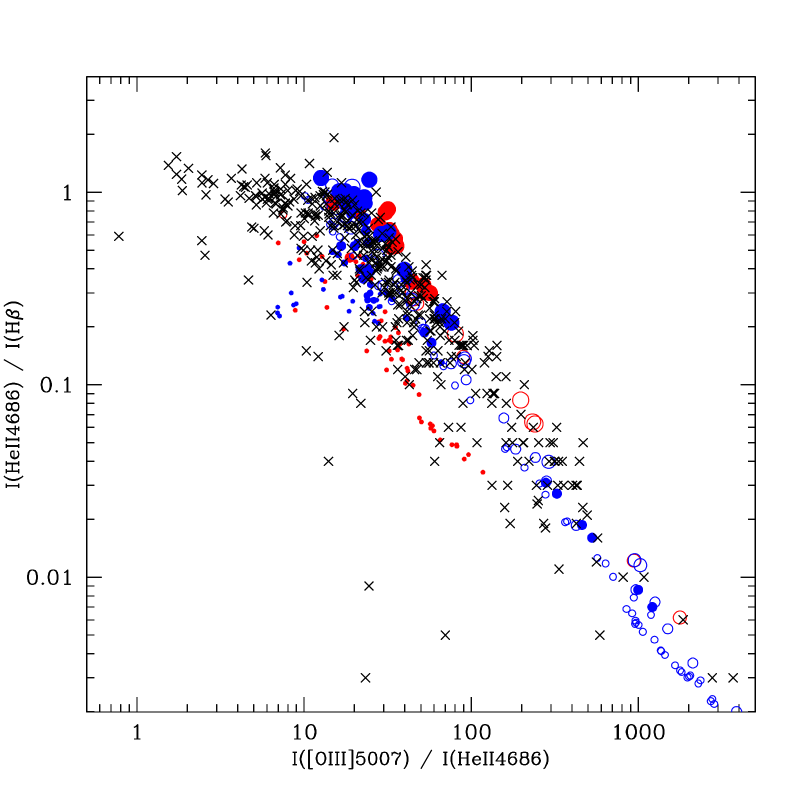
The empirical anticorrelation between the He ii and O iii line intensities, displayed in Fig. 6, is well reproduced by the synthetic sample for metallicity , which however follows a narrower relationship than observed. A larger dispersion is obtained by a simulated PN sample with the same parameters but for a lower metallicity, i.e. (see Fig. 7). Intepreting this result in terms of the oxygen abundance O, we may derive the indication that Galactic PNe derive from stellar progenitors with lower O than assumed in the solar-metallicity models (Anders & Grevesse 1989). To this respect, it is worth recalling that, according to the recent determination by Allende Prieto et al. (2001), the Sun’s oxygen abundance is lower by about 0.2 dex than previous estimates (e.g. Anders & Grevesse 1989), that are actually adopted in our solar-metallicity models.
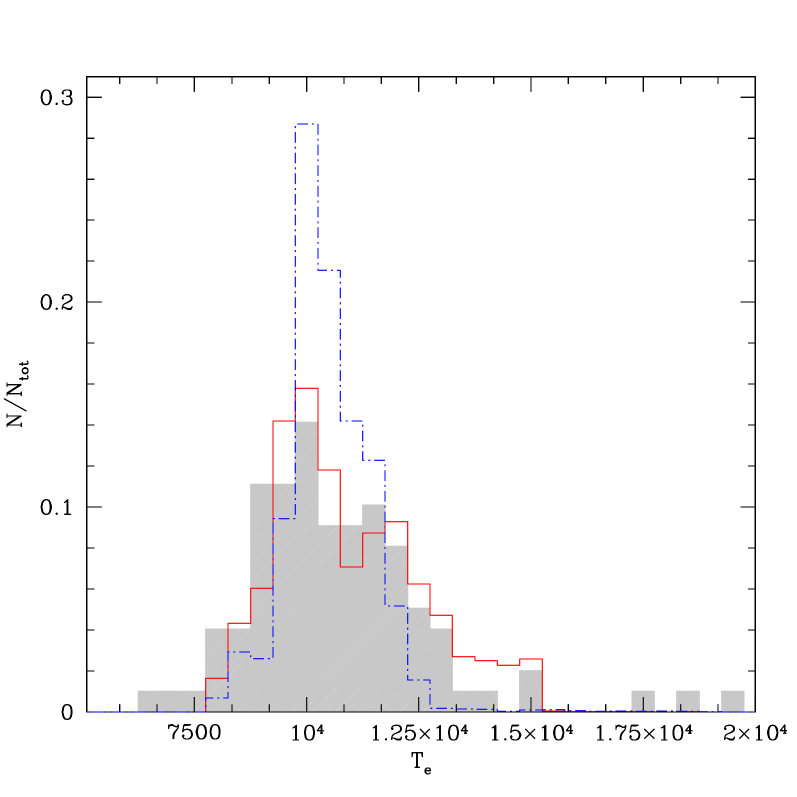
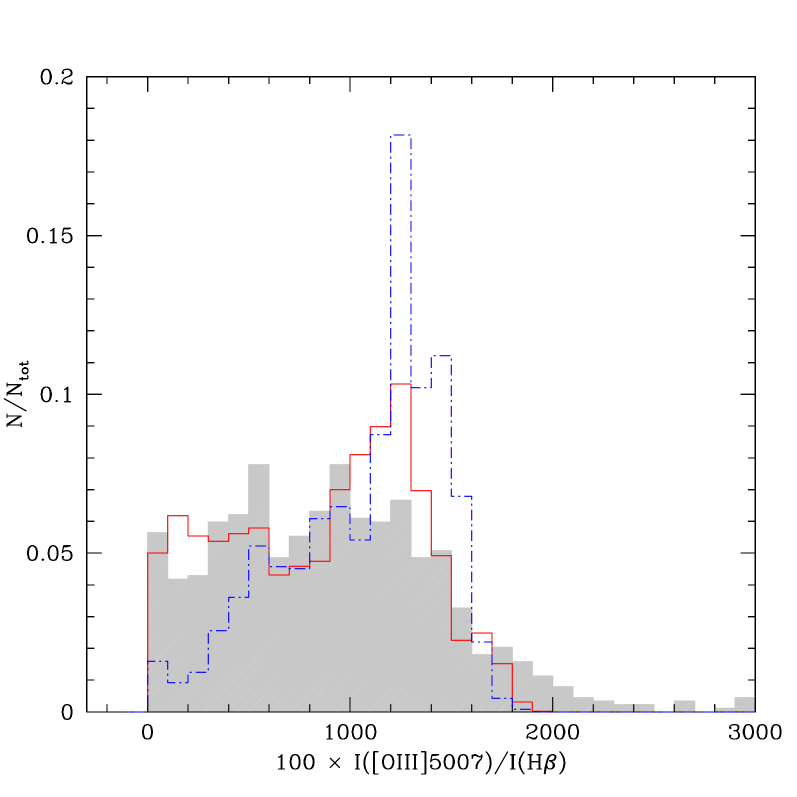
Finally, Figs. 8 and 9 show the comparison between observed and predicted distributions of two relevant quantities, namely: the electron temperature and the line ratio , on the scale . The empirical data refer to samples of Galactic PNe.
As already mentioned, the electron temperature is a critical quantity when dealing with the intensities of collisionally-excited lines, such as O iii. It follows that the distribution of represents an important observable to test our PN models, particularly in relation with the O iii PNLF. We see in Fig. 8 that the comparison turns out successfully as models are able to recover the location of the distribution peak, centered at around K. We also notice that the the H-burning set of models appears to describe well all the main features of the observed histogram, the He-burning set populating a narrower range than observed.
The distribution of the O iii intensity relative to also represents a relevant constraint to model predictions. It is worth remarking that a satisfactory reproduction of the observed data is naturally obtained with our PN models – mostly the H-burning set – without introducing any additional assumption or free parameter. Again, this sets another important improvement on previous studies of the PNLF (e.g. Méndez & Soffner 1997), in which the reproduction of the distribution – without the use of a photoionisation code – is derived analytically and it requires a number of calibration steps, i.e. the values are adjusted during the simulations in a fashion depending on the mass of the central star and its position in the H-R diagram.
4 Properties of synthetic PNLFs
In this section, we will discuss the dependecy of the PNLF cut-off on several parameters. With the aid of our models, we start answering the most basic question, namely which stars produce the PNe populating the cut-off (Sect. 4.1). Then, we analyse the intrinsic dependencies on two poorly known model parameters, namely the dominant nuclear burning regime of post-AGB central stars (Sect. 4.2) and the transition time (Sect. 4.3). Finally, we move to investigate the effect of two genuine parameters of stellar populations – that are likely to vary from galaxy to galaxy –, namely age and metallicity (or rather the oxygen abundance) of PN progenitors (Sects. 4.4 and 4.5, respectively).
4.1 Which PNe form the cut-off ?
This simple and basic question has received different answers by different authors. Just to mention two of them, Méndez et al. (1993) conclude that the cut-off PNe are optically-thin objects, whereas Dopita et al. (1992) derive that some of the brightest LMC PNe are optically thick. Méndez et al. (1993), Méndez & Soffner (1997), and Dopita et al. (1992) conclude that the cut-off PNe are young objects, at least in star-forming galaxies like the LMC (i.e. Gyr), whereas Ciardullo & Jacoby (1999) argue that, due to circumstellar extinction mainly affecting the most massive AGB stellar progenitors, the brightest observed PNe in galaxies have always higher ages (i.e. Gyr). In our models, we attempt to answer this question just by analysing the brightest PN models in our available grids, without making any additional assumption about their properties.


We start by considering Fig. 10 that displays the run of versus age, for the grid of , yr, H-burning tracks. This grid was chosen mainly because it presents, for the case of continuous SFR, a cut-off magnitude (see Fig. 15, continuous-line histogram), very close to the observationally-calibrated value of Ciardullo et al. (2002). From Fig. 10 it turns out that this cut-off coincides with the maximum reached by the 2.5 track, which defines the characteristic progenitor stellar mass of cut-off PNe. Similar results are obtained for each grid of tracks; what varies from case to case is just this characteristic mass, which tends to be slightly lower for higher thansition times and for He-burning tracks. Anyway, in all cases this characteristic mass is comprised between 2 and 3 .
What determines the O iii maximum luminosity of the individual tracks ? For most of them, this maximum occurs when the PN switches from optically thin to optically thick, i.e. when changes from to . In fact, at that point the central star starts dimming towards its WD cooling track, no longer providing enough photons to completely ionize the nebula, so that the Strömgren sphere suddenly starts decreasing. At the same time the O++ region also starts receeding in radius, and hence to the O iii luminosity decreases.
From these considerations it follows that the PNe observed close to their maximum O iii luminosity, can be either optically thin or thick, depending on whether they are evolving along the ascending or descending part of their tracks in Fig. 10. This implies that both thin and thick nebulae should be present in the PNLF cut-off, the frequency of optically-thin objects likely being higher given the faster evolution evolution of in the descending branch. In this detail, our results differ from the assumptions/conclusions of both Méndez et al. (1993) and Dopita et al. (1992).
At this point it is natural to wonder: Why is the absolute minimum value attained just by the 2.5 tracks ? The answer to this question is not trivial, since a lot of factors are envolved. Our proposed explanation is based on the temporal behaviour of three quantities, that are plotted in Fig. 11 as a function of the PN age for a few models with CSPN masses around 2.5 . They are:
I) The ionisation rate for O++, that expresses the number of available ionising photons emitted by the central star per unit time. This rate is given by , where is the stellar radius and is the ionising flux. We recall that, due to the similarity between their ionisation potentials, O++ and He+ have similar ionisation fluxes (see Paper I). Therefore the behaviour of the ionisation rate for O++ mimics that of He+, which is displayed in Fig. 11. We see that larger ionisation rates correspond to more massive stellar progenitors, as they produce more massive and luminous central stars. Therefore, models with progenitor masses of 3.0 and 3.5 could be potentially brighter in O iii than the 2.5 model.
II) The maximum nebular mass available to the O++ ionising photons. This is given, at each instant, by the mass of the shocked shell, , which is steadily increasing with time. It is clear that, in principle, a higher O iii luminosity is favoured at larger .
III) The electron density, . In fact, it is well-known that electrons do play the major role in populating by collisions the upper level of O iii so that the higher the stronger the spectral line. This holds until a critical density is reached, above which the collisional de-excitation becomes important and the the intensity of O iii starts to weaken. Moreover, we see that steadily decreases with time.

The answer to the initial question rests on the behaviour of all above quantities, whose evolution is controlled by the timescales of both central star and nebular dynamics. From Fig. 11 it turns out that during the initial PN evolution, i.e. including the stages that bracket the ionisation rate’s maximum, only a fraction of the hydrogen ionising photons are effectively absorbed by the nebula that will be optically thin (), while a large fraction will contain O++. The comparison between the panels for different masses in Fig. 11 then reveals the following.
On one hand, for the most massive tracks ( ) the evolutionary rate of the central star is so rapid that, during the stages of significant ionisation rate, the shocked shell has engulfed a relatively little amount of mass. It means that, despite the large availability of energetic photons to ionise O++, this is effectively reduced by the little availability of nebular matter. Additionally, we notice that at these ages a further weakening of O iii emission may be produced as the nebular densities approach, or even overcome, the critical limit for collisional de-excitation of the O iii upper level, i.e. . All these factors concur to prevent PN models, having progenitor stars with , from becoming brighter in O iii than those produced by stars with .

On the other hand, for less massive tracks ( ) there is always a coincidence of both significant ionisation rates and relatively large nebular masses, due to the slower evolutionary rate of the central star. However, the corresponding PNe are still fainter in O iii than the model because of the lower ionisation rates.
In summary, PN tracks with progenitors masses of present the right combination of the dynamical timescale of the nebular expansion (that determines and ), and the evolutionary timescale of the central star (that determines ), to maximize the O iii luminosity.
An additional effect in determining the PNLF cut-off is related to the PN lifetime. PNe produced by more massive progenitors stars are characterised by shorter and therefore, according to Eq. (3), they contribute with fewer objects to the PNLF. In this regard, it should be noticed that, in their very early evolution, some of the PN tracks of higher initial masses ( ) may present spikes as bright as 222These spikes show up mainly in the sets of PN models with yr.. However, these spikes do not affect at all the position of the PNLF cut-off because they are too short-lived ( yr).
Finally, we recall that 2.5 tracks correspond to main sequence lifetimes of just yr. The minimum magnitudes become progressively fainter as we go to tracks of lower masses (larger turn-off ages). These facts have immediate implications for the dependence of on the galaxy’s star formation history (Sect. 4.4).
The next related question is now: What are the masses of the CSPNe forming the PNLF cut-off ? According to our AGB calculations (Marigo et al. 1999) a star with initial mass of and metallicity ends its evolution as bare carbon-oxygen core of about (see Fig. 12). In Fig. 13 we show how the mass distributions of the CSPNe are predicted to vary if a limit minimum O iii magnitude is applied to the synthetic samples, i.e. we consider only PNe brighter than . We see that at decreasing , the peak of the theoretical distribution shifts towards larger masses, for less massive and fainter CSPNe fall outside the adopted luminosity cut. As expected, in the extreme case of (close to the observed PNLF cut-off) the peak is centered just at (corresponding to the 2.5 progenitor star). An interesting point to be noticed is that, contrarily to what often assumed, the CSPN mass distribution appears to differ from that of white dwafs (bottom-right panel of Fig. 12). The latter is in fact characterised by a sizeable tail towards larger masses, which is not expected in the case of CSPNe. This can be understood by considering that the evolutionary speed of white dwarfs slows down so much that their lifetimes can be considered practically infinite (regardless the mass of the stellar progenitors), which determines a sort of accumulation of objects in the high-mass bins. Other differences between the mass distributions of CSPN and white dwarfs may be introduced by observational biases, e.g. selection effects against the detection of PNe with slowly evolving, low-mass, central stars (Stasińska et al. 1997; see also Phillips 2000 for a critical analysis of the empirical method used to evaluate ).
4.2 Dependence on H/He burning tracks

As discussed in Sect. 2.4, the relative proportions of PN H- or He-burning nuclei is essentially unknown. An estimation is given by Dopita et al. (1997) who derive a frequency ratio He/H , basing on evolutionary timescales and nebular sizes for a sample of 15 LMC PNe.
In general, He-burning tracks are characterized by longer evolutionary timescales and fainter luminosities than those of H-burning models. (see also Paper I). The resulting evolution of is illustrated in Fig. 14, that should be compared to the corresponding figure for H-burning tracks of Fig. 10. It is evident that He-burning PNe evolve slowlier, and preferentially in optically thin conditions. However, the characteristic masses of the PNe at the cut-off change only slightly.

Figure 15 shows a direct comparison between PNLFs derived from H- and He-burning tracks, assuming , yr, and continuous SFR. The shape of the PNLF somewhat changes, but not that dramatically, so that a fitting of Eq. (2) to the brightest PNLF bins is straightforward. In fact, an unweighted least-squares fitting of Eq. 2 – performed on a PNLF with 0.2-mag wide bins, and limited to the brightest 1-mag interval – produces for the H-burning case, and for the He-burning one, i.e. yielding almost identical values. Similar results are obtained by using different transition times and metallicities, while adopting either H- or He-burning tracks.
4.3 Dependence on the transition time

Whereas there is no reason to believe that this is the case, the lack of robust predictions for the transition time (see Sect. 2.4) as well as practical reasons impose that we first simulate PNLFs under the assumption is the same for all stars. In fact, when we do this with our available tracks (for and yr), we obtain the results depicted in Fig. 16: a high dependence of the cut-off magnitude on the transition time. This can be explained by the large impact of on the timescale for nebular expansion, especially for PNe of higher masses, whose evolutionary timescales are comparable to itself.

In order to investigate further this behaviour, we computed additional sets of models for , H-burning tracks, and and yr (Fig. 17). If we consider PN samples that cover all ages, the cut-off exhibits a very regular trend, becoming brighter at shorter . The maximum O iii brightness a PN sample may attain, however, will be limited by the fact that cannot be shorter than a few hundreds of years. The value of yr, succesfully tested in Paper I and in this work on a number of Galactic PN observables (see Sect. 3.2), is already an extremely low value if compared to present results of evolutionary calculations (e.g. Vassiliadis & Wood 1994). Actually, it yields values that are slightly too bright, i.e. for yr, than the observationally-calibrated , while somewhat lower values are obtained with yr and yr. On the other hand, longer than yr would produce too faint , i.e. . In summary, according to our present PN models, the observed cut-off magnitudes , for galaxies with ongoing SFR, will be obtained for values between 500 and 1000 yr.
At this point two important remarks are worthy to be made. First, as far as the bright PNLF cut-off is concerned, the indications we derive on should be taken as a sort of calibration that applies only to those PNe that actually form the cut-off, namely PNe with relatively massive central nuclei (), produced by relatively massive () and young ( Gyr) stellar progenitors. In this range our results agree with the predictions for derived by Stanghellini & Renzini (2000) from analytic relations (see their figure 11). It is clear that, more realistically, yr should be associated to PNe with lower-mass stellar progenitors, but this would not affect at all our results on the cut-off brightness.
Second, a further support to our estimated ranges for and PN phase duration (see for instance Figs. 10 and 14) comes from the kinematic ages (from less of yr up to almost yr) empirically derived by Dopita et al. (1996) for a HST sample of 15 PNe in the LMC. Many of these PNe are, in fact, classified as Peimbert type I PNe, suggesting that they likely hide massive central stars.
4.4 Dependence on age of the last burst of star formation


The age of PN progenitors has long been suspected to have a major effect on the cut-off magnitude (Dopita et al. 1992; Méndez et al. 1993; Stanghellini 1995; Jacoby 1996). Age is closely related to the turn-off mass, and to the remannt mass via the IFMR. For any reasonable relation of this kind, at older ages only PN central stars of lower mass, and hence of lower intrinsic luminosity, should form. Our computations fully confirm the expected trends.
To illustrate the effect of the age, we simulate PN samples adopting a SFR which is constant over the age range . The upper limit, , denotes the age of the oldest stars in a galaxy, and here it is assumed constant and equal to 12 Gyr. The lower limit, , is the age of the most recent burst of star formation, and it is let vary between – for systems with ongoing star formation, namely the disk of spirals and irregular galaxies – and – for predominantly old systems, like haloes and bulges, and old ellipticals.
The results for the PNLFs are illustrated in Fig. 18. We clearly see that, as increases, the PNLF becomes progressively depleted of its brightest PNe, and the cut-off shifts to fainter magnitudes. At ages older than a few Gyr, the PNLF may also change its the characteristic morphology, i.e. shaping like a plateau with a sharp cut-off in place of the smoother trend that is seen for younger .
Figure 19 shows the behaviour of the PNLF over the brightest magnitude bin as a function of age. This bin is simply defined as the one of the steepest change in the logarithm of number counts. It behaves similarly to the cut-off , but it is systematically fainter than that quantity by 0.2 to 0.4 mag333The reason why we plot the brightest magnitude bin, is that it behaves in a much smoother way than , for all values of . In fact, for older than say 4 Gyr, the PNLF often presents too sharp a cut-off followed by a shallow plateau, and a good fitting of Eq. (2) is not possible.. As a matter of fact, the fading of the brightest magnitude bin starts just after becomes older than the age of the brightest PN progenitors – that means after Gyr, which is the turn-off age of stars. Then, at older , the dimming of the cut-off is clearly seen for all ages.
Finally, we remark that on the base of our H-burning PN models, the fading rate of with is of roughly mag/Gyr. This rate is higher than those predicted by other authors (e.g. Jacoby 1996) with the aid of simpler models.
4.5 Dependence on metallicity

Figure 20 illustrates how the PNLF is predicted to vary with metallicity according to our present PN models, for the cases of and Gyr. It can be noticed that our models exhibit an appreciable dependence of on metallicity. In the case of continued SFR, this dependence is not even monotonic with metallicity, being the cut-off mag fainter than those found for and . For Gyr, instead, we find that more metal-rich PN samples correspond to fainter cut-offs. The same behaviour is shared by all our sets of models.

These results may seem somewhat unexpected, considering the previous claims for a weak dependence of the cut-off on metallicity (e.g. Ciardullo et al. 2002). To understand this point, first it is worth briefly recalling the origin of these claims. The most comprehensive analysis of the [O/H] dependence is carried out by Dopita et al. (1992) on the base of photoionisation models of optically-thick nebulae. It is found that the peak conversion efficiency of stellar photons to nebular O iii ones is given by
where [O/H] is the oxygen content in the nebula scaled to the Sun’s. By using this formula, together with the inferred values for the absolute luminosity of the star at the PNLF cut-off in a few galaxy systems (table 2 in Dopita et al. 1992), one can derive the following relation, quoted by Ciardullo et al. (2002):
| (5) |
which has indeed a weak dependence on the oxygen abundance, as displayed in Fig. 21 (filled circles). We should however emphasize that this latter relationship holds only under a precise condition, namely the LMC, SMC, and Galactic Bulge contain young and massive PN progenitors, of ages similar to 0.8 Gyr. If young stars were not present in the galaxies studied by Dopita et al. (1992), the fitting relation by Ciardullo et al. (2002) would not be valid, as it can easily be understood by looking at the empty circles in the figure. Another interesting point is that, according to Eq. (5), should reach a minimum for near-solar metallicities, contrarily to our findings.
Following Ciardullo (2003), the results of Fig. 21 are the consequence of two competing factors: (1) since oxygen is one of the main coolants of a nebula, the flux in O iii increases only with the square root of the oxygen content (Jacoby 1989); and (2) the UV flux coming from the CSPN decreases with metallicity. This latter trend, actually, is dictated by the earlier onset of the superwind, and hence the lower final stellar masses and luminosities, that are expected in AGB models of higher metallicities.
After these considerations, how can we understand our results of Fig. 20 in terms of basic stellar parameters ? First of all, in agreement with other studies (see e.g. Lattanzio 1986; Vassiliadis & Wood 1993; Wagenhuber & Groenewegen 1998; Marigo 2001), our underlying AGB models (Marigo et al. 1999) present a clear trend of decreasing final masses at higher metallicities, as depicted in Fig. 12. This behaviour ensures that, for given stellar age and initial mass, lower-metallicity PNe will have central stars with higher masses and hence UV fluxes, in agreement with Ciardullo’s reasoning. We also remark that although the shape of the IFMR depends on a number of model details – such as the presence of convective core overshooting in previous evolutionary phases, the number and efficiency of third drege-up events, etc. – the key-role should be ascribed to the adopted prescription for mass loss as shown, for instance, by Groenewegen & de Jong (1994).
The second important effect to be considered is the change of oxygen content [O/H] with iron content [Fe/H]. The initial main-sequence [O/H] values in our stellar models are simply scaled to the Sun’s determination444We recall that, following the usual designation, the abundance of a metal, , is solar scaled when obeys the relation according to Anders & Grevesse (1989), thus yielding for , respectively.
It is worth recalling that stellar evolution models predict the surface oxygen abundance remains essentially unaltered after the first and second dredge-up episodes (see e.g. Girardi et al. 2000), while it may be affected to some extent during the TP-AGB phase by the third dredge-up, and possibly by hot-bottom burning.

This latter process takes place in the most luminous and massive TP-AGB stars (with ) and it may deplete the stellar surface of oxygen (via the CNO cycle) in the case of high efficiency and sufficiently long duration of the CNO nuclear reactions. This circumstance is not met in any of the TP-AGB models here considered.
On the contrary, the third dredge-up may cause the surface oxygen content to increase with time, together with the abundances of other elements like carbon and helium. The degree of oxygen enrichemnt in the envelope basically depends on three factors, namely: the efficiency of the dredge-up, the chemical composition of the dredged-up material, and the total number of dredge-up events experienced during the TP-AGB phase. Referring the reader to Marigo et al. (1999) and Marigo (2001) for more details about the TP-AGB models employed in this work, we recall here that 1) the efficiency of the third dredge-up is parameterised by a quantity , calibrated to reproduce the luminosity functions of carbon stars in the LMC and SMC; the oxygen abundance in the dredged-up material is assumed of just (in mass fraction), that represents the standard order of magnitude obtained by most nucleosynthesis calculations of thermal pulses (e.g. Boothroyd & Sackmann 1988; Karakas et al. 2002; but see also Herwig et al. 1997 for different results).
Despite this rather low value, it turns out (see Fig. 22) that the predicted [O/H] abundances at the end of the TP-AGB – and during most of the PN phase – may significantly differ from the initial main-sequence values, the deviation being more pronounced in models of lower metallicities because of the higher dredge-up efficiency and larger number of thermal pulses. Moreover, we notice that [O/H] does not vary at all at lower initial masses, say (depending on metallicity), since the third dredge-up is not predicted to take place in those models.

Figure 22 clearly shows that the assumption of , or that [O/H] is the same as in the H ii regions of a galaxy, may be not suitable for PNe – unless oxygen dredge-up does not occur in AGB stars, which is unlikely considering our present understanding of stellar evolution. Moreover, the change of [O/H] is not necessarily monotonic with [Fe/H]; in fact most of our models with present [O/H] values higher than those found at , but still lower than those for . A monotonic behaviour of [O/H] with (and equivalently with [Fe/H]) is recovered only by models with lower masses – hence older progenitors’ ages –, that do not experience the third dredge-up.

In summary, if one accounts for the changes of [O/H] at the surface of stars with different masses and metallicities in the framework of the present stellar evolution models, the resulting dependence of [O/H] (in PNe) with metallicity cannot be expressed by a simple scaling relation, rather it is characterised by a more complex behaviour as, for instance, illustrated in Fig. 22.
Such behaviour gives origin to the non-monotonic trend of with [O/H] displayed in Fig. 23 (empty squares) which, in turn, reflects in the non-monotonic trend of with age. In order to illustrate it better, Fig. 24 shows the peak magnitude for all our models, as a function of CSPN mass. The similarity of the curves with the behaviour of [O/H] shown in Fig. 22 is evident.
To further investigate the sensitivity of to the actual O/H in PNe, we have performed a test on our set of , yr, H-burning models, simulating a lower main-sequence oxygen abundance. In practice, we have re-calculated the photoionisation structure of these PN models providing CLOUDY with an input [O/H] lowered by a constant quantity of dex555 The choice of this value is motivated by the recent re-determination of the Sun’s oxygen abundance by Allende Prieto et al. (2001) that is lower by just dex than previously estimated by Anders & Grevesse (1989). , so that the [O/H] curve for in Fig. 22 would be simply shifted downwards by this amount while keeping its shape unaltered. It follows that the new [O/H] curve for would come closer to that for the set at the typical CSPN masses () of the cut-off PNe (in the case of continous SFR, or equivalently for ).
With the aid of PNLF simulations for the new oxygen abundances we obtain that such decrease in [O/H] causes a dimming of the PNLF cut-off amounting to mag for , and to mag for Gyr. These numbers correspond to an incremental ratio of mag dex-1, which predicts the right order of magnitude required to explain our results of Figs. 20, 21, and 24, i.e. in particular the difference in between the PNLFs calculated at different metallicities.
This significant sensitivity of to [O/H] displayed by our models raises a few considerations of general validity. In fact, it appears clear that the predicted values of should crucially depend on:
-
•
The assumed value for the initial main-sequence oxygen content, hence the adopted solar oxygen abundance (if solar-scaled compositions are assumed, as usually is the case). We remark that the determination of the Sun’s oxygen abundance has changed dramatically over the years – i.e. from in Anders & Grevesse (1989) to in Allende Prieto et al. (2001). This alone would cause a change of dex in our scale of oxygen abundances. As mentioned above, a systematic decrease of dex in our O abundances – necessary if we were to bring our models to the solar-composition scale of Allende Prieto et al. (2001) – would cause a dimming of mag in our values.
-
•
(2) The choice of the input TP-AGB models in the PNLF simulations. In particular, the predictions of [O/H] in PNe are importantly affected by several (often poorly known or improperly assumed) model details such as: inter-shell nucleosynthesis during thermal pulses, efficiency of the mixing episodes, mass-loss prescrition, assumed molecular opacities, etc.
Finally, we recall that there is an additional reason that likely concurs to produce the differences in the predicted metallicity dependence of the PNLF cut-off observed between ours and the one derived from Ciardullo et al. (2002) on the base of Dopita et al.’s (1992) work. In fact, while we find that both optically-thin and thick PNe should populate the PNLF cut-off, the analysis by Dopita et al. considers only the behaviour of optically thick objects.
5 Discussion
5.1 Summary of main dependences
In this paper we have carried out a theoretical investigation of the O iii PNLF and its sensitivity to various stellar evolution and population parameters. To this aim a detailed photoionisation code (CLOUDY) has been incorporated into our synthetic PN model (Paper I), so that we can rely on a simple but quite complete picture of PN evolution, which allows a satisfactory reproduction of many PN observables like well-known correlations involving nebular radius, ionised mass, density, intensity line ratios, etc.
In particular, major attention has been paid to the modelling of the bright cut-off of the PNLF, that is claimed to be a powerful distance indicator in virtue of its observed invariance in host galaxy systems of different ages and metallicities. The results of our analysis on the PNLF cut-off can be summarised as follows. In order of decreasing importance, the main parameters affecting the cut-off magnitude are:
The age of the last burst of star formation, .
It turns out that, over the entire range of old and intermediate ages (say from 13 to 0.1 Gyr; see Fig. 18), the possible brightest PNLF cut-off is obtained and remains invariant as long as Gyr, that is if stars with initial masses (and final masses ) are presently evolving through the PN phase. At older ages, for Gyr, we predict a sharp dimming of the PNLF cut-off, as it becomes populated by much fainter PNe evolved from lower mass progenitors.
The transition time, .
This is one of the most ill-known quantities on the theoretical ground, mainly reflecting major uncertainties about stellar mass loss during the initial post-AGB stages. In addition, should be affected by large variations depending on stellar mass and phase of the last thermal pulse on the AGB. Given these premises, our assumption of constant transition time may appear too simplicistic, nevertheless we are still able to derive a few relevant indications, namely: i) In the case of continuous SFR, the PNLF cut-off depends only on of those CSPNe effectively populating it (with masses around ). A satisfactory reproduction of the observed cut-off brightness is obtained with yr. Conversely, the details of the PNLF cut-off are insensitive to of fainter, slowly evolving PNe originated from lower-mass progenitors. ii) In the case of Gyr the dependence of the cut-off on is weak. In fact, this time the cut-off PNe correspond to lower-mass central stars, for which the condition is usually met for reasonable values of the transition time. In other words, the effect of on the PNLF cut-off is practically smeared out by the long evolutionary timescales of the PN phase.
The nuclear burning regime of the central star.
Unfortunately, the relative contributions of H- or He-burning central stars to a PN population are still poorly determined. With the aid of PNLF simulations obtained assuming that all CSPNe are either H- or He-burning central stars, we find that variations in the the cut-off brightness remain moderate at younger ages, instead becoming huge at older ages. In general, we find that the PNLF cut-off for H-burning central stars is brighter than that for the He-burners, since these latter are characterised by slower evolutionary rates at fainter luminosities. Anyway, it is reasonable to think that both H- and He-burning central stars will be present in the observed galaxies, so that the brightest ones – i.e. the H-burning – may actually determine the observed PNLF cut-offs, as well as the age-sensitivity of the sample.
The metallicity.
Instead of metallicity, we should refer, more correctly, to the dependence on the oxygen content [O/H] . Oxygen actually plays a major role in the nebular cooling, and its abundance directly affects the intensity of the O iii line. The oxygen content in PNe traces the metallicity of the parent galaxy only assuming that the PN stellar progenitors keep their initial surface oxygen abundance unaltered during the entire evolution up to the PN ejection. In the framework of present stellar evolution models, some increase of oxygen may be produced by the third dredge-up occuring during the TP-AGB phase, the degree of enrichment being more pronounced at lower metallicities. Moreover, the predicted [O/H] in PNe depends on the assumed initial composition of the gas, that is usually assumed to be solar-scaled (). All these factors yields a metallicity dependence of the cut-off that is not monotonic and also changes with age.
5.2 On the claimed age invariance of the PNLF cut-off
After this brief recapitulation of the main dependences in the models, let us now discuss to more detail the claimed age-invariance of the cut-off. For the cases with continued SFR, our models predict values that are very close to the observed one for the LMC and other similar galaxies in the Local Group. This, and the strong decay of with age, would suggest that we have a natural explanation for the cut-off position in star-forming galaxies, it being determined by stars with initial mass of . This is also the conclusion reached by Dopita et al. (1992), based on a detailed comparison between PN models and observations in the Magellanic Clouds.
However, considering that sizeable changes of are expected depending on various model details, and mostly on the age of PN progenitors, how can we reconcile such predicted variations with the observational indications of a fairly constant PNLF cut-off brightness, common to galaxy systems of all types ? In fact, an important point is that elliptical galaxies in groups appear to share similar cut-offs with spiral galaxies.
At this stage, it is worth recalling and discussing the different interpretations to this issue that have been proposed in the recent literature, referring mostly to Jacoby (1996) and Ciardullo (2003), who provide two extended reviews on the PNLF as a distance indicator. Actually, the two reviews contain two different, perhaps complementary, explanations to the age-invariance of the cut-off brightness.
Following Jacoby (1996, and references therein) the constancy of the PNLF cut-off, over the age range of Gyr, should be essentially ascribed to the extremely narrow distribution of central star masses, say . This would correspond to initial masses in the range according to the semi-empirical IFMR for the solar neighbourhood (Weidemann 1987; see also Herwig 1997). Our AGB models for solar metallicity (see Fig. 12) recover well this part of the observed IFMR, nevertheless the present PNLF simulations predict, on the contrary, large variations of the cut-off over the above age range. Actually, the cut-off brightness seems somehow to flatten over the age range Gyr (see Fig. 18), but such plateau is incurably fainter than the observed cut-off. Moreover, we notice that metallicity effects are likely to affect the IFMR, i.e. larger final masses at lower metallicites.
Ciardullo (2003), on the base of Ciardullo & Jacoby’s (1999) paper, suggests that the stringet correlation between mass of the central star and circumstellar extinction (due to dusty envelopes ejected during the AGB phase) should prevent high-core mass PNe from populating brighter bins beyond the observed PNLF cut-off. In other words, over-luminous Population I PNe (evolved from young and massive progenitors, hence potentially detectable as very bright O iii sources in spiral and irregular galaxies) would be efficiently extinguished below the observed cut-off.
To this respect we notice that there is an additional factor, other than extinction, that would locate high-core mass PNe at fainter magnitudes than the cut-off. To this respect, we should consider that one of the underlying assumptions in Ciardullo & Jacoby (1999) analysis is that a constant fraction of the stellar luminosity is reprocessed into O iii emission, which yields a positive correlation between the mass of the central star and the maximum O iii luminosity emitted during the PN phase. Our calculations, instead, show that this correlation is not monotonic, as the maximum O iii luminosity presents a peak at central star masses of about , then declining at larger masses. This implies that, even without the effect of circumstellar extinction, PNe with high-mass central stars would not contribute to the PNLF cut-off because intrinsically fainter.
In conclusion, we should stress that our difficulty to explain the age-invariance of the PNLF cut-off could not be solved by including the effect of circumstellar extinction, as proposed by Ciardullo & Jacoby (1999). In fact, we do not have any need to make PN models with massive progenitors fainter, as required by Ciardullo & Jacoby (1999), but rather to make PN models with less massive and old progenitors several magnitudes brighter. How to obtain this effect with the aid of consistent PN models, is still to be investigated.

5.3 The dependence on galaxy type: the age alternative
The PNLF is expected to depend on the galaxy type and even more relevant here on the age of the stellar populations. In order to discuss this point, we start by presenting in Fig. 25 the predicted PNLFs for two template galaxy models representing two extreme cases: massive ellipticals and spirals. The elliptical galaxy corresponds to the model from Chiosi & Carraro (2002), in which the star formation is all concentrated in the first 2 to 4 Gyr of the galaxy life; during the same period its metal content rapidly increases up to near-solar values. The spiral galaxy model, instead, is derived from chemical evolution models of our own Galaxy: it corresponds to model B from Portinari et al. (1998). The star formation in this case is characterized by a initial rapid increase during the first 3 Gyr, followed by ever-decreasing, but continuous, SFR. The AMR is derived from models but is in excelent agreement with observational data from disk stars.
These template galaxy models show clearly a difference of about 5 mag between the cut-off position expected (and observed) in spirals at , and the one expected in old ellipticals at . This difference follows, essentially, from significant age dependence expected by our models (see Fig. 19), and is in clear contrast with observational claims (see Sect. 1).

Thus, if ellipticals were systems consisting exclusively of old stellar populations, we could hardly explain the invariance of the cut-off. A viable explanation for the observed invariance is that the ellipticals with measured PNLFs may have had a burst of star formation in recent times, with ages close to 1 Gyr. In order to illustrate this possibility, in Fig. 26 we present a series of simulated PNLFs for galaxies having an intense burst of SFR 10 Gyr ago, followed by a more recent one at the age , which involved just 5 of the stellar mass in the galaxy. It can be noticed that the shape of these PNLFs does change a lot, compared to the continuous-SFR PNLFs illustrated in Fig. 18. Actually, in the cases of bursting SFR, the PNLFs present a brighter component, due to the more recent burst, that displays a cut-off behaviour over the brightest bins, while continuously declining towards fainter magnitudes. Then, at about , a second, highly-populated and faint component builds up as a consequence of the old burst. We also notice that if just the brightest PNe were observed in such galaxies, the derived cut-offs would be exactly those caused by the youngest burst. Only deeper observations could then reveal the different shape of these brighter components, and the sharp rise – actually a second cut-off – at . Therefore, if PNLFs are observed deeply enough they can give very valuable results about the star formation history during the last several billion years.
In summary, in the context of our PN models, the formation of the PNLF cut-off, observed in some elliptical galaxies as bright as in spirals, could be explained only invoking a recent burst of SFR, as young as Gyr, corresponding to stellar progenitors with initial mass of about , or correspondingly to CSPN mass of about .
Let us also clarify that a change of ill-known model parameters hardly would change this scenario. In fact, in order to reconcile our models with the claimed age-invariance of the PNLF cut-off, we would have to get much brighter PNe models at old ages. By using He-burning post-AGB tracks instead of H-burning ones, our old models become even fainter than above mentioned. Also, older PN models are little sensitive to the exact value of the transition time, and choosing these times much larger than 500 yr – as likely appropriate for models of lower mass – would also cause fainter old PNe models, instead of brighter ones.
The idea the early type galaxies may suffer secondary recent star formation activity has long been around in literature. It is hinted by the diagnostics of the line absortption indices on the Lick system, such as and/or , that are commonly considered as good indicators of the age of the most recent star forming episode (Bressan et al. 1996; Jorgensen 1999; Kuntschner 2000; Longhetti et al. 2000; Trager et al. 2000a,b; Vazdekis et al. 2001; Davies et al. 2001; Poggianti et al. 2001; Tantalo & Chiosi 2003), Further supported by evidences from various broad-band colors (Zabludoff 1996; Goto et al. 2003; Quintero et al. 2004; Fukugita et al. 2004), and finally found also in NB-THSP simulations of galaxy formation and evolution (Kawata 2001a,b; Carraro & Chiosi 2003; Kawata & Gibson 2003a,b). However, the constraint set by the PNLF cut-off luminosity is very demanding because it would imply that in all ellipticals showing bright PNs star formation activity should have occurred as recently as about 1 Gyr ago in order to reach the same luminosity of the ongoing star formation case as in spirals.
The question may be posed whether sampling ellipticals and spirals to derive the empirical PNLF, selection effects somehow favour those ellipticals with bright PNe, i.e. recent star formation, so that ellipticals with older stellar content and whence fainter cut-off luminosity for their PNLF are simply missed. This issue is not specifically mentioned in literature so that a clear answer cannot be given here.
The most puzzling aspect with the age interpretation is that there are some elliptical galaxies, for instance NGC4649, NGC4406, NGC4486, NGC1399, and NGC1404, which have bright PNs but yet possess broad colors and line absorption indices – for instance mean and mean – strongly indicating that only old stars are present, unless the last episode has involved less 0.05% of the galaxy mass as thoroughly discussed by Tantalo & Chiosi (2003).
A possible way to remove the theoretical discrepancy might be related to the IFMR and its dependence on metallicity. In practice, we could obtain much brighter PNe at old ages if their low-mass and metal-poor stellar progenitors had been able to build up relatively massive cores at the end of the AGB evolution, hence brighter CSPNe. Indeed a general trend of increasing final mass at decreasing is already predicted by our models (see Fig. 12), but the resulting effect on the PNLF cut-off is not strong as the lowest metallicity here considered is just . Additional calculations at lower metallicity are then required to test the above hypothesis. This analysis is in progress. Alternatively, we are left with the open possibilities that either the current models of PNs are still too simple and neglect some important effect (we are, however, confident that this is not the case), or some new type of old stars intervene in particular in the case of old elliptical galaxies in such a way they closely mimic the properties of classical PNs (investigation of this topic is currently underway).
6 Concluding remarks
In Paper I we had developed a theoretical model for synthetic PNe. In the present paper we use this model to predict properties of synthetic samples of PNe. In particular we investigated the PNLF of synthetic PN populations with regard to its shape, maximum O iii brightness, and how it depends on age and composition of the population as well as on assumptions necessarily entering our model. With respect to Paper I and in view of the importance of a reliable prediction of the emission properties of PNe, we extended our model by including the photoionisation program CLOUDY, thereby eliminating one of the free parameters, the electron temperature in the nebulae. The detailed radiation transfer treatment confirms that the assumption of an approximately constant of about in the dynamical part of the model is justified, at least within the accuracy required at this stage. Apart from free assumptions about age and composition of the population causing PNe, and about the SFH and IMF, the transition time remains the sole physical parameter for which we have only rough indications, and for which we would need additional theoretical calculations of the superwind phase of AGB stars, and their transition to the post-AGB phase. We are also forced to assume spherical symmetry of the circumstellar matter.
With this improved model for PNe populations we have simulated galactic PNe and compared the results with observations. We concentrated on emission lines and ionisation states, and find excellent agreement without the necessity to vary any model parameters. Based on these successful comparisons, we then concentrated on the luminosity function. The main results concerning the PNLF are:
-
•
Our models predict a PNLF shape towards the cut-off very similar to those observed in spiral and irregular galaxies.
-
•
In galaxies with recent star formation (either continued up to now, or with a burst occurred Gyr ago), the cut-off is expected at , depending on model parameters. This is consistent with the observed values at about (e.g. for the LMC).
-
•
In galaxies without recent star formation, the cut-off is predicted much fainter than observed. This is due to the lack of stars with , responsible for the brightest PNe ().
-
•
From the two previous points it follows that we can hardly explain the constancy of the cut-off observed in some ellipticals (dominated by old populations) in terms of the claimed age-invariance. Rather, a possible way to explain the bright PNLF cut-off observed in some late-type galaxies is just to invoke a recent burst of star formation.
-
•
One main parameter determining the PNLF cut-off is the transition time, to be constrained on the base of observed PN properties (e.g. , , ionized masses, radii, expansion velocities, etc). Our simulations indicate that, in order to recover the observed brightness of the cut-off, the CSPNe populating it (with masses around ) should have a of the order of few hundred years (typically yr). On galaxies without recent SFR, the cut-off position becomes little sensitive to .
-
•
The predicted dependence of the PNLF on metallicity is the result of a number of factors, as we need to know (i) how the evolutionary properties of the stellar progenitors (i.e. the efficiency of mass loss on the AGB, the details of the initial–final mass relation) vary as a function of the initial chemical composition, (ii) the initial main-sequence abundance of oxygen, and iii) the actual oxygen abundance in PNe since it may differ significantly from the initial value due to dredge-up episodes during the TP-AGB phase.
Overall, our results explain in a very natural way the successful calibration of the PNLF using Cepheid distances (Feldmeier et al. 1997; Jacoby 1996). In the list given by Jacoby (1996), 7 out of 8 galaxies in the sample are classified as spiral or irregular galaxies, only NGC5253 is of E/S0 type. However, it is well documented that this galaxy has undergone a recent starbust (see, e.g. Verma et al. 2003) and thus, as for all the other objects star formation has taken place during the last billion year, and all PNLFs reach . In fact, the argument can be made even stronger and more general: in case there is a Cepheid distance to a galaxy, there must be a young population and thus the PNLF will reach the canonical cutoff brightness.
Furthermore, our models do not support the idea of a population-invariant PNLF cut-off. Indeed, the suggestions for an age-invariant cut-off poses a serious problem to the theory. In order to explain it, we may need to explore the properties of very low- PNe, or to invoke a very different and difficult-to-imagine scenario for the evolution of PNe and their progenitor stars than here considered.
Considering all these aspects, we find it worth questioning if the indications for the cut-off invariance are really as solid as claimed. Until definitive evidence is not brought, and until there is not a solid theoretical framework supporting such evidence, we suggest that the PNLF should still be considered as a potentially useful probe of stellar populations in galaxies, rather than a standard candle.
Acknowledgements.
This study is funded by a DAAD–Vigoni collaboration project, and the Italian Ministry of University and Scientific Research (MIUR). P.M. and L.G. thank the Max-Planck-Institut für Astrophysik for the kind hospitality.References
- (1) Acker, A., Marcout, j., Ochsenbein, F., Stenholm, B., & Tylenda, R. 1992, The Strasbourg-ESO Catalogue of Galactic Planetary Nebulae
- (2) Allende Prieto, C., Lambert, D. L., & Asplund, M. 2001, ApJ, 556, 63
- (3) Anders, E., & Grevesse, N. 1989, Geochim. Cosmochim. Acta, 53, 197
- (4) Boffi, F.R., & Stanghellini, L. 1994, A&A, 284, 248
- (5) Bressan, A., Chiosi, C., & Tantalo, R. 1996, A&A, 311,425
- (6) Chiosi, C., & Carraro, G. 2002, MNRAS 335, 335
- (7) Ciardullo, R. 2003, in Stellar Candles for the Extragalactic Distance Scale
- (8) Ciardullo, R., Feldmeier, J.F., Jacoby, G.H., et al. 2002, ApJ, 577, 31
- (9) Ciardullo, R., & Jacoby, G.H. 1999, ApJ, 515, 191
- (10) Ciardullo, R., Jacoby, G.H., Ford, H.C., & Neill J.D. 1989, ApJ, 339, 53
- (11) Davies, R.L., Kuntschner, H., Emsellem, E., Bacon, R., Bureau, M., et al. 2001, ApJL, 548, L33
- (12) Dopita, M.A., Jacoby, G.H., & Vassiliadis E. 1992, ApJ, 389, 27
- (13) Dopita, M.A., & Meatheringham, S.J. 1990, ApJ, 357, 340
- (14) Dopita, M.A., Vassiliadis, E., Meatheringham, S.J., et al. 1996 ApJ, 460, 320
- (15) Dopita, M.A., & Sutherland R.S. 2000, ApJ, 539, 742
- (16) Feldmeier, J.J., Ciardullo, R., & Feldmeier, J.F., 1997, ApJ, 479, 231
- (17) Ferland, G.J. 2000, Astronomical Data Analysis Software and Systems IX, ASP Conf. 216, 32
- (18) Ferland, G.J. 2001, Hazy, a brief introduction to CLOUDY 96.00
- (19) Fukugita, M., NaKamura, O., Turner, E.L., Helmboldt, J., Nichol, R.C. 2004, ApJL, 601, L127
- (20) Girardi, L., Bressan, A., Bertelli, G., & Chiosi, C. 2000, A&AS, 141, 371
- (21) Goto, T., et al. 2003, PASJ, 55, 771
- (22) Groenewegen, M.A.T., & de Jong T., 1994, A&AS, 283, 483
- (23) Jacoby, G.H. 1989, ApJ, 339, 39
- (24) Jacoby, G.H., Ciardullo, R., & Ford, H.C. 1990, ApJ, 356, 332
- (25) Jacoby, G.H. 1997, in The Extragalactic Distance Scale, Space Telescope Science Institute Series, edited by M. Livio (Cambridge University Press), p. 197
- (26) Jacoby, G.H., Ciardullo, R., & Feldmeier, J.J. 1999, in Egret D., Heck A. (eds.), Harmonizing Cosmic Distance Scales in a Post-HIPPARCOS Era, ASP Conf. Ser. 167, 175
- (27) Jorgensen, I. 1999, MNRAS, 306, 607
- (28) Herwig, F., Bloecker, T., Schönberner, D., El Eid, M. 1997, A&A, 324, 81
- (29) Kahn, F.D. 1983, in Planetary Nebulae, IAU Symp. 103, p. 305
- (30) Karakas, A.I., Lattanzio, J.C., Pols, O.R., 2002, PASA, 19, 515
- (31) Kawata, D. 2001a, ApJ, 548, 5703
- (32) Kawata, D. 2001b, ApJ, 558, 598
- (33) Kawata, D., & Gibson B.K. 2003a, MNRAS 340, 908
- (34) Kawata, D., & Gibson B.K. 2003b, MNRAS 346, 135
- (35) Kuntschner, H. 2000, MNRAS 315, 184
- (36) Kurucz, R.L. 1993, in IAU Symp. 149: The Stellar Populations of Galaxies, eds. B. Barbuy, A. Renzini, Dordrecht, Kluwer, p. 225
- (37) Longhetti, M., Bressan, A., Chiosi, C., Rampazzo, R. 2000, A&A, 353, 917
- (38) McKenna, F.C., Keenan, F.P., Kaler, J.B., Wickstead, A.W., Bell, K.L., Aggarwal, K.M. 1996, PASP, 108, 610
- (39) Lattanzio, J.C. 1986, ApJ, 311, 708
- (40) Marigo, P. 2001, A&A, 370, 194
- (41) Marigo, P., Bressan, A., & Chiosi, C. 1998, A&A, 331, 564
- (42) Marigo, P., & Girardi, L. 2001 A&A, 377, 132
- (43) Marigo, P., Girardi, L., & Bressan, A. 1999, A&A, 344, 123
- (44) Marigo, P., Girardi, L., Groenewegen, M.A.T., & Weiss, A. 2001, A&A, 378, 958 (Paper I)
- (45) Méndez, R.H., Kudriztki, R.P., Ciardullo, R., & Jacoby, G.H. 1993, A&A, 275, 534
- (46) Méndez, R.H., Soffner, T. 1997, A&A, 321, 898
- (47) Phillips, J.P. 2000, AJ, 119, 2332
- (48) Phillips, J.P. 1998, A&A, 340, 527
- (49) Poggianti, B., Bridges, T., Mobasher, B., Carter, D., Doi, M., et al. 2001, ApJ, 562, 689
- (50) Portinari, L., Chiosi, C., Bressan, A. 1998, A&A, 334, 505
- (51) Quintero, A.D., Hogg, D.W., Blanton, M.R., Schlegel, D.J., Eisenstein, J.E., et al. 2004, ApJ, 602, 190
- (52) Rauch, T. 1997, A&A, 320, 237
- (53) Stanghellini, L., & Renzini, A. 2000, ApJ, 542, 308
- (54) Stasińska, G. 1989, A&A, 213, 274
- (55) Stasińska, G., Górny, S.K., Tylenda, R. 1997, A&A, 327, 736
- (56) Stasińska, G., & Szczerba R. 2001, A&A, 379, 1024
- (57) Tantalo, R., & Chiosi, C. 2003, MNRAS, submitted
- (58) Trager, S.C., Faber, S.M., Worthey, G., Gonzalez, J.J. 2000a, AJ, 119, 1645
- (59) Trager, S.C., Faber, S.M., Worthey, G., Gonzalez, J.J. 2000b, 120, 165
- (60) Vassiliadis, E., & Wood, P.R. 1994, ApJS, 92, 125
- (61) Vazdekis, A., Kuntschner, H., Davies, R.L., Arimoto, N., Nakamura, O., Peletier, R. F. 2001, ApJ, 551, 127
- (62) Verma, A., Lutz, D., Sturm, E., Sternberg, A., Genzel, R.. & Vacca, W. 2003, A&A, 403, 829
- (63) Volk, K., & Kwok, S. 1985, A&A, 153, 79
- (64) Volk, K. 1992, ApJS, 80, 347
- (65) Wagenhuber, J., & Groenewegen, M.A.T. 1998, A&A, 340, 183
- (66) Wood, P.R., & Faulkner, D.J. 1986, ApJ, 307, 659
- (67) Zabludoff, A., et al. 1996, ApJ, 466, 104
- (68) Zhang, C.Y. 1995, ApJS, 98, 659