A VLA Search for Water Masers in Six H ii Regions: Tracers of Triggered Low-Mass Star Formation
Abstract
We present a search for water maser emission at 22 GHz associated with young low-mass protostars in six H ii regions — M16, M20, NGC 2264, NGC 6357, S125, and S140. The survey was conducted with the NRAO Very Large Array from 2000 to 2002. For several of these H ii regions, ours are the first high-resolution observations of water masers. We detected 16 water masers: eight in M16, four in M20, three in S140, and one in NGC 2264. All but one of these were previously undetected. No maser emission was detected from NGC 6357 or S125. There are two principle results to our study. (1) The distribution of water masers in M16 and M20 does not appear to be random but instead is concentrated in a layer of compressed gas within a few tenths of a parsec of the ionization front. (2) Significantly fewer masers are seen in the observed fields than expected based on other indications of ongoing star formation, indicating that the maser-exciting lifetime of protostars is much shorter in H ii regions than in regions of isolated star formation. Both of these results confirm predictions of a scenario in which star formation is first triggered by shocks driven in advance of ionization fronts, and then truncated years later when the region is overrun by the ionization front.
1 Introduction
The majority of low-mass stars form not in regions of isolated star formation, such as the Taurus-Auriga molecular cloud, but instead in cluster environments that also contain massive stars (see, e.g. Lada & Lada, 2003). The process of star formation may be fundamentally different in these two environments. In low-mass star-forming environments, each protostar is largely responsible for shaping its own natal environment. In contrast, star-forming environments surrounding H ii regions are shaped by the radiation and mechanical energy of the O and B stars that excite the region. Much effort has been made to understand the importance of supernova shocks as triggers of low-mass star formation (see, e.g. Foster & Boss, 1996). But an even more important effect may involve triggering of star formation by radiatively driven implosion of molecular gas surrounding H ii regions (see, e.g. Elmegreen & Lada, 1977; Bertoldi, 1989; Bertoldi & McKee, 1990). Hester et al. (1996) pointed out that such regions would be quickly overrun by the advance of the ionization front, exposing cloud cores and protostars to the potentially disruptive environment in the interior of the H ii region. Recent optical and near-infrared observations of young stellar objects at the edges of H ii regions (e.g. McCaughrean and Andersen, 2002; Ogura, Sugitani, & Pickles, 2002; Sugitani et al., 2002; Thompson, Smith, and Hester, 2002) provide additional support for the triggering and truncation of the star formation process in these environments.
Although the stellar population in the low density interior of the H ii region can be studied in the optical and near-infrared part of the spectrum, the youngest protostars are extremely difficult to observe at these wavelengths. This is due in part to the high foreground extinction associated with the molecular gas in which the protostars are embedded. This is also due to the fact that protostars are intrinsically cool objects, radiating at centimeter wavelengths and peaking at submillimeter wavelengths (André, Ward-Thompson, & Barsony, 1993). If we are to address properly the question of low-mass star formation in complex H ii region environments, then we need a way to probe the spatial distribution of young protostars, including low-mass protostars, in the high-density molecular gas bounding H ii regions. In this paper we present observations of water masers in and around H ii regions, and find such observations to provide a powerful yet previously under-utilized tool with which to conduct such studies.
Previous observations of water maser emission from low-mass protostars have focused on the relatively nearby sample selected from low-mass star-forming regions like Taurus-Auriga. For example, the sample of Claussen et al. (1996) was selected to have d 450 pc and 90% of the sources of Furuya et al. (2001) had d 500 pc. These and other studies have provided a wealth of data on the behavior of water maser emission. We would like to apply that knowledge to the more distant and more complex case of star formation and water maser activity in regions shaped by the presence of massive stars.
Water maser emission is only known to arise in association with AGN, AGB stars, and protostars. For example, Claussen et al. (1999) find that even the most favorable conditions behind supernova remnant shocks fail to produce water maser activity. Maser emission in the transition of water at 22.235077 GHz is a well-known trait of the youngest protostars, low- and high-mass alike (Tofani et al., 1995; Claussen et al., 1996; Meehan et al., 1998; Furuya et al., 2003). Observational studies of both massive and low-mass protostars suggest that maser activity is associated with the youngest stages of star formation. Furuya et al. (2001, 2003) show that 4020% of Class 0 and 43% of Class I low-mass protostars exhibit water maser emission. Forster & Caswell (2000) conclude that water masers are likely excited by massive pre-main sequence stars or possibly actively-accreting, massive protostars. Observations also show that water maser activity lies in close proximity to the exciting object. Water masers are observed within tens or hundreds of AU of low-mass protostars (e.g. Chernin, 1995; Claussen et al., 1998; Furuya et al., 2000). The separation between maser and massive star can be AU (e.g. Tofani et al., 1995; Forster & Caswell, 2000). Only in extreme cases (e.g. the water masers in Orion), does the spatial correlation between water masers and the exciting protostar break down. In general, the presence of water masers in a region of star formation, such as the molecular gas surrounding an H ii region, is an unambiguous indication of the presence of a star in the earliest stages of formation. Due to the intrinsic variability and emission geometry of maser emission, this detection method will not uncover all young protostars. Nonetheless, water maser emission can provide us with a look at the distribution of young protostars within an H ii region environment. Finally, while low- and high-mass protostars may result from the star formation around H ii regions, far more low-mass stars form in this process (Lada & Lada, 2003). Statistically we expect that most of the observed water maser activity in H ii regions is excited by low-mass protostars.
The presence of water masers in H ii region environments is well-known (see, e.g. Genzel and Downes, 1977; Blitz and Lada, 1979; Comoretto et al., 1990). These surveys and more recent searches have been performed with single-dish telescopes, which have typically 1 arcminute resolution. This resolution is inadequate to properly locate protostars relative to ionization fronts and other details of the H ii region environment. If we want to use water maser emission to study the process of star formation in regions around massive stars, we need positions accurate to 1″ or better, comparable to optical and near-infrared observations of H ii regions. The NRAO Very Large Array (VLA)111The National Radio Astronomy Observatory is a facility of the National Science Foundation operated under cooperative agreement by Associated Universities, Inc. is the instrument of choice for this type of investigation compared to single-dish telescopes. First, the greater effective aperture of the VLA provides greater sensitivity which allows for weaker masers to be detected in shorter observations compared to single-dish observations. Second, the large primary beam of the VLA allows for fewer pointings to cover the same area of sky compared to large aperture single-dish telescopes. Third, the small synthesized beam of the VLA gives a precise position for water masers that can be compared to optical or infrared observations of the H ii regions.
The observations, calibration, and analysis of this survey are discussed in . The results of the observations for each H ii region are presented in . In , we discuss our results, and find that we are able to test two specific predictions concerning triggering and subsequent disruption of low-mass star formation in these environments. A summary of our results and conclusions is presented in .
2 Observations and Data Reduction
We searched the H ii regions M16, M20, NGC 2264, NGC 6357, S125, and S140 for water maser emission at 22.2 GHz. Our original observations of four H ii regions (NGC 2264, M16, M20, and S140) were made on 2000 April 02, April 04, June 06, and June 13 (C configuration, angular resolution 09). We expanded our observations of M16 and M20 and added NGC 6357 and S125 on 2001 March 26 and May 18 (B configuration, angular resolution 03). A final set of observations of select targets within M16 and M20 occurred on 2002 March 14 (A configuration, angular resolution 008). Due to the intrinsic variability of maser emission, we planned to observe each location within the target H ii regions at least twice, separated by a few months’ time. This was achieved for all of the targets, except S140, which was observed only on 2000 June 06.
A total bandwidth of 3.125 MHz was divided into 127 channels, giving 24.4 kHz (0.33 km s-1) channel width. For the 2000 and 2001 observations, we used one frequency band centered on the systemic velocity of the H ii regions. For the 2002 observations, we used two frequency bands (total bandwidth 6.25 MHz) that overlapped by several channels. In this mode, the combined bandwidth of the overlapping frequency bands was centered on the systemic velocity of the H ii regions. The pointings, dates of observation, and velocity range searched for each H ii region are listed in Table 1.
At 22 GHz, the primary beam of VLA antennae is 2 FWHM. We used a patchwork of pointings to search portions of the H ii regions for water maser emission. In our 2000 observations, our pointings were contiguous and covered a small portion of the four target H ii regions. In 2001 and 2002, we observed a variety of targets of interest as well as covering a larger portion of the H ii regions (see Figures 1-6). All pointings, but one, was observed for 6 to 7 minutes. The exception, NGC 2264 pointing 1 (2000 April 04), was observed for just over one minute.
We calibrated the data in the usual way with the Astronomical Image Processing System (AIPS), using 0137+331 (3C48) as the primary flux calibrator for all observations, except 2002 March 14 for which we used 1331+305 (3C286). The phase calibrators were 0700+171 (NGC 2264), 1733-130 (M16 and NGC 6357), 1820-254 (M20), 1911-201 (M20), 2022+616 (S140), and 2202+422 (S125). The derived fluxes are listed in Table 2 and are in agreement with those reported by other observers as listed in the online VLA calibrator manual222http://www.aoc.nrao.edu/gtaylor/calib.html.
For each pointing, the entire primary beam was imaged using the AIPS routine IMAGR with a pixel size of 02 for the 2000 observations, 006 for the 2001 observations, and 0015 for the 2002 observations. In each case the pixel size was chosen to be approximately one-fifth the synthesized beamwidth. The resulting spectral-line cubes were searched for maser components by identifying peaks that were more than 7 above the noise level of each channel image. Peaks within 2 of the image edges were rejected as spurious given the lower sensitivity at the edge of the primary beam. In addition to this test, we also checked for multiple features weaker than 7 that appeared at the same position in different channels. This second test identified no components that were not detected in the first test. For fields that included maser emission stronger than 10 Jy, we used the CLEAN method (Högbom, 1974; Clark, 1980) to remove the effects of the point spread function of the bright maser emission from the data. These CLEAN’ed data cubes were then searched again using both search tests. No additional maser components were identified.
For those fields in which maser emission was identified, spectral-line cubes were made and CLEANed. Primary beam attenuation was corrected using the AIPS routine PBCOR. The resulting cubes had rms noise values of 25-45 mJy/beam for the 2000 observations (the range of values mostly due to varying weather between the four dates of observation in this year), 25-40 mJy/beam (with a few as high as 50 mJy/beam) for 2001, and 10-20 mJy/beam for 2002.
The position of the peak of emission in each channel image was compared throughout the range of channels in which emission was identified. No significant variation of position versus frequency was found, and no resolved emission was detected. These two results simplified the process of spectrum extraction since a single position for each maser component was valid for all channels. For each maser, a bounding box was chosen that just enclosed the synthesized beam in the channel of strongest emission, which for the reason above also included the emission in the other channels. A spectrum of the maser component was then extracted from the image cube using the AIPS routine ISPEC.
3 Results
Four of the six H ii regions exhibited water maser emission for a total of 16 spatial components: eight in M16, four in M20, one in NGC 2264, and three in S140. We define a component as a spatially unresolved spot of emission even if it contains multiple spectral features. It should be noted, however, that at resolutions of tens to hundreds of milliarcseconds, individual velocity features are often spatially distinct (see, e.g. Claussen et al., 1998). Table 3 lists our designation of each maser, the J2000 position, the date of detection, the flux(es) in Janskys and the velocity in km s-1 of the strong spectral component(s). We detected no maser emission in NGC 6357 and S125 to a detection limit of 0.1 Jy (3). Of our 16 detections, only the water maser associated with S140 IRS 1 (S140 component A) was found in the literature.
We detected 9 of the 16 water masers in more than one epoch. No significant proper motion was detected in any of these nine components when taking the dimensions of the synthesized beams into account. The single exception was M16 Column 5 component A, but there was no consistent direction of the displacement with time so we could not calculate a meaningful average velocity vector. Individual velocity components appeared and disappeared on timescales ranging from months to years. In contrast, M16 Column 5 component A displayed a stable spectrum during three epochs spanning a year.
3.1 M16
M16 (S49, “Eagle Nebula”) is excited by the cluster NGC 6611 which contains a single early O-type star and several middle O-type stars (Bosch, Morrell, & Niemelä, 1999). Several studies show that the stellar population has a spread of age as broad as a few million years, with pre- to post-main sequence members present (Hillenbrand et al., 1993; de Winter et al., 1997). This H ii region is well known for its columns of neutral gas, dubbed “elephant trunks” (see, e.g. Hester et al., 1996), that project into the ionized volume. The presence of young, partially enshrouded protostars at the tips of several elephant trunks illustrates the ongoing star formation in M16 (Thompson, Smith, and Hester, 2002; McCaughrean and Andersen, 2002). The distance to M16 is 2.6 kpc according to de Winter et al. (1997), in agreement with earlier studies.
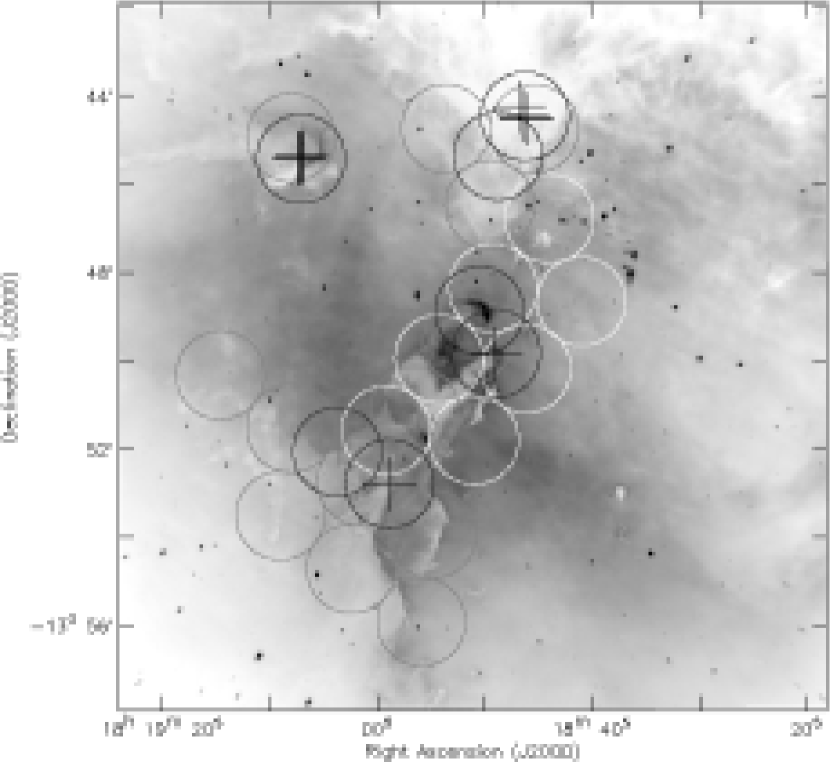
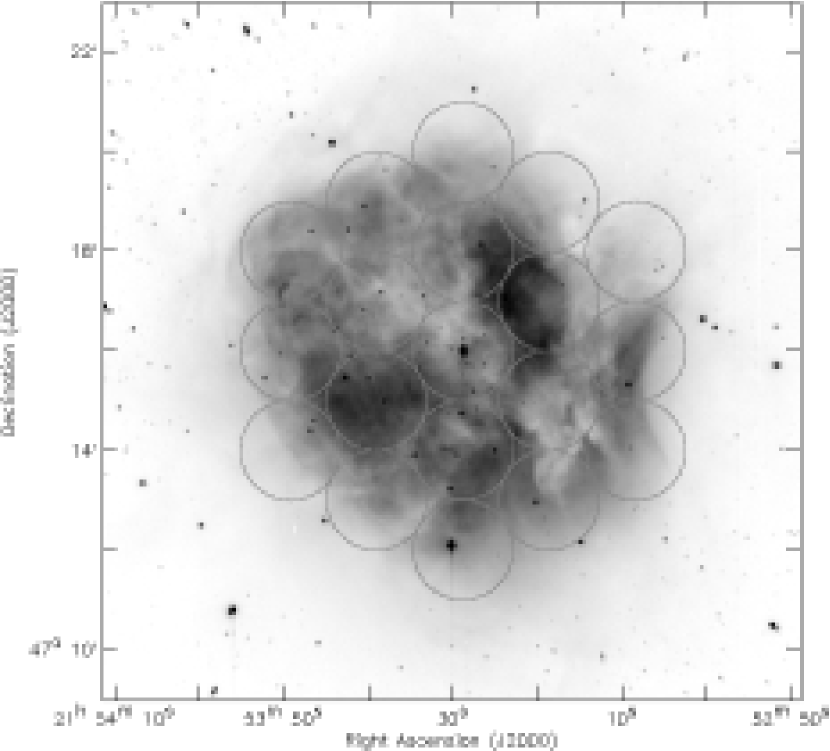
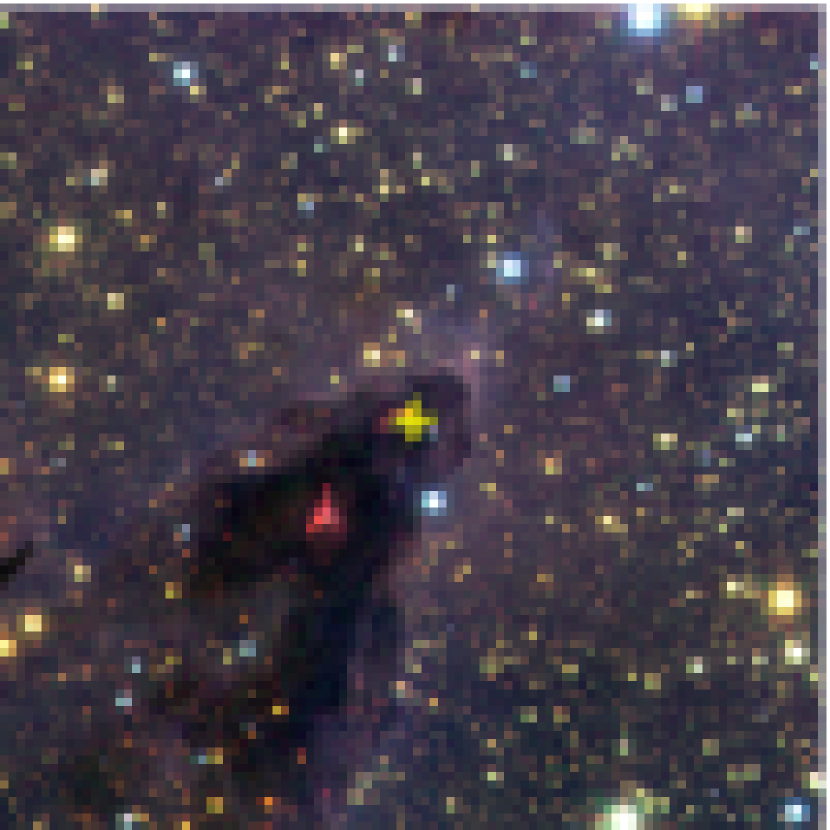
Water maser emission associated with W37 in the center of M16 was previously reported by Yngvesson et al. (1975). Water masers have also been reported to the east and west of M16 by Blitz and Lada (1979). During our three years of observations, we observed both a portion of the cluster NGC 6611 as well as several elephant trunks and the interior of the H ii region. We focused our attention on the tips of Columns 1 and 2 (Hester et al., 1996), the column to the southeast (referred to as Column 4 in McCaughrean and Andersen 2001), and the column to the northeast (here referred to as “Column 5”). In addition, the detection by Yngvesson et al. (1975) led us to observe the optical extinction feature north and east of NGC 6611 (here referred to as the “North Bay”). The positions of the VLA pointings are shown in Figure 1 and listed in Table 1. We detected 8 water masers in M16: single components in Column 2 and 4, three components in Column 5, and three components in the North Bay (see Table 3). We did not detect water maser emission from Column 1, Column 3, nor the members of the cluster NGC 6611 to a limit of 0.1 Jy (3).
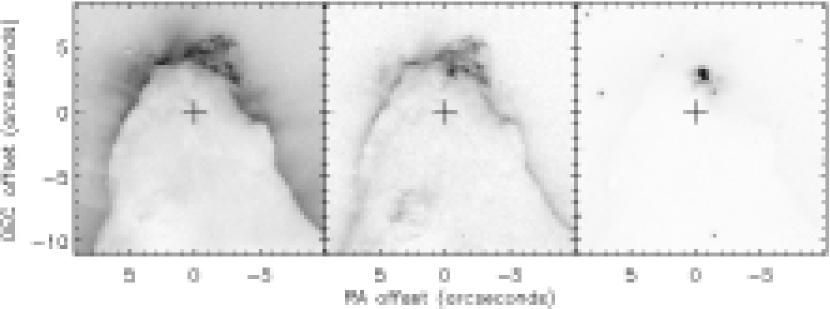
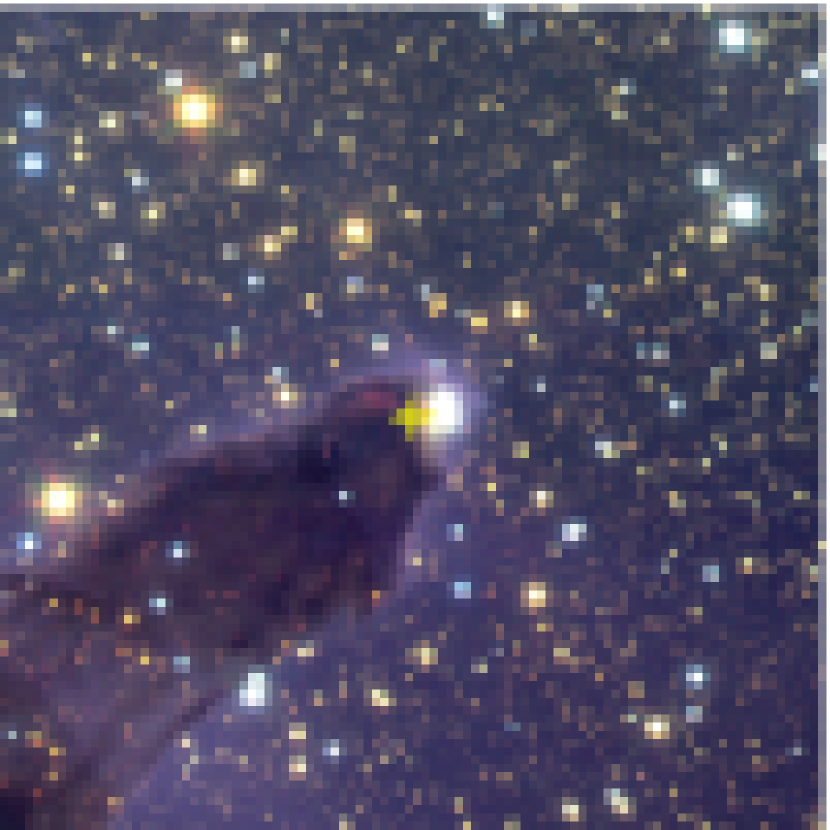
Water maser emission was detected at the tip of Column 2 in five epochs from 2000 April 04 to 2002 March 14. This emission consisted of a velocity component at a vLSR of about +22 km s-1, with two additional velocity components appearing in 2001 March 26 only (see Figure 7). Figure 8 shows the position of this maser relative to the HST WFPC2 H, [S ii], and NICMOS F110W images. The maser emission lies about 27 away (P.A. = 113) from the Class I/II object M16 ES-2 (Thompson, Smith, and Hester, 2002). At a distance of 2.6 kpc, a separation of 27 corresponds to 7000 AU, which is much larger than the typical separations between low-mass protostars and the water masers they excite. We conclude the Column 2 maser is not associated with M16 ES-2. Thus the water maser activity must be excited by a previously unseen protostar. At this position within Column 2, there is no near-infrared source seen (McCaughrean and Andersen, 2001, and see Figure 9), making it likely that this maser-exciting protostar is a Class 0 source. Such a source might in principle be detected at radio or submm wavelengths, although observations such as those of White et al. (1999) lack the spatial resolution necessary to identify low-luminosity sources against the bright and structured nebular emission present at this location. For example, these observations did not show the presence of the protostar M16 ES-2 identified by Thompson, Smith, and Hester (2002). Pilbratt et al. (1998) also failed to identify the presence of ES-2 in their ISO observations, despite the fact that this 20L☉ protostar is bright enough to be easily detected by ISO. Higher resolution and sensitivity radio, submm, and FIR observations of this position will be necessary to identify the protostar that excites this water maser emission.
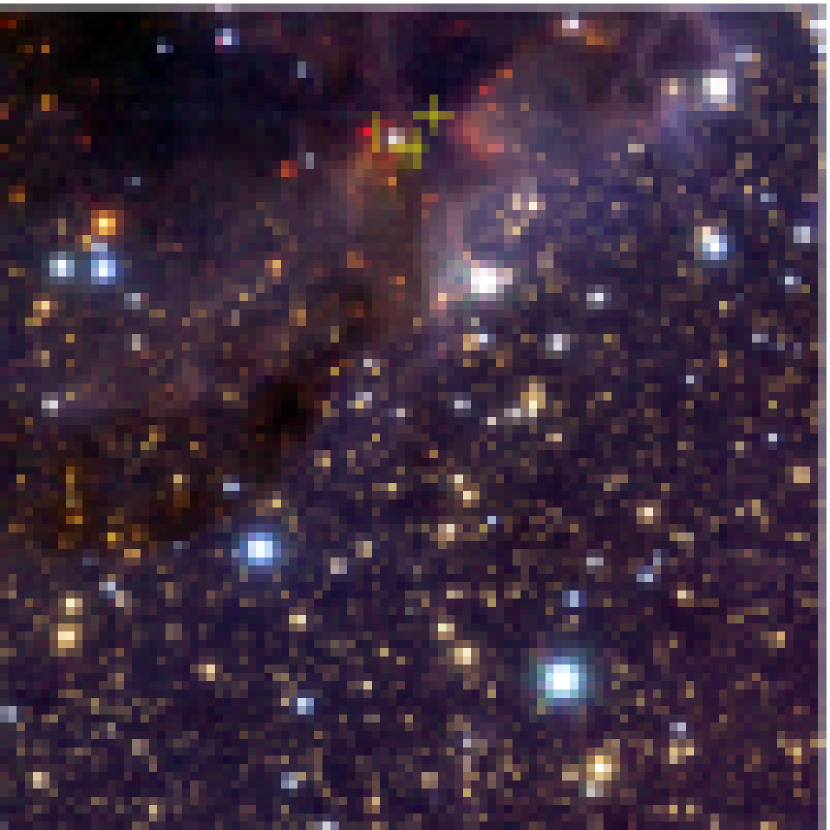
Water maser emission was also detected from the tip of Column 4 in five epochs from 2000 April 04 to 2002 March 14. Like the Column 2 maser, the spectrum of the Column 4 maser was relatively simple with only one or two velocity components at similar vLSR. All detected maser emission was in the range vLSR = +23.4 to +28.3 during the three years of observation (see Figure 10). In the JHK mosaic by McCaughrean and Andersen (2001), two features are visible in the vicinity of the maser emission (see Figure 11). The northern infrared feature has a “core plus jet” morphology. This feature is spatially coincident with the maser emission to within the alignment uncertainty of the radio and infrared data. The maser positions at this location also appear to be slightly spread out along the inferred position angle of the jet. Together, these strengthen the identification (McCaughrean and Andersen, 2001) of the northern infrared source as the protostar responsible for the HH 216 outflow. While the outflow has broken out of the interior of Column 4, the protostar itself is still embedded within Column 4. The presence of water maser emission and a strong outflow suggests that this is a Class 0 or I source (Furuya et al., 2001).
We have labeled the elephant trunk to the east of NGC 6611 as “Column 5.” In 2001 and 2002, we detected a component (A) composed of two strong spectral peaks that maintained nearly constant LSR velocities of approximately +16 and +21 km s-1 over the time span of the observations. In 2002 only, we detected components B and C which were weaker than component A and separated from component A by 35 (P.A. = -22) and 39 (P.A. = +68), respectively. Figure 12 shows the spectra of these three masers. The physical separations between the three components are nearly AU. This large separation implies this water maser activity is excited by multiple protostars. Close inspection of the near-infrared image of McCaughrean and Andersen (2001) reveals a small bipolar reflection nebula and several “red” (i.e. large, positive J-K and H-K color) objects in the vicinity of the water masers (see Figure 13). Further evidence of star formation at this location comes from the presence of the MSX point source G017.0335+00.7479, less than 5 south of component A (Price et al., 2001). As with the Column 2 and Column 4 protostars, the protostars in Column 5 are on the verge of being overrun by the advancing ionization front. As discussed below, the concentration of young protostars so near to ionization fronts is unlikely to be coincidental.
The optical extinction feature north and east of NGC 6611 is labeled the “North Bay.” In 2001 and 2002, we detected several maser components on the western side of the North Bay, within dense gas visible in near- and mid-infrared observations (Pilbratt et al., 1998; McCaughrean and Andersen, 2001, and the ISO mosaic of M16333Available through the ISO archive at http://www.iso.vilspa.esa.es/). The brightest component (A) exhibited two velocity features detected in both 2001 epochs: a narrow peak at vLSR = +24.7 km s-1 and a broad peak at vLSR = +15.7 km s-1. Component B exhibited very different spectra in 2001 May 18 and 2002 March 14, with single peaks at +14.8 km s-1 and +6.3 km s-1 on the two dates, respectively. Component C was the weakest, detected only on 2002 March 14, with three velocity components less than 0.15 Jy each. Figure 14 shows the spectra for these masers. The separation between individual maser components in the North Bay is even larger than the Column 5 masers, again suggesting multiple protostars at this location. It is unclear when these protostars will be overrun by the ionization front because the geometry is unfavorable for locating the protostars relative to the ionization front.
Water maser emission at vLSR of +10 and +25 km s-1 was reported by Yngvesson et al. (1975) at the position of W37, approximately 2 north of the tip of Column 1. We found no emission at the Yngvesson et al. position to a detection limit of 0.1 Jy for all five epochs we observed. Both the proximity of the Column 2 and North Bay masers to W37 and the similarity of maser velocities detected in this study and cited by Yngvesson et al. (1975) suggests emission from the Column 2 or North Bay was misidentified as emission from W37.
3.2 M20
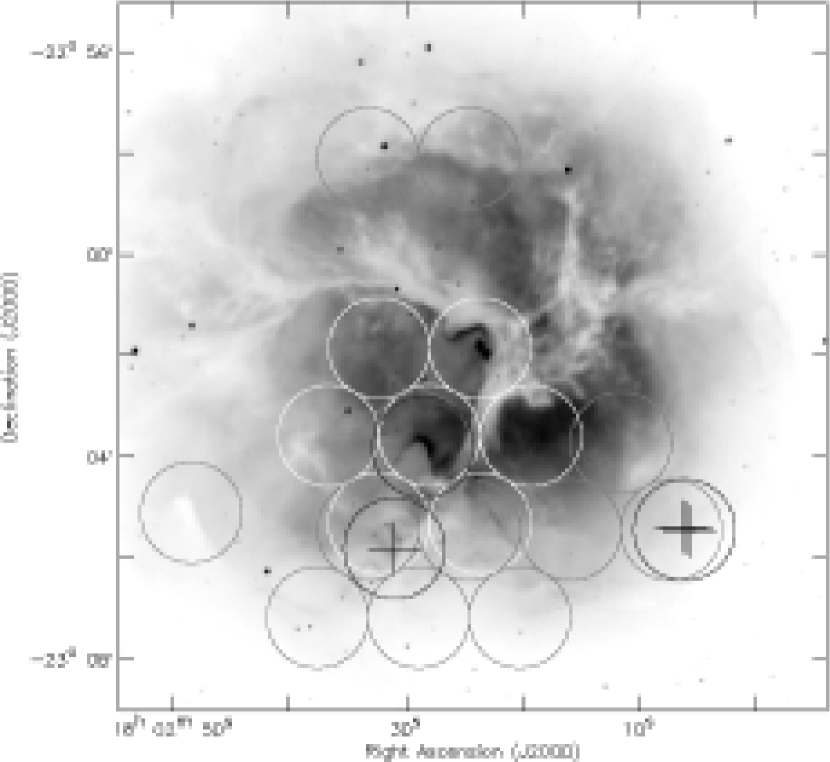
M20 (S30, NGC 6514, “Trifid Nebula”) is a young symmetric H ii region centered on and powered by the late O-type star HD 164492A. The region shows evidence for strong foreground extinction in addition to the characteristic triad of dust lanes. T Tauri stars within the H ii region (Rho et al., 2001) and dense cloud cores in the surrounding neutral gas (Cernicharo et al., 1998; Lefloch & Cernicharo, 2000) have been detected. Another obvious sign of star formation is the HH399 jet launched by an as yet unidentified protostar lying within the dense cloud TC2 located southeast of HD 164492A (Cernicharo et al., 1998; Hester et al., 1999). Two other massive cloud cores, TC3 and TC4, lie at the southwestern periphery of M20 (Cernicharo et al., 1998). Lefloch & Cernicharo (2000) interpreted the small size of M20 as a result of the young dynamical age (0.3-0.4 Myr) for this H ii region. The most commonly quoted distance to M20 is 1.68 kpc (Lynds, Canzian, & O’Neil, 1985), but larger values have been suggested (see, e.g. Kohoutek, Mayer, & Lorenz, 1999, and references therein).
Previous searches for water maser activity in M20 do not appear in the literature. The youth and intensity of star formation activity in M20 makes this H ii region an obvious choice for our survey. We focused our attention on the south-central portion of M20 during the three years of observations (see Figure 2). We targeted TC2 in all three years to search for water maser activity powered by the embedded source of the HH399 jet, but none was detected to a sensitivity limit of 0.1 Jy (3).
In our 2000 April 02 and June 06 observations, we detected water maser emission about 1 south of TC2 or about 5 south of the center of M20. This maser has a single velocity component at a vLSR around +25 km s-1 (Figure 15). Emission was not detected in our 2001 or 2002 epochs. Figure 2 shows the position of this maser within M20. In the infrared and millimeter maps of Cernicharo et al. (1998), there is a spatially broad peak at the position of the water maser. There is no visible star or optical signature of outflows present at this position. The 2MASS point source 1802309-230549 lies 06 from the position of the maser. This source has JHK colors that imply it is embedded (i.e. AV 27-30) and luminous (i.e. 1500-2000 L☉), suggestive of an extremely young low-mass or an intermediate-mass protostar. The projected separation between the maser and the 2MASS source (1000 AU) is only somewhat larger than the typical separation (see, e.g. Chernin, 1995; Claussen et al., 1998; Furuya et al., 2000) between a protostar and the masers it excites, so this maser might either be associated with 2MASS 1802309-23054, or with a close neighbor of that source. If the maser is associated with the 2MASS source, the visibility of the source in the near-infrared makes it likely this is a Class I rather than a Class 0 protostar.
In our 2001 and 2002 observations, we detected three new masers in the southwestern portion of M20 very near the peak of the millimeter source TC3 (Cernicharo et al., 1998). Figures 16 - 18 show the spectra of these masers. Component A shows multiple velocity features, with the features around vLSR = +20 km s-1 and +25.5 km s-1 present in all three epochs from 2001 March 26 to 2002 March 14. Component B shows a single weak feature in 2001 March 26 and two strong features detected in 2002 March 14. The 22.7 Jy feature at vLSR = 11.8 km s-1 was the strongest emission we detected in any of the H ii regions we observed. Component C was detected only on 2001 May 18 and consisted of a single weak feature at vLSR = +24.9 km s-1.
Figure 2 shows the positions of these three new masers. All components are within 5 from the peak of 1250 continuum emission of TC3 and separated from each other by 5. Assuming a distance of 1.68 kpc to M20, this separation corresponds to a physical distance of 0.04 pc. Lefloch & Cernicharo (2000) calculated a Jeans length of 0.06 pc in the core of TC3, comparable to the separation between the observed water masers. Thus, it is likely that multiple low-mass protostars have formed within TC3. If the detection rate of water maser activity from low-luminosity protostars is about one-third (Claussen et al., 1996), then we expect 9 protostars to be present within the core of TC3. The maps presented by Lefloch & Cernicharo (2000) do not have the spatial resolution required to detect substructure on this scale within TC3. Lefloch & Cernicharo (2000) reported the detection of outflow signatures in SiO and CS lines, but the mass (1.1 M☉) and luminosity (1.2 L☉) inferred from the molecular lines are low enough to be attributable to many young, low-mass protostars contributing to an unresolved outflow signature.
3.3 NGC 2264
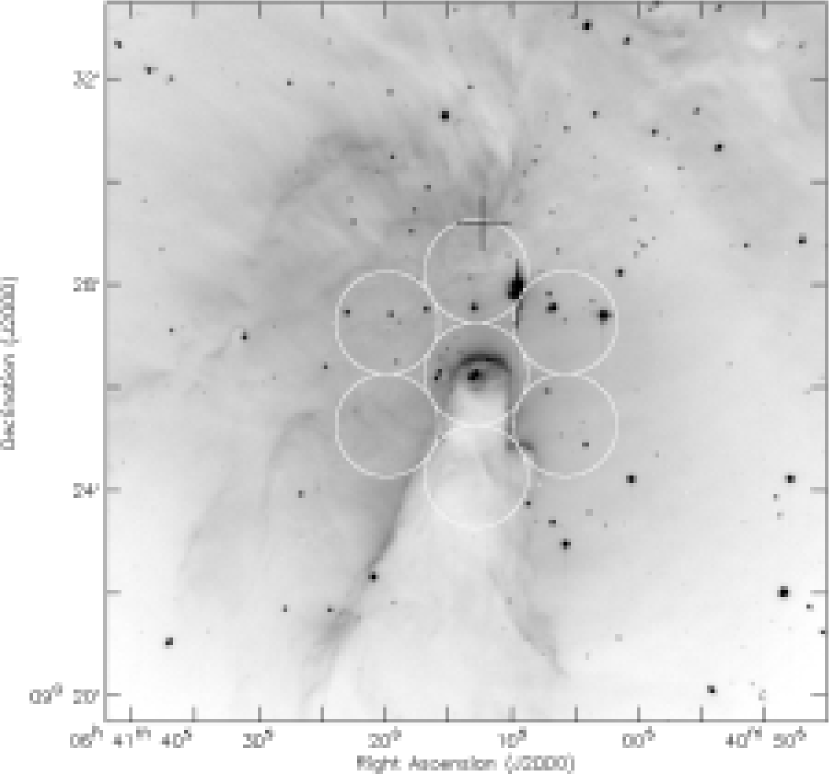
At the southern end of the cluster and H ii region NGC 2264 lies the Cone Nebula. The Cone is illuminated by the stars HD 47887 and 47887B of spectral type B2III and B9V, respectively. The stellar population in this region shows H and near-infrared excesses indicative of youth (Lada, Young, & Greene, 1993; Sung, Bessell, & Lee, 1997). Roughly 3 north of the Cone is a luminous infrared source IRS 1 that powers a bipolar outflow. This portion of the H ii region has been mapped in several molecular transitions by Schreyer et al. (1997) and in submillimeter continuum by Ward-Thompson et al. (2000). The distance to NGC 2264 has been suggested to be about 800 pc (Sagar & Joshi, 1983).
On 2000 April 04 and June 13, we searched a portion of the H ii region centered on the tip of the Cone Nebula (Figure 3). Water maser emission associated with NGC 2264 IRS 1 is well-known and well characterized as highly variable (Genzel and Downes, 1977; Tofani et al., 1995). One of our pointings contained the position of IRS 1. We detected no water maser emission from the position of IRS 1 to a limit of 0.2 Jy (3). We detected a previously unreported water maser on 2000 June 13, at a position approximately 45 southeast of IRS 1 at vLSR = +2.6 km s-1. The 2000 April 04 observation of the same field contained a weak (5.9) component at the same position and velocity as the June 13 detection. Figure 19 shows the spectra from both dates of observation. The positions, peak fluxes, and velocities of the peak emission for this maser are listed in Table 3.
This water maser lies within 0.3 (240 AU at 800 pc) of the center of MMS3, a warm, dense core detected in submillimeter continuum observations by Ward-Thompson et al. (2000). The derived mass for MMS3 from the dust continuum emission is 48 M☉. Schreyer et al. (1997) detected a bipolar outflow at this same position in their CS 54 map. Ward-Thompson et al. (2000) postulated that MMS3 had formed a massive Class 0 object at its center. The detection of water maser activity from this site appears to confirm this conclusion.
3.4 S140
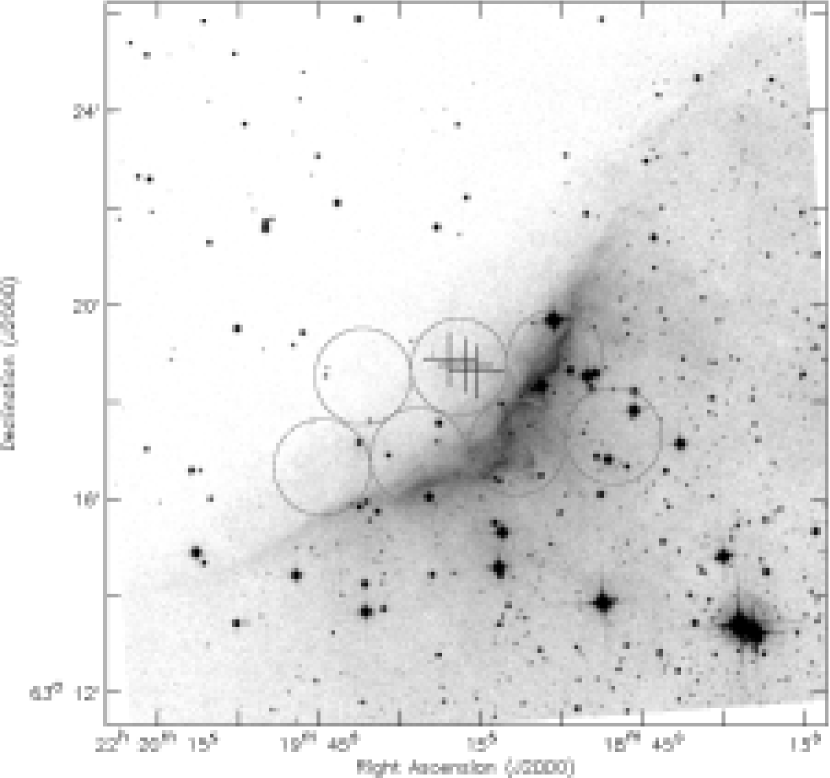
Sharpless 140 (S140, Sharpless, 1959) is a bow-shaped H ii region powered by the B0 star HD 211880 on the southeast edge of the L1204 dark cloud. The interface between the H ii region and the adjoining molecular cloud is viewed mostly edge-on. This region shows signs of ongoing star formation, the clearest evidence being a cluster of luminous infrared sources, designated IRS 1-3, which lie within the molecular cloud about 1 behind the H ii region interface. These sources have been studied extensively at infrared wavelengths (for recent high resolution K-band observations, see Preibisch et al., 2001; Preibisch & Smith, 2002; Weigelt et al., 2002). These observations highlight intense outflow activity originating from IRS 1 and IRS 3. Optical observations by Bally et al. (2002) show strong outflow activity from numerous sources in the region, suggesting further sources of outflows. S140 is estimated to be at a distance of 900 pc (Georgelin & Georgelin, 1976).
Well-known water maser activity is associated with IRS 1 (Knapp & Morris, 1976; Genzel and Downes, 1979; Tofani et al., 1995). On 2000 June 06, we searched a portion of the H ii region as well as the molecular cloud in S140 (see Figure 4). We detected 3 masers, which we designate S140 component A (associated with IRS 1), B (to the SW of IRS 1), and C (to the NE of IRS 1). The positions, peak fluxes, and peak velocities are listed in Table 3. Component A contains two spatially unresolved velocity components at vLSR = 15.3 km s-1 and +3.5 km s-1. Tofani et al. (1995) resolved component A into velocity components at vLSR of 18 km s-1 and +4.1 km s-1 and separated by from each other and separated by and from IRS 1, respectively. Our detected Component A is most likely excited by IRS 1.
In addition to the well-known water maser activity associated with IRS 1, we have detected components B and C at vLSR of 17.9 and 5.7 km s-1, respectively (see Figure 20). These velocity components appear to have been detected previously in single-dish observations, but our observations are the first to spatially resolve components B and C from component A (see, Fig. 27 and 28 in Valdettaro et al., 2002). No infrared sources appear at the positions of components B and C in the images of Preibisch et al. (2001). However, these components are aligned with the strong outflow from IRS 3 (Preibisch et al., 2001; Preibisch & Smith, 2002; Bally et al., 2002), and may be excited either by that outflow or by additional protostars in the region.
3.5 S125
Sharpless 125 (S125, Sharpless, 1959) is a classic H ii region symmetrically distributed around and powered by the early B-type star BD . H i observations by Roger & Irwin (1982) confirm the basic picture of a blister H ii region formed about years ago by the breakout of ionized gas heated by BD . Optical observations of the stellar population by Herbig and Dahm (2002) put the age of the cluster at 1 Myr with a large uncertainty. The photometry of Herbig and Dahm (2002) implies a distance to S125 of 1.2 kpc.
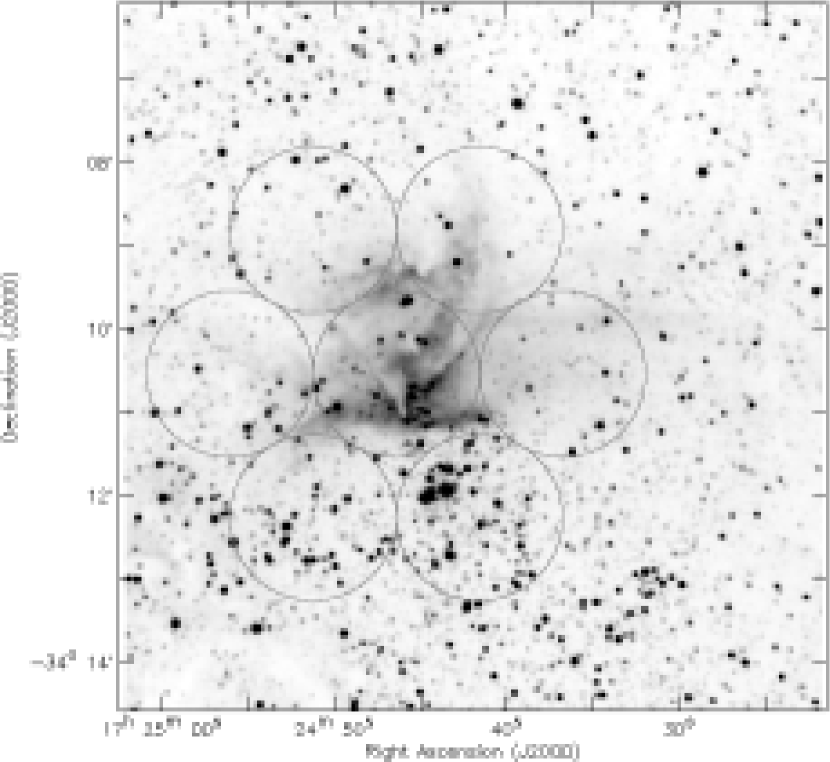
We included S125 in our survey as an example of a low-ionization H ii region. In their search for water maser emission near OB associations, Blitz and Lada (1979) found no water masers in this region to a sensitivity of 6 Jy (3). We surveyed the extent of the optically bright portion of S125 on 2001 March 26 and May 18 using 19 pointings symmetrically arrayed around BD (see Figure 5). We detected no water maser emission on either date to a sensitivity of 0.1 Jy (3). While there exists a population of low-mass stars in S125, Herbig and Dahm (2002) argue that most of these objects have ages of around years. The lack of maser emission in S125 supports the conclusion that there are few young protostars in S125, and that star formation in the region ended some time ago.
3.6 NGC 6357
The NGC 6357 star forming complex includes several distinct H ii regions in different stages of evolution, with G353.2+0.9 being the youngest and brightest. In their study of NGC 6357, Felli et al. (1990) found G353.2+0.9 is characterized by many signatures of star formation, such as strong H and radio continuum emission and multiple near- and mid-infrared sources. Their optical images of G353.2+0.9 also shows the presence of an “elephant trunk” pointing at the cluster C1722343 (Pismis 24), which lies about 30 to the south of G353.2+0.9 (Pismis, 1959). The cluster C1722343 contains several O stars, the brightest being HD 319718 which has been variously classified as O4 to O7 (Lortet, Testor, & Niemela, 1984; Neckel, 1984). The combined ionizing flux from C1722343 is enough to explain the high excitation lines observed by Lortet, Testor, & Niemela (1984). The photometry of Lortet, Testor, & Niemela (1984) and Neckel (1984) agrees with previous distance estimates to NGC 6357 of 1.7 kpc.
We included G353.2+0.9 in our survey due to the apparent close proximity of the ionizing cluster to the molecular cloud (see Massi, Brand, and Felli, 1997, for maps of molecular line emission). The implied high ionizing flux would likely cause rapid heating and photoevaporation of the star forming sites within G353.2+0.9. The disruption of the star-forming environment could lead to a strong observable effect on the young stellar objects within the immediate vicinity of the ionization front.
Water maser activity has been detected within NGC 6357, but the nearest water maser to G353.2+0.9 lies 0.3 away (Sakellis et al., 1984). The sensitivity limit of that survey was slightly less than 1 Jy. We surveyed the extent of the optically bright portion of G353.2+0.9 on 2001 March 26 and May 18 using 7 pointings symmetrically arrayed around the base of the elephant trunk feature (see Figure 6). We detected no water maser emission from this region on either date to a sensitivity of 0.1 Jy (3). There are strong indications from radio, infrared, and optical observations that this region harbors active star formation (Felli et al., 1990), so the absence of water masers is not due to the absence of young protostars. Rather, as discussed below, it seems likely that the water maser-exciting phase of the evolution of a protostar is truncated in the H ii region environment.
4 Discussion
Before proceeding with our discussion, it is worth making the point that we have found water maser emission to be a useful tracer of the youngest stages of star formation in H ii region environments. The water masers in NGC 2264 and S140 appear to be excited by massive protostars. We have provided arguments in support of our conclusion that the maser-exciting protostars in M16 and M20 are low mass. However, the use of water masers as signposts of protostars does not depend on the accuracy of our mass determinations. We were successful in both clarifying the star formation present at previously known locations, as well as identifying new sites of star formation in these complex regions. We are optimistic about the future application of this technique.
Discussion of this initial survey of water maser emission in H ii region environments will focus on two basic questions. The first is the implication of our results with respect to triggering of star formation in such environments (Section 4.1). The second is the difference between water maser activity in H ii regions and regions of isolated star formation, and the implications for how the environments of evolving protostars are affected (Section 4.2). Each of these will be considered in light of the scenario for star formation presented by Hester et al. (1996).
4.1 Evidence for Triggering of Star Formation
The spatial distribution of water masers found in this study suggest that low-mass star formation in H ii region environments is concentrated in molecular gas that is located very close to the current location of the ionization front. That gas has been compressed by the “ionization shock” that is driven in advance of the ionization front. This can be most clearly seen in M16 where the silhouette geometry of the columns means there is less ambiguity in the line-of-sight position of protostars relative to ionization fronts. As can be seen in Figure 1, all masers we have detected in M16 lie a short distance from ionization fronts. Only 12% of the field surveyed has a projected distance of less than 0.2 pc from an ionization front. Even so, 6 of the 8 water masers detected lie in this zone. The odds of a population of protostars randomly distributed throughout the surveyed area lying within the zone by chance are less than . If, instead, the protostars are randomly distributed throughout the columns only, the odds are less than 3%. In either case, the concentration of young protostars near ionization fronts appears to be a real effect. White et al. (1999) present CO observations of the gas in the columns, and argue that shocks with km s-1 are currently being driven into the columns of gas, which have only been exposed to intense UV for of order years. Fukuda, Hanawa, & Sugitani (2002) present CO observations at higher resolution, and find that the arc-like shape of the densest molecular gas shows the action of this advancing shock. They go even further to claim that in Column 1 they resolve a linear progression in the properties of molecular gas and young stellar objects with increasing distance from the ionization front.
The two masers that are not seen in projection within 0.2 pc of an ionization front in M16 lie within the North Bay. In this region, the ionization front is more face-on, and is located on the back side of a dark cloud seen in silhouette against the H ii region. As such, the maser positions are not constrained by a simple cylindrical geometry as in the columns. These two masers may be within 0.2 pc of the ionization front, but we are unable to tell. They do, however, appear to be located in gas that is interacting with the H ii region.
From this analysis, we conclude that the distribution of water masers in M 16 and the underlying young protostellar population is not random, but is concentrated within a layer 0.2 pc from the ionization front. The localization of young protostars very near the ionization front in M 16 is further supported by the results of Thompson, Smith, and Hester (2002) who presented HST NICMOS observations of the region. Each of the bright protostars seen in those observations lie extremely close to the ionization front.
The geometry of the other H ii regions we surveyed is not suitable for a statistical analysis like that above, but the data are suggestive. The maser M20 SE lies in a region containing a number of locations where the ionization front is tangential to the line of sight, and is seen in projection about cm behind an ionization front that is prominent in HST images of the region (Hester et al., 1999). The other maser-exciting protostars in M20 lie within the TC3 molecular core, which Cernicharo et al. (1998) and Lefloch & Cernicharo (2000) argue is undergoing radiatively-driven implosion in advance of the ionization front.
Taken as a whole, our data indicate that young protostars in H ii regions are concentrated in molecular gas that has been compressed by ionization shocks. This distribution provides strong circumstantial evidence that most low-mass star formation in H ii regions is triggered by those ionization shocks. There is no reason to imagine, in the absence of a causal connection, that the youngest protostars would just happen to lie so close to ionization fronts.
4.2 The Efficiency of Maser Production in H ii Regions is Low
The regions that we observed in this survey were chosen in part because of evidence of significant recent star formation. Hillenbrand et al. (1993) describe M16 as a cluster “caught in the act” of star formation – a conclusion that is supported by other observers (e.g. de Winter et al., 1997; McCaughrean and Andersen, 2001). The presence of low-mass protostars within the M16 EGGs has been discussed by McCaughrean and Andersen (2001), who find that approximately 10 EGGs contain stellar and/or substellar objects that can be seen at 2. More EGGs might contain far infrared sources. EGGs have lifetimes against photoevaporation of years (Hester et al., 1996), so the presence of at least 10 young stellar objects within EGGs indicates that newly formed stars are emerging into the interior of the H ii region at a rate of stars year-1. If this represents star formation behind an ionization shock that is still advancing along the columns, as argued above, then this should be a good indication of the current rate of star formation that is taking place behind the shock. This rate is in line with the integrated star formation history of the cluster. Hillenbrand et al. (1993) finds that the IMF in M 16 is close to Salpeter, with 141 stars with masses greater than 5 M☉. Integrating a Salpeter IMF and assuming a cluster age of years gives an average star formation rate across the entire cluster of stars year-1, or 20 times the star formation rate in the columns inferred from the McCaughrean and Andersen (2001) data. This is also a reasonable order-of-magnitude rate if star formation based on the available gas and the rate at which the ionization shock is advancing through the columns. Observations in C18O by White et al. (1999) show about 200 M☉ of molecular gas in the columns. A star formation rate of stars year-1 is fully consistent with converting this much gas into low-mass stars in a shock crossing time of years and a star formation efficiency of a few tens of percent.
A survey by Visser, Richer, and Chandler (2002) of the protostellar population in Oph and Lynds dark clouds led those authors to conclude that the lifetime of the Class 0 stage is years. A model developed by Whitworth & Ward-Thompson (2001) similarly predicts a lifetime of almost years for the Class 0 stage. The correlation between the Class 0 stage of protostar evolution and water maser activity (Furuya et al., 2001) thus suggests that the typical maser-producing lifetime of an isolated protostar is years. If stars are forming within Columns 1, 2, and 3 at an ongoing rate of stars year-1, and if each remains in a potentially maser-producing phase for years, then we would expect there to be about 100 protostars capable of producing masers in these columns. The fraction of such protostars that actually exhibit water maser activity at any given time is about 30% in the case of isolated low-mass star formation (Claussen et al., 1996; Furuya et al., 2001), so we might expect to see several tens of water masers in the M16 columns. Instead we see one: M16 Column 2.
Our observations of maser activity in other H ii regions bear out our conclusion that water maser activity is less likely to be seen in association with protostars in H ii region environments. NGC 6357 in particular shows clear evidence of ongoing star formation near the ionization front (Felli et al., 1990), but no water maser emission associated with that star formation. We tentatively conclude that a much smaller fraction of young protostars excite water maser emission in H ii region environments than in regions of isolated star formation. An expanded, unbiased survey of water maser emission in H ii regions is needed to strengthen this conclusion.
4.3 Disruption of Star Forming Environments by the Advancing Ionization Front
In the preceding paragraph, we find that water maser emission is less likely to be seen in association with protostars in H ii region environments. Possible explanations for this effect can be broadly divided into two groups: intrinsic properties of star-forming cores and protostars in H ii regions, and external environmental effects associated with the ongoing evolution of the H ii region. The first group of explanations might address questions such as whether the triggering mechanism leads to a shorter duration of the maser excitation phase or a lower duty cycle of water maser activity. Little is know about the detailed differences between the triggered collapse of a protostar and the collapse of a protostar in isolation, so there is little we can say about these possible explanations for the low rate of maser activity. Much more observational and theoretical work is needed on the details of triggered collapse.
On the other hand, the evolution of the H ii region environment as a whole is much easier to observe and much better characterized. In this environment, the ionization shock triggers the collapse of cores, as discussed above. Some time later, these cores, and any protostars they contain, will be overrun by the advancing photodissociation region and then by the ionization front itself. The space velocity of a D-type ionization front trailing an ionization shock is very close to the space velocity of the ionization shock itself. In the case of M16, for example, the distance between the ionization front and the ionization shock is observed to be about 0.2 pc (Fukuda, Hanawa, & Sugitani, 2002), while the shock speed is about 1.3 km s-1. A dense core overrun by the ionization shock will therefore be uncovered by the ionization front within about years. Maser emission requires that the protostar be embedded within dense molecular material (Elitzer, 1992). This is both expected theoretically, and borne out by the fact that no masers are observed around sources located in the low density interiors of H ii regions. So, as the ionization front arrives, the maser-exciting lifetime of a protostar will come to an end.
A lot must happen in the years between the triggering of star formation and the arrival of the ionization front. In isolation, for example, the free fall time for a 1 M☉ core with a temperature of 10 K is about years. Many and perhaps most potentially star-forming cores will be overrun before they form stars at all. These could account for some of the EGGs that are not seen to contain 2 sources. Other “empty” EGGs may contain protostars and brown dwarfs that are simply not yet visible at 2. Other protostars might have just begun their maser-producing phase when they are uncovered. If this mechanism is the correct explanation for our observations, it requires that the typical protostar in M16 has its maser-producing lifetime shortened by a factor of ten. This number is not out of line with the fact that only about 15% of EGGs are known to have reached the point of forming protostars at all.
If our interpretation is correct, it has significant implications for the process of star formation in H ii region environments. It means that the objects observed by (McCaughrean and Andersen, 2001) as they emerge from the columns in M16 were still potentially maser-producing protostars prior to exposure. In other words, it seems likely that these objects were still accreting mass up until the time they were overrun by the ionization front, as originally proposed by (Hester et al., 1996).
A possible objection to the star formation scenario discussed here is that the accretion luminosity associated with triggered star formation should be seen. In the scenario that we propose, a forming protostar must radiate away its binding energy in the years between the triggering of collapse and the subsequent disruption of the region by the ionization front. This implies that a protostar must have an accretion luminosity of 100 . We require that M 16 Column 2, for example, contain perhaps 25 protostars. The ratio of the submillimeter luminosity of a protostar to its bolometric luminosity is about 0.005 André (1996), so we predict that the submillimeter luminosity from Column 2 due to protostars should be about 13 . This is a factor of 30 less than the submillimeter luminosity of Column 2 observed by White et al. (1999). In other words, the submillimeter luminosity due to protostars would be hard to recognize against the background luminosity of the dust in the columns. This is true even if protostars radiate a much larger fraction of their luminosity at submillimeter wavelengths.
An embedded protostar will not be visible in the near infrared, and its accretion luminosity will fall off rapidly once it is uncovered by the ionization front. There is only a brief window of time, just as the protostar emerges from the molecular cloud, when the accretion luminosity of the protostar might be observed directly. It is therefore significant that Thompson, Smith, and Hester (2002) observed two such luminous protostars (ES-1 and ES-2, which have luminosities of 200 and 20 , respectively) sitting precisely at the ionization fronts in Columns 1 and 2. Two other luminous protostars (M16S-1 and M16S-2) with luminosities of 20 are located just outside of the ionization front in Column 3. It is hard to interpret these objects as anything other than protostars that were accreting up until the time they were overrun by the ionization front.
It is interesting to speculate about the role of triggering and subsequent disruption of star formation acting on larger scales and in more extreme environments. Scowen et. al. (1998) conducted a detailed comparison between the physical environments at ionization boundaries in 30 Doradus and the physical environments seen in local regions such as M16. Their conclusion was that conditions in these two types of regions are quite similar. The same ranges of pressures, temperatures, ionization stratification, and physical structures are present in both 30 Dor and M16. The difference between the two is simply a matter of overall scale. The much greater total flux from 30 Dor is able to impose these conditions over a much larger volume. The same mechanisms responsible for star formation in M 16 should then also be at work in giant H ii regions. High angular-resolution observations of water masers in 30 Dor (Lazendic et al., 2002) indeed show a close association between the H ii region/molecular cloud boundaries and the sites of active star formation.
5 Summary and Conclusions
We have searched six H ii regions for water maser emission associated with low-mass star formation. We detected a total of 16 water maser systems, with only the emission from S140 IRS 1 reported previously. The distribution of water masers within M16 and M20 is not random. Instead, the masers are strongly concentrated in regions that have recently been compressed by ionization shocks, and will be overrun by ionization fronts on timescales comparable to the maser-exciting lifetimes of protostars. We have also found that the fraction of protostars that excite masers is significantly lower in H ii region environments than in regions of isolated star formation.
The original motivation for this work was in part to test a scenario for star formation proposed by Hester et al. (1996) in their work on M16. Radiative energy from massive O and B stars is deposited at the surface of adjacent molecular clouds, where it drives a stratified photoionized photoevaporative flow away from the interface (Sankrit & Hester, 2000, and references therein), and drives an ionization shock into the molecular gas. Ongoing star formation that is originally triggered by the ionization shock is disrupted a short time later by the advance of the ionization front. Stars forming as a result of this process will pass through a well-defined series of stages, beginning as sub-Jeans cores, and ending as exposed young stellar objects, adrift within the ionized interior of the H ii region.
We found that the distribution of maser emission in H ii regions allowed us to test two specific predictions of this scenario for star formation: (1) low-mass star formation, if it is triggered by compression in advance of ionization fronts, should be localized near ionization fronts; and (2) low-mass stars should spend less time enshrouded in high density material in H ii region environments than they do in regions of isolated star formation. The findings of the present study are in accord with these predictions.
Much work remains before we can claim to have sorted out the complex process of star formation in H ii region environments. However, our data leave little doubt that pockets of star formation are triggered around H ii regions, and that the accretion phase of the star formation process proceeds differently in H ii region environments than in regions of isolated low-mass star formation. Since most low mass stars form in H ii region environments, understanding the details of this process is of great importance in answering a diverse set of questions ranging from the origins of the IMF to the environments in which planet formation occurs.
References
- André (1996) André, P. 1996, Mem. Soc. Ast. It., 67, 901
- André, Ward-Thompson, & Barsony (1993) André, P., Ward-Thompson, D., and Barsony, M. 1993, ApJ, 406, 122
- Bally et al. (2002) Bally, J., et al. 2002, AJ, 124, 2152
- Bertoldi (1989) Bertoldi, F. 1989, ApJ, 346, 735
- Bertoldi & McKee (1990) Bertoldi, F., and McKee, C.F. 1990, ApJ, 354, 529
- Blitz and Lada (1979) Blitz, L., and Lada, C.J. 1979, ApJ, 227, 152
- Bosch, Morrell, & Niemelä (1999) Bosch, G.L., Morrell, N.I., and Niemelä, V.S. 1999, RMxAA, 35, 85
- Cernicharo et al. (1998) Cernicharo, J., et al. 1998, Science, 282, 462
- Chernin (1995) Chernin, L.M. 1995, ApJ, 440, L97
- Clark (1980) Clark, B.G. 1980, A&A, 89, 377
- Claussen et al. (1996) Claussen, M.J., et al. 1996, ApJS, 106, 111
- Claussen et al. (1998) Claussen, M.J., et al. 1998, ApJ, 507, L79
- Claussen et al. (1999) Claussen, M.J., et al. 1999, AJ, 117, 1387
- Comoretto et al. (1990) Comoretto, G., et al. 1990, A&AS, 84, 179
- de Winter et al. (1997) de Winter, D., et al. 1997, A&AS, 121, 223
- Elitzer (1992) Elitzer, M. 1992, ARA&A, 30, 75
- Elmegreen & Lada (1977) Elmegreen, B., and Lada, C. 1977, ApJ, 214, 725
- Felli et al. (1990) Felli, M., et al. 1990, A&A, 232, 477
- Forster & Caswell (2000) Forster, J.R., and Caswell, J.L. 2000, ApJ, 530, 371
- Foster & Boss (1996) Foster, P.N., and Boss, A.P. 1996, ApJ, 468, 784
- Fukuda, Hanawa, & Sugitani (2002) Fukuda, N., Hanawa, T., and Sugitani, K. 2002, ApJ, 568, L127
- Furuya et al. (2000) Furuya, R.S., et al. 2000, ApJ, 542, L135
- Furuya et al. (2001) Furuya, R.S., et al. 2001, ApJ, 559, L143
- Furuya et al. (2003) Furuya, R.S., et al. 2003, ApJS, 144, 71
- Genzel and Downes (1977) Genzel, R., and Downes, D. 1977, A&AS, 30, 145
- Genzel and Downes (1979) Genzel, R., and Downes, D. 1979, A&A, 72, 234
- Georgelin & Georgelin (1976) Georgelin, Y.M., and Georgelin, Y.P. 1976, A&A, 49, 57
- Herbig and Dahm (2002) Herbig, G.H., and Dahm, S.E. 2002, AJ, 123, 304
- Hester et al. (1996) Hester, J.J., et al. 1996, AJ, 111, 2349
- Hester et al. (1999) Hester, J.J., et al. 1999, AAS Meeting 194, 68.10
- Hillenbrand et al. (1993) Hillenbrand, L.A., et al. 1993, AJ, 106, 1906
- Högbom (1974) Högbom, J.A. 1974, A&AS, 15, 417
- Knapp & Morris (1976) Knapp, G.R., Morris, M. 1976, ApJ, 204, 415
- Kohoutek, Mayer, & Lorenz (1999) Kohoutek, L, Mayer, P., and Lorenz, R. 1999, A&AS, 134, 129
- Lada & Lada (2003) Lada, C.J., and Lada, E.A. 2003, ARA&A, 41, 57
- Lada, Young, & Greene (1993) Lada, C.J., Young, E.T., and Greene, T.P. 1993, ApJ, 408, 471
- Lazendic et al. (2002) Lazendic, J.S., et al. 2002, MNRAS, 331, 969
- Lefloch & Cernicharo (2000) Lefloch, B., and Cernicharo, J. 2000, ApJ, 545, 340
- Lortet, Testor, & Niemela (1984) Lortet, M.C., Testor, G., and Niemela, V. 1984, A&A, 140, 24
- Lynds, Canzian, & O’Neil (1985) Lynds, B.T., Canzian, B.J., and O’Neil, Jr., E.J. 1985, ApJ, 288, 164
- Massi, Brand, and Felli (1997) Massi, F., Brand, J., and Felli, M. 1997, A&A, 320, 972
- McCaughrean and Andersen (2001) McCaughrean, M.J., and Andersen, M. 2001, ESO Press Release Photos 37a-e/01
- McCaughrean and Andersen (2002) McCaughrean, M.J., and Andersen, M. 2002, A&A, 389, 513
- Meehan et al. (1998) Meehan, L.S.G., Wilking, B.A., Claussen, M.J., Mundy, L.G., and Wootten, A. 1998, AJ, 115, 1599
- Neckel (1984) Neckel, T. 1984, A&A, 137, 58
- Ogura, Sugitani, & Pickles (2002) Ogura, K., Sugitani, K., and Pickles, A. 2002, AJ, 123, 2597
- Pilbratt et al. (1998) Pilbratt, G.L., et al. 1998, A&A, 333, L9
- Pismis (1959) Pismis, P. 1959, Bol. Obs. Tonantz. Tacub., 2, part no. 18, 37
- Preibisch et al. (2001) Preibisch, T., et al. 2001, A&A, 378, 539
- Preibisch & Smith (2002) Preibisch, T., and Smith, M.D. 2002, A&A, 383, 540
- Price et al. (2001) Price, S.D., et al. 2001, AJ, 121, 2819
- Rho et al. (2001) Rho, J., et al. 2001, ApJ, 562, 446
- Roger & Irwin (1982) Roger, R.S., and Irwin, J.A. 1982, ApJ, 256, 127
- Sagar & Joshi (1983) Sagar, R., and Joshi, U.C. 1983, MNRAS, 205, 747
- Sakellis et al. (1984) Sakellis, S., et al. 1984, PASP, 96, 543
- Sankrit & Hester (2000) Sankrit, R., and Hester., J.J. 2000, ApJ, 535, 847
- Schreyer et al. (1997) Schreyer, K., et al. 1997, A&A, 326, 347
- Scowen et. al. (1998) Scowen, P.A., et al. 1998, AJ, 116, 163
- Sharpless (1959) Sharpless, S. 1959, ApJS, 4, 257
- Sugitani et al. (2002) Sugitani, K., et al. 2002, ApJ, 565, L25
- Sung, Bessell, & Lee (1997) Sung, H., Bessell, M.S., and Lee, S. 1997, AJ, 114, 2644
- Thompson, Smith, and Hester (2002) Thompson, R.I., Smith, B.A., and Hester, J.J. 2002, ApJ, 570, 749
- Tofani et al. (1995) Tofani, G., et al. 1995, A&AS, 112, 299
- Valdettaro et al. (2002) Valdettaro, R., et al. 2002, A&A, 383, 244
- Visser, Richer, and Chandler (2002) Visser, A.E., Richer, J.S., and Chandler, C.J. 2002, AJ, 124, 2756
- Ward-Thompson et al. (2000) Ward-Thompson, D., et al. 2000, A&A, 355, 1122
- Weigelt et al. (2002) Weigelt, G., et al. 2002, A&A, 381, 905
- White et al. (1999) White, G.J., et al. 1999, A&A, 342, 233
- Whitworth & Ward-Thompson (2001) Whitworth, A.P., and Ward-Thompson, D. 2001, ApJ, 547, 317
- Yngvesson et al. (1975) Yngvesson, K.S., et al. 1975, ApJ, 195, 91
| Name | (2000) | (2000) | Observation Dates | Velocity Range (km s-1) |
|---|---|---|---|---|
| NGC 2264 | 06 41 12.80 | +09 28 16.0 | 2000 Apr 04, Jun 13 | 14 to 28 |
| 06 41 19.82 | +09 27 16.0 | (C configuration) | ||
| 06 41 05.78 | +09 27 16.0 | |||
| 06 41 12.80 | +09 26 16.0 | |||
| 06 41 19.82 | +09 25 16.0 | |||
| 06 41 05.78 | +09 25 16.0 | |||
| 06 41 12.80 | +09 24 16.0 | |||
| NGC 6357 | 17 24 51.21 | 34 08 48.3 | 2001 Mar 26, May 18 | 5 to 37 |
| 17 24 41.55 | 34 08 48.3 | (B configuration) | ||
| 17 24 36.71 | 34 10 32.2 | |||
| 17 24 46.38 | 34 10 32.2 | |||
| 17 24 56.05 | 34 10 32.2 | |||
| 17 24 51.21 | 34 12 16.1 | |||
| 17 24 41.55 | 34 12 16.1 | |||
| M16 | 18 18 43.91 | 13 46 46.5 | 2000 Apr 02, Jun 06 | 4 to 46 |
| 18 18 40.93 | 13 48 39.0 | (C configuration) | ||
| 18 18 49.16 | 13 48 21.0 | |||
| 18 18 46.08 | 13 50 10.5 | |||
| 18 18 54.21 | 13 49 57.0 | |||
| 18 18 50.91 | 13 51 48.0 | |||
| 18 18 59.15 | 13 51 34.5 | |||
| 18 19 08.00 | 13 44 56.2 | 2001 Mar 26, May 18 | 4 to 46 | |
| 18 18 53.59 | 13 44 44.2 | (B configuration) | ||
| 18 18 45.35 | 13 44 44.2 | |||
| 18 18 49.47 | 13 46 28.1 | |||
| 18 18 51.53 | 13 49 32.2 | |||
| 18 18 56.48 | 13 51 08.0 | |||
| 18 19 14.60 | 13 50 19.4 | |||
| 18 19 08.02 | 13 51 31.7 | |||
| 18 19 09.03 | 13 53 30.8 | |||
| 18 19 01.44 | 13 52 43.9 | |||
| 18 19 02.45 | 13 54 43.0 | |||
| 18 18 54.86 | 13 53 56.1 | |||
| 18 18 55.87 | 13 55 55.2 | |||
| 18 18 58.83 | 13 52 47.1 | 2002 Mar 14 | 15 to 65 | |
| 18 19 03.72 | 13 52 03.7 | (A configuration) | ||
| 18 18 48.90 | 13 49 50.0 | |||
| 18 18 50.42 | 13 48 51.8 | |||
| 18 18 46.20 | 13 44 27.0 | |||
| 18 18 48.71 | 13 45 20.9 | |||
| 18 19 07.10 | 13 45 25.0 | |||
| 18 19 24.95 | 13 45 40.3 | |||
| M20 | 18 02 32.24 | 23 01 51.0 | 2000 Apr 02, Jun 06 | 2 to 40 |
| 18 02 23.55 | 23 01 51.0 | (C configuration) | ||
| 18 02 36.59 | 23 03 35.0 | |||
| 18 02 27.90 | 23 03 35.0 | |||
| 18 02 19.20 | 23 03 35.0 | |||
| 18 02 32.24 | 23 05 19.0 | |||
| 18 02 23.55 | 23 05 19.0 | |||
| 18 02 33.20 | 22 58 05.4 | 2001 Mar 26, May 18 | 2 to 40 | |
| 18 02 24.51 | 22 58 05.4 | (B configuration) | ||
| 18 02 28.86 | 23 03 43.1 | |||
| 18 02 11.47 | 23 03 43.1 | |||
| 18 02 07.12 | 23 05 27.1 | |||
| 18 02 15.81 | 23 05 27.1 | |||
| 18 02 24.51 | 23 05 27.1 | |||
| 18 02 33.20 | 23 05 27.1 | |||
| 18 02 48.42 | 23 05 06.3 | |||
| 18 02 37.55 | 23 07 11.0 | |||
| 18 02 28.86 | 23 07 11.0 | |||
| 18 02 20.16 | 23 07 11.0 | |||
| 18 02 06.00 | 23 05 27.0 | 2002 Mar 14 | 21 to 59 | |
| 18 02 30.92 | 23 05 49.0 | (A configuration) | ||
| 18 02 28.47 | 23 03 49.0 | |||
| S125 | 21 53 49.27 | +47 17 59.9 | 2001 Mar 26, May 18 | 13 to 29 |
| 21 53 49.27 | +47 15 59.9 | (B configuration) | ||
| 21 53 49.27 | +47 13 59.9 | |||
| 21 53 39.06 | +47 12 59.9 | |||
| 21 53 39.06 | +47 14 59.9 | |||
| 21 53 39.06 | +47 16 59.9 | |||
| 21 53 39.06 | +47 18 59.9 | |||
| 21 53 28.85 | +47 19 59.9 | |||
| 21 53 28.85 | +47 17 59.9 | |||
| 21 53 28.85 | +47 15 59.9 | |||
| 21 53 28.85 | +47 13 59.9 | |||
| 21 53 28.85 | +47 11 59.9 | |||
| 21 53 18.64 | +47 12 59.9 | |||
| 21 53 18.64 | +47 14 59.9 | |||
| 21 53 18.64 | +47 16 59.9 | |||
| 21 53 18.64 | +47 18 59.9 | |||
| 21 53 08.43 | +47 17 59.9 | |||
| 21 53 08.43 | +47 15 59.9 | |||
| 21 53 08.43 | +47 13 59.9 | |||
| S140 | 22 18 50.88 | +63 17 18.0 | 2000 June 06 | 33 to 9 |
| 22 19 01.56 | +63 18 55.5 | (C configuration) | ||
| 22 19 08.90 | +63 17 04.5 | |||
| 22 19 19.35 | +63 18 45.0 | |||
| 22 19 26.91 | +63 16 54.0 | |||
| 22 19 37.14 | +63 18 33.0 | |||
| 22 19 44.71 | +63 16 40.5 |
| Name | Source | Obs. Date | Configuration | Flux Density (Jy) |
|---|---|---|---|---|
| 0137331 | primary cal. | 2000 Apr 02 | C | 1.19 |
| primary cal. | 2000 Apr 04 | C | 1.19 | |
| primary cal. | 2000 Jun 06 | C | 1.19 | |
| primary cal. | 2000 Jun 13 | C | 1.19 | |
| primary cal. | 2001 Mar 26 | B | 1.32 | |
| primary cal. | 2001 May 18 | B | 1.31 | |
| 1331305 | primary cal. | 2002 Mar 14 | A | 2.54 |
| 0700171 | NGC 2264 | 2000 Apr 04 | C | 0.95 |
| NGC 2264 | 2000 Jun 13 | C | 0.84 | |
| 1733130 | M16 | 2000 Apr 02 | C | 3.61 |
| 1733130 | M16 | 2000 Jun 06 | C | 4.15 |
| 1733130 | M16, NGC 6357 | 2001 Mar 26 | B | 8.37 |
| 1733130 | M16, NGC 6357 | 2001 May 18 | B | 6.99 |
| 1733130 | M16 | 2002 Mar 14 | A | 7.37 |
| 1820254 | M20 | 2002 Mar 14 | A | 0.78 |
| 1911201 | M20 | 2000 Apr 02 | C | 3.89 |
| 1911201 | M20 | 2000 Jun 06 | C | 3.46 |
| 1911201 | M20 | 2001 Mar 26 | B | 3.95 |
| 1911201 | M20 | 2001 May 18 | B | 3.33 |
| 2022616 | S140 | 2000 Jun 06 | C | 2.23 |
| 2202422 | S125 | 2001 Mar 26 | B | 3.57 |
| 2202422 | S125 | 2001 May 18 | B | 3.01 |
| Name | (2000) | (2000) | Date | Peak Flux Density(Jy) | Peak Velocity (km s-1) |
|---|---|---|---|---|---|
| M16 Col. 2 | 18 18 48.8950 | 13 49 50.100 | 2000 Apr 02 | 14.9 | +21.4 |
| 18 18 48.8950 | 13 49 50.100 | 2000 Jun 06 | 20.7 | +22.0 | |
| 18 18 48.8871 | 13 49 49.950 | 2001 Mar 26 | 1.17, 0.38, 0.50 | +14.8, +18.7, +22.7 | |
| 18 18 48.9186 | 13 49 50.429 | 2001 May 18 | 0.84 | +23.4 | |
| 18 18 48.8918 | 13 49 50.075 | 2002 Mar 14 | 0.13 | +21.8 | |
| M16 Col. 4 | 18 18 58.8341 | 13 52 47.300 | 2000 Apr 02 | 2.71 | +25.7 |
| 18 18 58.8341 | 13 52 47.500 | 2000 Jun 06 | 0.68, 1.06 | +24.7, +28.0 | |
| 18 18 58.8193 | 13 52 47.123 | 2001 Mar 26 | 10.6, 0.45 | +26.0, +28.3 | |
| 18 18 58.8564 | 13 52 47.843 | 2001 May 18 | 1.52, 0.41 | +25.7, +26.3 | |
| 18 18 58.8228 | 13 52 47.190 | 2002 Mar 14 | 0.49 | +23.4 | |
| M16 Col. 5 | |||||
| A | 18 19 07.0908 | 13 45 24.590 | 2001 Mar 26 | 6.74, 2.97 | +16.4, +21.1 |
| A | 18 19 07.1567 | 13 45 24.770 | 2001 May 18 | 2.74, 1.48 | +16.4, +20.7 |
| A | 18 19 07.1233 | 13 45 24.600 | 2002 Mar 14 | 3.72, 5.31 | +16.2, +20.8 |
| B | 18 19 07.0008 | 13 45 21.375 | 2002 Mar 14 | 0.19 | +32.2 |
| C | 18 19 07.3375 | 13 45 23.123 | 2002 Mar 14 | 1.49 | +26.9 |
| M16 N Bay | |||||
| A | 18 18 46.4247 | 13 44 25.730 | 2001 Mar 26 | 1.18, 6.31 | +15.7, +24.7 |
| A | 18 18 46.4247 | 13 44 25.550 | 2001 May 18 | 1.79, 2.93 | +15.8, +24.7 |
| B | 18 18 46.0747 | 13 44 30.530 | 2001 May 18 | 1.77 | +14.8 |
| B | 18 18 46.0943 | 13 44 30.835 | 2002 Mar 14 | 0.24 | +6.3 |
| C | 18 18 46.7130 | 13 44 14.165 | 2002 Mar 14 | 0.10, 0.14, 0.12 | +7.0, +16.9, +26.2 |
| M20 SE | 18 02 30.9210 | 23 05 49.200 | 2000 Apr 02 | 0.59 | +24.9 |
| 18 02 30.9210 | 23 05 49.200 | 2000 Jun 06 | 0.24 | +25.3 | |
| M20 TC3 | |||||
| A | 18 02 05.7924 | 23 05 25.022 | 2001 Mar 26 | 0.63, 0.32, 0.28 | +5.5, +20.3, +25.3 |
| A | 18 02 05.7924 | 23 05 24.902 | 2001 May 18 | 0.63, 0.43, 0.24 | +5.2, +20.0, +25.6 |
| A | 18 02 05.7880 | 23 05 24.990 | 2002 Mar 14 | 0.42, 2.81, 0.77, | 12.2, +16.1, +20.2, |
| 6.43, 0.22 | +25.8 +33.7 | ||||
| B | 18 02 05.5880 | 23 05 29.162 | 2001 Mar 26 | 0.38 | +2.5 |
| B | 18 02 05.5804 | 23 05 29.205 | 2002 Mar 14 | 2.44, 22.7, 0.42 | 14.8, 11.8, 3.6 |
| C | 18 02 06.2446 | 23 05 23.402 | 2001 May 18 | 0.35 | +24.9 |
| NGC 2264 | 06 41 12.2593 | +09 29 12.000 | 2000 Apr 04 | 0.57 | +2.6 |
| 06 41 12.2593 | +09 29 11.800 | 2000 Jun 13 | 0.43 | +2.6 | |
| S140 | |||||
| A | 22 19 18.2219 | +63 18 46.800 | 2000 Jun 06 | 0.59, 2.37 | 15.3, +3.5 |
| B | 22 19 16.0846 | +63 18 38.798 | 2000 Jun 06 | 1.46 | 17.9 |
| C | 22 19 21.1314 | +63 18 54.599 | 2000 Jun 06 | 0.96 | 5.7 |