Wind-wind collision in the Carinae binary system: a shell-like event near periastron
Abstract
The exact nature of Carinae is still an open issue. Strict periodicity in the light curves at several wavelengths seem to point out to a binary system, but the observed radial velocities, measured from space with high spatial resolution are in conflict with the ground based observations used to calculate the binary orbit. Also, the observed 2-10 keV X-ray flux is much larger that what is expected from a single star, and favors the wind-wind collision hypothesis, characteristic of high mass binary systems. However, to explain the duration of the dip in the light curve by wind collisions, it is necessary to postulate a very large increase in the Carinae mass loss rate. Finally, the optical and UV light curves are better explained by periodic shell-ejection events. In this paper we conciliate the two hypothesis. We still assume a binary system to explain the strong X-ray emission, but we also take into account that, near periastron and because of the highly eccentric orbit, the wind emerging from Carinae accumulates behind the shock and can mimic a shell-like ejection event. For this process to be effective, at periastron the secondary star should be located between Carinae and the observer, solving also the discrepancy between the orbital parameters derived from ground and space based observations. We show that, as the secondary moves in its orbit, the shell cools down and the number of available stellar ionizing photons is not enough to maintain the shell temperature at its equilibrium value of about 7500 K. The central part of the shell remains cold and under these conditions grain formation and growth can take place in timescales of hours. We also calculated the neutral gas column density intercepting the line of sight at each point of the orbit near periastron, and were able to reproduce the form and duration of the X-ray light curve without any change in the Carinae mass loss rate. This same column density can explain the observed H light curve observed during the 2003 event.
keywords:
stars: individual ( Car) binaries: general stars: variable X-rays: stars1 Introduction
Carinae is a peculiar star surrounded by a dense cloud of gas and dust, formed in several episodes of mass ejection, typical of LBV stars. Its mass, calculated from the bolometric luminosity, corresponds to approximately 120 M⊙, making Carinae, if single, the most massive star in the Galaxy. During the last years strong evidences of the system binary nature were reported: a 5.52 year periodicity in the light curve at infrared wavelengths (Whitelock et al., 1994), in the HeI 10830 Å high excitation line (Damineli, 1996) and in the radial velocity of the Pa line, the latter pointing out to a highly eccentric orbit (Damineli, Conti & Lopes, 1997; Davidson, 1997). The 5.52-year periodicity was also found at centimeter and millimeter wavelengths (Cox et al., 1995; Abraham & Damineli, 1999; Duncan & White, 2003; Abraham et al., 2003). VLBI observations showed a very compact emitting region, coincident with the star position at the minimum in the light curve, which grew to an extended and elongated feature at maximum (Duncan, White & Lim, 1997), indicating the probable existence of an ionized disk of variable size. Infrared observations also showed a compact disk, with a power law spectrum between 2 and 8 m, attributed to thermal emission by dust at temperatures between 1500 and 400 K (Morris et al., 1999).
A draw back in the binary system hypothesis came from the high resolution spectroscopic observations of Carinae (Davidson et al., 2000), which showed that, although the radial velocity of the emission lines formed close to the star varied at the different phases of the binary orbit, they were incompatible with the orbital parameters derived by Damineli et al. (1997). Without the assumption of a binary companion, the spectroscopic events could be explained if they were the result of periodic shell ejections (Zanella, Wolf & Stahl, 1984; Davidson et al., 1999; Martin & Koppelman, 2004). Under these conditions, the dense gas in the shell would screen the stellar UV radiation, responsible for the formation of the ionized envelope surrounding Carinae, favoring also the formation of dust, which could explain the enhanced IR emission.
On the other hand, a strong argument in favor of the binary hypothesis is based in the intensity of the observed X-ray emission, which cannot be explained by shell ejection but can be easily accounted for by free-free emission from wind-wind collisions (Pittard et al., 1998). In fact, this process was already postulated in other massive binary systems to explain the differences between the observed X-ray emission ( erg s-1) and what is expected from individual stars ( erg s-1) (Prilutskii & Usov, 1976; Pollock, 1987; Zhekov & Skinner, 2000).
The 1997 and 2003 events, characterized by minima in the light curves at other wavelengths, were also observed at X-rays, preceded by a strong increase in the flux density. The enhanced emission was attributed to an increase in the wind-wind collision strength as the stars approach each other during periastron passage; the sharp decrease towards the minima was assumed to be produced by an increase in the H column density, perhaps as the result of an increase in the Carinae mass loss rate (Pittard et al., 1998; Corcoran et al., 2001a; Pittard & Corcoran, 2002).
In this paper we conciliate the two hypothesis: a binary system and a shell ejection-like event. We use the binary system to explain the X-ray emission by shock formation in the wind-wind collision. What we call the shell ejection-like event is the appearence of dense material between the observer and the binary system, formed by the stellar wind matter accumulated behind the cool expanding shock remnant. For this process to be effective in absorbing the X-rays, the periastron must be in the oposite direction of what was proposed by Damineli et al. (2000) and Corcoran et al. (2001a), being compatible with the observations reported by Davidson et al. (2000). We show that in this event dust can be formed in the shock interface, where the gas cools down by radiation and it is shielded from the UV stellar radiation by the large amount of accumulated gas. The dense gas and dust shell will eventually expand and form a disk in the plane of the orbit, its internal parts will be ionized by the UV radiation of the two stars in the binary system and will be seen at radio wavelengths as free-free emission. The disk will also slow down the wind of Carinae in the plane of the orbit, which could contribute with other effects (e.g. non symmetrical wind from the massive rotating primary star) to the latitude-dependent behavior observed by Smith et al. (2003).
In Section 2 of this paper we calculate the physical conditions in the shocked region, taking into account radiative absorption and emission. In Section 3 we calculate the grain formation rate and in Section 4 we compare our results with the optical and UV observations of the 2003 low excitation event reported by Martin & Koppelman (2004). Finnaly in Section 5 we present the derived X-ray light curves for different values of the orbital parameters and of the Carinae mass loss rate and in Section 6 we present our conclusions.
2 The Shock Model
In massive binary stellar systems, in which both stars present high mass loss rates in the form of supersonic winds, a shocked region is formed between the two stars, resulting in an increase of gas density and temperature. One of the main observational signatures of this process is the strong X-ray emission, since in supersonic shocks the gas temperature increases from K to K and free-free emission becomes very important; this kind of process is now commonly associated to wind collisions in many objects (Corcoran et al., 2001a; Thaller et al., 2001; Lépine et al., 2001). The strength of the shock depends on the separation between the stars and it can increase dramatically during periastron passage in highly eccentric orbits, as seems to occur in the Carinae system.
For the study of the shock region we used, as in Chlebowski (1989) and Usov (1992), the basic hydrodynamics equations for mass continuity, fluid momentum and energy conservation, neglecting magnetic fields. Considering an adiabatic stationary shock, the jump conditions are given by:
| (1) |
| (2) |
| (3) |
where is the gas density, the relative wind velocity, the gas pressure and the adiabatic exponent; indices 1 and 2 indicate pre and post-shock parameters. From equations (1) - (3) we can calculate the jump relations for density and temperature:
| (4) |
| (5) |
where is the Mach number, the molecular weight and the mass of the H atom.
The shock front is formed at a distance from the primary star given by:
| (6) |
where is the distance between the two stars and . and are the mass loss rates of Carinae and the companion star, respectively, and and their assimptotic wind velocities.
For the Carinae system, no direct information is available about the individual masses, compositions and mass-loss rates since, even with the very high spatial resolution achieved by the HST, it was not possible to separate the stellar spectra from that of the surrounding nebula. Hillier et al. (2001), analyzing the P Cygni velocity profiles, favored a mass-loss rate of , while Pittard & Corcoran (2002) found that a mass-loss rate of fitted better the X-ray spectra obtained with the Chandra grating spectrometer. Observations indicate that Carinae has a terminal wind velocity of km s-1 (Hillier et al., 2001); its companion is probably an OB or WR type star (Damineli et al., 2000), with typical wind parameters, e.g. and km s-1 (Abbott et. al., 1986; Lamers, 2001; Pittard & Corcoran, 2002).
The orbital parameters are also uncertain. While Damineli et al. (1997) obtained an eccentricity from the radial velocity of the Pa and Pa lines, Davidson (1997), analyzing the same data found that an eccentricity of 0.8 fitted better the radial velocity curve. An even higher eccentricity was postulated by Corcoran et al. (2001a) () to reproduce the X-ray light curve.
Therefore, to calculate the physical parameters at the shock region, we will assume , , , km s-1 and km s-1. Under these conditions, we find that at periastron A.U., cm-3 for the Carinae wind and cm-3 for the wind of the secondary star, where is the gas number density. From equations (4) and (5) and assuming K for both winds, the post-shock density and temperature for Carinae and the companion star winds turned out to be cm-3, cm-3, K and K. These results are compatible with the limits imposed to the density and temperature by the recent X-ray spectral observations (Seward et al., 2001; Corcoran et al., 2001b).
As a consequence of the high temperature and density at the shock region, the gas emits large amounts of radiation and cools down. This process is totally described by the first law of thermodynamics; considering also isobaric transformations for gas equilibrium we can write:
| (7) |
where represents the thermal conduction, and the energy gain and loss functions, respectively.
At high temperatures, the cooling function is dominated by free-free radiation and can be expresed by (Spitzer, 1978):
| (8) |
where and represent the number density of ions and electrons, respectively.
At lower temperatures line transitions become important; the cooling function due to a transition of energy , for an element with abundance is:
| (9) |
where is the element degree of ionization, and are the collisional excitation and de-excitation parameters and is the spontaneous emission rate. An approximate fit for the line cooling function was given by Matthews & Doane (1990):
| (10) |
where , , and .
The photoionization heating function (erg s-1 cm3) is given by (Osterbrock, 1974):
| (11) |
where is the photoionization cross section, is the atomic number, is the Gaunt factor, is the Lyman limit frequency and is the photon mean intensity.
The time dependence of the gas temperature, determined from Equation (7), is shown in figure 1 for an initial temperature of K and several values of the shock gas density; the equilibrium temperature of the ionized region turned out to be in all cases K. For lower initial temperatures the cooling time is even shorter.

Clearly, at this temperature dust grains cannot be formed or survive. However, we will show that the two stars cannot provide enough ultraviolet photons to ionize all the material that accumulates behind the shock. The neutral gas will then act as a shield behind which dust can be formed.
To quantify this statement we will consider that the matter from the Carinae wind accumulates behind the shock during the cooling time (about 1 day), which corresponds, at periastron, to a thickness of the accumulated gas of about cm.
On the other hand, the thickness of the ionized region can be calculated, using typical O type stellar parameters, solving the equation:
| (12) |
where is the stellar radius, the flux density at the stellar surface and the hydrogen recombination coefficient. The solution of Equation (12) gives cm, much smaller than the thickness of the material accumulated behind the shock front. The region will have a stratified structure, as shown in figure 2. At the borders (a), the stellar radiation heats and ionizes the gas. Just after this region (b) the high opacity maintains the gas neutral. Equation (7) will still give the equilibrium temperature, but with the photon intensity in Equation (11) given by:
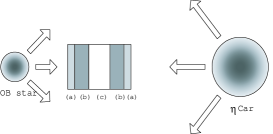
| (13) |
where is the distance from the star and the optical depth at frequency .
The equilibrium temperature will go from K, at the boundary with the ionized region, to K at the center of the shell (region ”c” in fig. 2). In these conditions dust grains may be formed and also grow.
3 Grain Formation
Grain formation is not a totally understood process, it envolves calculations over several elements and species, coupled to each other. To compute the kinetic equations of grain composition and evolution, the nucleation theory of moments is needed (Gail, Keller & Sedlmayr, 1984; Gail & Sedlmayr, 1987). However, just to estimate the mean particle size and the growth timescale, the classical nucleation theory is a good approach (Hoyle & Wickramasinghe 1991). The dust growth and evaporation rates, described by this theory, are given by:
| (14) |
where is the grain radius, the specific density of the grain material, its atomic mass number and the sticking coefficient. The evaporation rate is given by:
| (15) |
where is the evaporation pressure.
The chemical composition of the material that will form the grains is not known. The nebula around Carinae is N rich and C and O poor (Davidson et al., 1986); infrared observations show the caracteristic 8-13 m silicate feature (Robinson et al., 1987). However, HST observations detected CII and CIV lines, probably formed in the wind of the secondary star, showing a carbon-rich inner environment (Lamers, 2001). For that reason, we will analyze the formation rates of both carbonaceous and silicate grains.
Experimental data show that carbon dust (Cn) condensates at temperatures of about K at the pressure dyn cm-2 and that nucleation is efficient if (Draine & Salpeter 1979; Gail, et al. 1984; Gail & Sedlmayr 1987; Andriesse, Donn & Viotti 1978; Hoyle & Wickramasinghe 1991). This condition is fully satisfied in the neutral gas region of the shell. Applying equations (14) and (15) for the post-shock equilibrium values we verify that equation (14) dominates over equation (15), allowing dust growth in the internal region (part ”c” of figure 2). For large grains, evaporation becomes important and an equilibrium size for the dust is obtained from the condition . For graphite, using g cm-3 (Draine & Lee 1984), (Savage & Sembach, 1996) and , we obtained . The growth occurs in a time scale given by , which is of h. It means that, after the shock is formed, the time needed for gas cooling and further dust formation and growth to aproximately cm is of several hours.
Considering now silicate dust formation (SiO), the saturation pressure is dyn/cm2, which gives K (Lefevre 1979). Considering a density g cm-3 and using equations 14 and 15 we find that the grains form with a mean radius of in a timescale of h. These results are similar to those obtained considering amorphous carbon dust.
Dust formation in the post-shock gas is also in agreement with recent observations of the binary system WR140, which shows periodic events at each periastron passage (Monnier, Tuthill & Danchi 2001). The same occurs in WR106, WR104 and WR137 where an increase and consequent decay in IR flux is observed (Cohen & Vogel, 1978; Pitault et al., 1983; Cohen, 1995; Kwok, Volk & Bidelman, 1997; Williams, Kidger & van der Hucht, 2001; Kato et al., 2002).
4 Shell-like efects
The grain population formed during periastron passage must be the main source of visible and UV radiation absorption. Only recently, observations reached enough spatial resolution to separate the stellar system from the surrounding nebula. During the 2003 low excitation event, the data presented by Martin & Koppelman (2004) showed a wavelength dependent dip in the light curves for 2200, 2500, 3300 and 5500 Å, the corresponding absorption was 0.5, 0.38, 0.17 and 0.01 mag, compatible with the interstellar absorption law with and mag (Fitzpatrick, 1999). Notice that the high absorption at 2160 Å in the interstellar medium is mainly due to C (Mathis, Rumpl & Nordsieck, 1977), which is underabundant in the Carinae wind, but is probably present in the wind of the companion star (Hillier et al., 2001). Another explanation for the larger decrease in the observed flux at the lowest wavelength, which mimics absorption by interstellar dust, is the decrease in the strength of the FeII emission lines that also occurs during the low excitation events (Gull, Davidson & Ishibashi, 2000), in which case a lower amount of carbonaceous grains would be needed to explain the decrease in the emission.
If the dip in the observed light curves were due to absorption by dust with properties similar to those of the interstellar dust, the needed H column density would be (Bohling, Savage & Drake, 1978):
| (16) |
As we saw in Section 2, the H column density at the shock is about an order of magnitude higher than what is needed to explain the UV light curve dip, implying that either the fraction of dust formed at the shock is only of the amount found in the interstellar medium, or that the dust formation region covers only a fraction of the UV emitting region.
Another consequence of the shell-like effect is the behavior of the H line and its adjacent continuum, as reported also by Martin & Koppelman (2004). While the 6770 Å continuum did not show any signs of absorption during the low excitation phase, as expected from the low optical depth of the grain population at this wavelength, the H emission presented a significant decrease. In the scenario presented in this paper, we interpret the variation in the H light curve not as a decrease in the intrinsic emission, but as an absorption by the neutral gas in the shock front. Under these circumstances, the absorbed flux , integrated across the line profile will be:
| (17) |
where is the frequency of the H line, the Einstein coefficient for the transition and the column density of H atoms in the energy level , corresponding to the principal quantum number 2:
| (18) |
From the observations of Martin & Koppelman (2004), erg cm-2 s-1 and erg cm-2 s-1, which implies that a column density cm-2 is necessary to produce the observed decrease in the H flux. This is compatible with the inferred H column densities and temperatures of the order of 1000 K expected in the neutral region.
The interpretation of the IR light curve is complicated by the contribution of several sources (Whitelock et al., 1994). The amount of dust produced in our model is very small compared to the total amount of dust in the Carinae nebula, formed probably after the major events of mass ejection. Besides, in our model the dust formation process is only effective during a short time (around periastron passage) compared to the 5.5-year orbital period. However, since the predicted dust temperature is high, maybe it could be related to the emission at short wavelengths observed by Morris et al. (1999) and Hony et al. (2001), also explaining its anticorrelation with the low excitation events seen at other wavelengths (Whitelock et al., 1994). The presence of a dip in the near infrared light curves, coincident with the minimum at other wavelengths (Feast, Whitelock & Marang, 2001), can be easily explained if part of the IR emission is produced by the free-free process, in the same region that originates the optically thick millimiter spectrum.
5 The 2-10 keV Light Curve of Car
The emitted X-rays will be absorbed by matter intercepting the line of sight, regardless if it is in the form of free atoms and molecules or if it is condensed in grains. Corcoran et al. (2001a) were able to reproduce the X-ray light curve of the 1997 low excitation event assuming wind-wind collisions and a highly eccentric orbit. In their model, periastron occurs when the secondary is near opposition with the Earth and the minimum in the light curve can be explained by the increase in optical depth due to the denser wind of the primary star intercepting the line of sight. However, to fit the minimum duration, they had to postulate a strong increase in the Carinae mass loss rate when the distance between the two stars decreases.
In our work, we calculated the 2-10 keV X-rays emission, integrated over all the shock surface at different orbital phases, using the expression given by Usov (1992):
| (19) |
where is the mass loss rate of Car in , is the mass loss rate of the companion in , and the wind speeds in units of 1000 km s-1, and is the separation between the stars in AU. Notice the dependence of the total flux, due to the increase in the shock surface size as the distance between the two stars increases.
However, we assumed that periastron passage occurs when the secondary is near conjunction with the observer, as can be seen schematically in Figure 3. In fact, the actual position of the periastron relative to the observer depends on how the observations are interpreted. Damineli et al. (1997) used the periodic radial velocity variations of the Pa and Pa emission lines to determine the orbital parameters, assuming that they were formed in the Carinae wind. If, on the contrary, the lines are formed in the cooling, post-shock expanding gas (Hill et al., 2000, 2002), the periastron will be in the opposite direction, as assumed in our work and required by the observations of Davidson et al. (2000).
In our scenario, as the secondary moves in its orbit, it leaves behind a dense and cool region, moving away from Carinae with velocity of about 150 km s-1. Matter from the primary wind will be shocked to temperatures about K and, after isobarically cooled, it will reach densities of cm-3. Although this material will not contribute to the observed X-ray emission, after conjunction it will be positioned between the X-ray producing wind-wind shock and the observer, as represented by the gray tail in Figure 3. Notice that the absorption is due to a much larger amount of material than that which results from the wind-wind shock. The major source is the matter accumulated to the left of the secondary, after the star has passed, due to the primary wind.
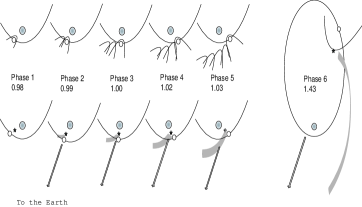
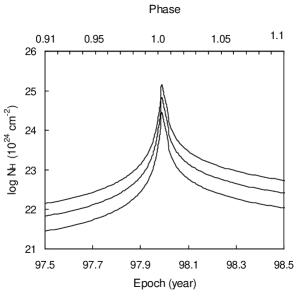
To calculate the amount of gas accumulated towards the line of sight at each orbital phase, we assumed that the observer is in the orbital plane of the binary system. Probably, this is not true (Damineli 1997), but even so, our result will not be changed appreciably if the the shell is thick. We divided the movement of the secondary star in its orbit into time steps and computed the amount of gas intercepting the line of sight at each step, taking into account the wind contribution from Carinae and the fact that the shell moves away from the star. The shell evolution is schematically shown in the lower part of figure 3, phase 1 represent the starting point of our calculations; before that, the shell stays always behind the shock, and no absorption is observed. At phase 2, the secondary is in conjunction, and at phase 3 it reaches periastron; at this point part of the expanding shell already intercepts the line of sight and the X-rays are absorbed; at phases 4 and 5 the column density and X-ray absorption increase. Eventually, the shell expands enough to return the absorption to its initial value. The resulting column density, as a function of epoch and phase, is shown in figure 4 for three values of the Carinar mass loss rate.
The model X-ray light curves, taken into account absorption, together with the data for the 1997 low excitation event (Ishibashi et al., 1999) are shown in figure 5. In all cases the mass loss rate of Carinae was taken as ; in the upper panel two values for the eccentricity were used: 0.9 (light line) and 0.95 (heavy line), assuming that the periastron passage coincides with conjunction (, where is the position angle of the secondary in its orbit, measured from Carinae); in the lower panel, the eccentricity was taken as 0.95 and the angle between periastron and conjunction was varied from (heavy line) to (light line). We see that in all cases the model reproduces fairly well the observations.
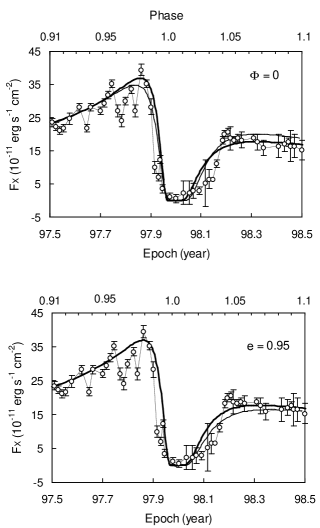
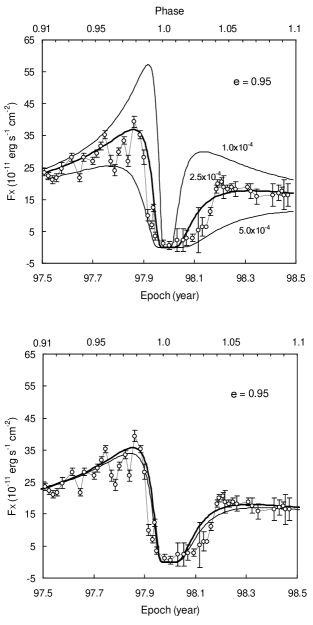
In the upper panel of figure 6 we compare the observations with model light curves for three values of the mass loss rate: , and M yr-1, with km s-1 and an orbit with and . In the lower panel we show the model X-ray light curves for two values of the primary wind velocity : 700 km s-1 (heavy curve) and 500 km s-1 (light curve) for a primary mass loss rate of M yr-1 and orbital parameters and . As we can see, the model light curve depends strongly on the mass loss rate and it is almost independent of the chosen velocity. The best fitting occurs for M yr-1, the value obtained by Pittard & Corcoran (2002) based in numerical simulations.
Although the calculations presented here are valid close to periastron passage, they should be able to reproduce the X-ray light curve at all phases. As the secondary moves in its orbit, the amount of material accumulated behind the shock intercepting the line of sight decreases, as shown in Figure 4. On the hand, as the star approaches opposition, the column density of material intercepting the line of sight due to the regular Carinae wind increases. However, Usov (1992) showed that the average hydrogen column density that produces the X-ray absorption decreases as the separation between the star increases because, although absorption is large at the shock center, the larger emitting area more than compensates this effect, as can be seen in the following equation:
| (20) |
In our scenario, at opposition AU, resulting in a column density cm-2, too low to produce significant absorption.
6 Conclusions
In this work we showed that the wind-wind collision model of a binary system in a highly eccentric orbit can explain the periodic events in the 2-10 keV X-ray light curve of Carinae, as well as the shell-like events at optical and UV wavelengths, without any increase in the primary mass loss rate, as postulated by Corcoran et al. (2001a).
As in previous works (Pittard et al., 1998; Corcoran et al., 2001a; Pittard & Corcoran, 2002), we calculated the physical conditions in the shock region close to periastron passage, for an eccentricity , mass loss rates of M yr-1 and M yr-1, and wind velocities km s-1 and km s-1. We obtained for the X-ray emitting region a density cm-3 and temperature K, in agreement with recent observations and numerical wind collision models (Pittard & Corcoran, 2002).
The difference with the cited papers is that in our work we took into account that the wind from Carinae accumulates behind the shock, forming a shell about cm thick. We then showed that, as the secondary moves in its orbit, the shell cools due to free-free and line emission. Also, the number of ionizing photons from Carinae and its companion star are only enough to maintain the gas temperature at its equilibrium value of about 7500 K in the external parts of the shell (109 cm in depth), leaving the central part neutral and cold. We calculated that in these conditions dust grains can form and grow in timescales of a few hours. These grains would absorb the optical and UV radiation emitted by the shock material as it cools down. We used the recent observations of the 2003 low excitation event, presented by Martin & Koppelman (2004), and showed that the decrease in the continuum flux at wavelengths of 2200, 2500, 3300 and 5500 Å can very well be explained in this scenario. On the other hand, the decrease in the observed H emission, without any similar effect in the adjacent continuum, was attributed by us to absorption by the neutral and cool H gas accumulated in the central region of the shell. From the amount of absorbed radiation we were able to calculate the number of hydrogen atoms in the second excited energy level ( cm-2). This is compatible with the inferred H column densities and temperatures of the order of 1000 K expected in the neutral region.
We also calculated the total amount of gas that intercepts the line of sight for each point in the orbit near periastron passage, assuming it is close to conjunction, and derived a profile similar to that found phenomenologically by Corcoran et al. (2001a), but without the need of an increase in mass loss rate from Carinae.
We constructed the expected 2-10 keV light curves for several values of the eccentricity, phase of opposition, mass loss rates and wind velocities for Carinae and we were able to fit very well the shape and duration of the emission dip. We found that the mass loss rate is the only critical parameter that affects the shape of the X-ray light curve, since for high eccentricities angles lower than 30 degrees represent less than 1 day in the light curve timescale. The best fitting was obtained for M yr-1, which coincides with the value obtained by Pittard & Corcoran (2002) in their numerical simulations.
An interesting result of our model is that it explains the difference in the duration of the dip in the light curves at different wavelengths. At optical and UV wavelengths the dip is due to absorption by dust. Since dust growth rates are very sensitive to gas density, its formation rate, as well as the absorption it causes, will decrease very fast as the distance between the stars increases after periastron passage. X-rays, on the contrary, are absorbed by neutral gas, which will accumulate across the line of sight when the gas shell formed behind the shock expands away from the stars, and will remain there for a long time after grain formation had stopped.
In the scenario presented here, the material accumulated in the shell will expand into the orbital plane and form a thick disk, which can be seen at millimeter wavelengths through its free-free emission (Cox et al., 1995; Abraham & Damineli, 1999; Duncan & White, 2003). The dip in the millimeter light curves can be explained by a decrease in the number of available ionizing photons, which are absorbed by the neutral shell close to the binary orbit.
Finally we must mention that what we presented here is a very simplified version of a very complicated process and any refinement in the derived orbital and physical parameters of the binary system should be obtained from detailed numerical simulations.
Acknowledgments
The authors would like to thank the Brazilian agencies CNPq, FAPESP and FINEP for partial support.
References
- Abbott et. al. (1986) Abbott D., Bieging J., Churchwell E., Torres A., 1986, ApJ, 303, 239
- Abraham & Damineli (1999) Abraham Z., Damineli A., 1999, in ASP Conf. Ser. 179, Carinae at the Millenium, San Francisco, p263
- Abraham et al. (2003) Abraham Z., Dominici T. P., Damineli A., Leister N. V., Levenhagen R., 2003, IAC, 8162
- Andriese et al. (1978) Andriesse C., Donn B. & Viotti R., 1978, MNRAS, 185, 771
- Bohling et al. (1978) Bohling R. C., Savage B. D., Drake J. F, 1976, ApJ, 224, 132
- Chlebowski (1989) Chlebowski T., 1989, ApJ, 342, 1091
- Cohen (1995) Cohen M., 1995, ApJS, 100, 413
- Cohen & Vogel (1978) Cohen M., Vogel S., 1978, MNRAS, 185, 47
- Corcoran et al. (2001a) Corcoran M., Ishibashi K., Swank J., Petre R., 2001a, ApJ, 547, 1034
- Corcoran et al. (2001b) Corcoran M. F., Swank J. H., Petre R.,et al., 2001b, ApJ, 562, 1031
- Cox et al. (1995) Cox P., Mezger P. G., Sievers A. et. al., 1995, A&A, 297, 168
- Damineli (1996) Damineli A., 1996 ApJ, 460, L49
- Damineli et al. (1997) Damineli A., Conti P., Lopes D., 1997, NewA, 2, 107
- Damineli et al. (2000) Damineli, A., Kaufer, A., Wolf, B., Stahl, O., Lopes, D. & Araújo, F., 2000, ApJ, 528, 101
- Davidson et al. (1986) Davidson K., Dufour R., Walborn N. & Gull T., 1986, ApJ, 305, 867
- Davidson (1997) Davidson K., 1997, NewA, 2, 397
- Davidson et al. (1999) Davidson K. et al., 1999, AJ, 118, 1777
- Davidson et al. (2000) Davidson K., Ishibashi K., Gull T. et al., 2000, ApJ, 530, L107
- Draine & Lee (1984) Draine B., Lee M., 51984, ApJ, 285, 89
- Draine & Salpeter (1979) Draine B., Salpeter E., 1979, ApJ, 231, 77
- Duncan et al. ( 1997) Duncan R. A., White S. M., Lim J., 1997, MNRAS, 290, 680
- Duncan & White (2003) Duncan R. A., White S. M., 2003, MNRAS, 338, 425
- Feast et al. ( 2001) Feast M., Whitelock P. & Marang F.,2001, MNRAS, 322, 741
- Fitzpatrick (1999) Fitzpatrick E. L., 1999, PASP, 111, 63
- Gail et al. ( 1984) Gail H., Keller R., Sedlmayr E., 1984, A&A, 133, 320
- Gail & Sedlmayr (1987) Gail H., Sedlmayr E., 1987, A&A, 171, 197
- Gull et al. (2000) Gull T. R., Davidson K., Ishibshi, K., 2000, in Cosmic Explosions: Tenth Astrophysics Conference. AIP Conference Proceedings 522, p.439
- Hill et al. ( 2000) Hill G., Moffat A., St-Louis A., 2000, MNRAS, 318, 402
- Hill et al. ( 2002) Hill G., Moffat A., St-Louis A., 2002, MNRAS, 335, 1069
- Hillier et al. (2001) Hillier D., Davidson K., Ishibashi K., Gull T., 2001, ApJ, 553, 837
- Hony et al. (2001) Hony S., Dominik C., Waters L. et al., 2001, A&A, 377, L1
- Hoyle & Wickramasinghe (1991) Hoyle F., Wickramasinghe N., 1991, The theory of cosmic grains, Kluwer Acad. Publishers
- Ishibashi et al. (1999) Ishibashi K. Corcoran M., Davidson K., Swank J., Petre R., Drake S., Damineli A., White S., 1999, ApJ, 524, 983
- Kato et al. (2002) Kato T., Katsumi H., Yamaoka H., Takamizawa K., 2002, PASJ, 54, L51
- Kwok et al. (1997) Kwok S., Volk K., Bidelman, W.. 1997, ApJS, 112, 557
- Lamers (2001) Lamers H., 2001, PASP, 113, 263
- Lefevre ( 1979) Lefévre J., 1979, A&A, 72, 61
- Lépine et al. (2001) Lépine S., Wallace D., Shara M., Moffat A., Niemela, V., 2001, AJ, 122, 3407
- Mathews & Doane (1990) Mathews W., Doane J., 1990, ApJ, 352, 423
- Mathis et al. (1977) Mathis J. S., Rumpl W., Nordsieck K. H., 1977, ApJ, 217, 425
- Martin & Koppelman (2004) Martin J. C., Koppelman, M. D., 2004, AJ, 127, 2352
- Monnier et al. ( 2001) Monnier J., Tuthill P., Danchi, W., 2001, AAS, 199, 608
- Morris et al. (1999) Morris P., Waters L., Barlows M. et al., 1999, Nature, 402, 502
- Osterbrock (1974) Osterbrock D.. 1974, Astrophysics of gaseous nebulae, Freeman, San Francisco
- Pittard et al. (1998) Pittard J. M., Stevens I. R., Corcoran M. F., Ishibashi K., 1998, MNRAS, 299, L5
- Pittard & Corcoran (2002) Pittard J. M., Corcoran M. F. 2002, A&A, 383, 636
- Pitault et al. (1983) Pitault A., Epchtein N., Gomez A., Lortet M., 1983, A&A, 120, 53
- Pollock (1987) Pollock A., 1987, ApJ, 299, 265
- Prilutskii & Usov (1976) Prilutskii O., Usov V., 1976, Soviet Astron., 20, 2
- Robinson et al. ( 1973) Robinson G., Hyland A. R., Thomas J. A., 1973, MNRAS, 161, 281
- Robinson et al. (1987) Robinson, G., Mitchell, Aitken D. et al., 1987, MNRAS, 227, 535
- Savage & Sembach (1996) Savage B., Sembach K., 1996, ARA&A, 34, 279
- Seward et al. (2001) Seward F. D., Butt Y. M., Karovska M., Prestwich A., Schlegel E. M., 2001, ApJ, 553, 832
- Smith et al. (2003) Smith N., Davidson K., Gull T. R., Ishibashi K., Hillier D. J., 2003, ApJ, 586, 432
- Spitzer (1978) Spitzer L., 1978, Physical processes in the interstellar medium, New York, Wiley.
- Thaller et al. (2001) Thaller M., Gies D., Fullerton A., Kaper L., Wiemker R., 2001, ApJ, 554, 1070
- Usov (1992) Usov V., 1992, ApJ, 389, 635
- Williams, Kidger & van der Hucht (2001) Williams P., Kidger M., van der Hucht K., 2001, MNRAS, 324, 156
- Whitelock et al. (1994) Whitelock P. A., Feast M. W., Koen C., Roberts G., Carter, B. S., 1994, MNRAS, 270, 364
- Zanella et al. (1984) Zanella R., Wolf R., Stahl O., 1984, A&A, 137, 79
- Zhekov & Skinner (2000) Zhekov S., Skinner S., 2000, ApJ, 538, 808