VLBI imaging of OH absorption: The puzzle of the nuclear region of NGC 3079
Abstract
Broad hydroxyl (OH) absorption-lines in the 1667 MHz and 1665 MHz transition towards the central region of NGC 3079 have been observed at high resolution with the European VLBI Network (EVN). Velocity fields of two OH absorption components were resolved across the unresolved nuclear radio continuum of 10 parsecs. The velocity field of the OH absorption close to the systemic velocity shows rotation in nearly the same sense as the edge-on galactic-scale molecular disk probed by CO(1–0) emission. The velocity field of the blue-shifted OH absorption displays a gradient in almost the opposite direction. The blue-shifted velocity field represents a non-rotational component, which may trace an outflow from the nucleus, or material driven and shocked by the kiloparsec-scale superbubble. This OH absorption component traces a structure that does not support a counter-rotating disk suggested on the basis of the neutral hydrogen absorption.
keywords:
galaxies: active – galaxies:individual (NGC 3079): ISM – galaxies: Seyfert – radio lines: galaxies1 Introduction
NGC 3079 is an edge-on Sc galaxy housing a LINER (Low Ionisation
Narrow Emission Line Region) nucleus (Heckman, 1980) with a long
history of observations at various wavelengths. The nucleus is also
classified as a type 2 Seyfert nucleus (Ford et al., 1986). The galaxy has
a systemic velocity of 1116 km s(Irwin & Seaquist, 1991), which gives the
distance of 16 Mpc and hence 1 milliarcsec (mas) corresponds to
approximately 0.08 pc, adopting H0 = 75 km sMpc-1. Observations of optical emissions with the Hubble Space
Telescope (HST) have shown a number of outflowing filaments in a
’superbubble’, produced by a combination of stellar winds and
supernova explosions in a site of massive star formation. X-ray
observations with Chandra show a clear correspondence of
H-line filaments with those in X-rays at the distance of 65 pc from the nucleus (Cecil et al., 2002). Throughout several X-ray
observations, a highly obscured active galactic nucleus (AGN) and iron
line emission towards the nucleus were found (Cecil et al., 2002). The
center of the galaxy has been resolved by radio interferometry and
reveals a double radio lobe extending 1.5 kpc on either side of the
major axis of the galaxy and a puzzling nuclear structure on parsec
scales (Irwin & Seaquist, 1988). Due to the complexity of the radio structure,
the interpretation of the location of a true nucleus is not
straightforward.
Broad (200–400 km s-1) and deep (
0.5) neutral hydrogen HI absorption and weaker but equally
broad and deep OH absorption are found towards those compact radio
sources in the nucleus. These absorptions have been studied in detail
at various angular resolutions by radio interferometers.
Based on the Very Large Array (VLA) observations at 1 arcsec resolution,
Baan & Irwin (1995) considered that the two components of HI and OH absorptions are
associated with an obscuring torus in the nuclear
region. Multi-Element Radio Linked Interferometer Network (MERLIN)
observations at sub-arcsecond resolution resolved the rotation of the
HI absorption (Pedlar et al., 1996) in the same sense as the rotational
trend traced by HI emission and CO(1–0) emission on galactic scales
(Irwin & Seaquist, 1991; Irwin & Sofue, 1992). According to Very Long Baseline Interferometry
(VLBI) observations at an angular resolution of 10-15 mas, three
HI absorption components viewed against the resolved double-peaked
radio source appear to be evidence for counter rotation relative to
the rotation in the outer galaxy (Sawada-Satoh et al., 2000).
The strong and highly intensity-variable water maser emission is known
to exist in NGC 3079 (Henkel et al., 1984; Haschick & Baan, 1985). Earlier attempts for
resolving the maser emission have been made since the late 1980s using
VLBI (Haschick et al., 1990). At present, it is understood that the H2O maser
components are distributed within an elongated (disk-like) structure
within a few parsecs from the nucleus (Trotter et al., 1998). Most of the
maser components detected with VLBI lie in a velocity range V(LSR refers Local Standard of Rest.) = 956–1190 km sand are not
associated with any of the jet components (Trotter et al., 1998; Sawada-Satoh et al., 2000). They
are distributed nearly north-to-south, and are aligned roughly with
the molecular disk traced by CO(1–0) (Position Angle (P.A.) =
15) with a radius of 750 pc (Irwin & Sofue, 1992). Several new weak
components were recently detected, which extend the velocity range to
about V= 1350 km s(Hagiwara et al., 2002a). Given the velocity
distribution of all the maser features observed to date, the maser
spectrum shows a rough symmetry w.r.t the systemic velocity of the
galaxy (V 1116 km s-1) (Hagiwara et al., 2002b). It has been
argued that there is a rotating parsec-scale molecular gas disk or
torus obscuring an AGN in NGC 3079, but no concrete evidence has been
presented in the literature like the one in NGC 4258
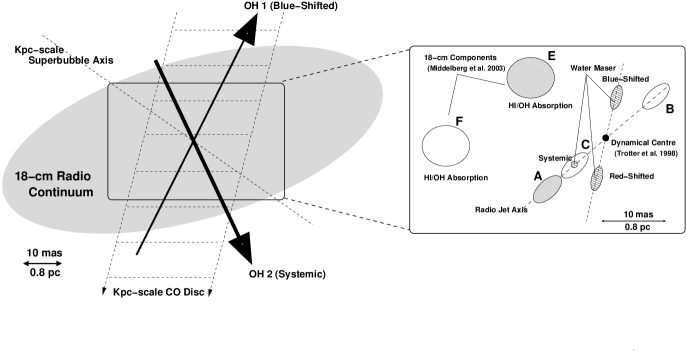
(Herrnstein et al., 1998). A recent study by Middelberg et al. (2003) presents evidence for
five distinct radio continuum sources in the nucleus of NGC 3079,
complicating the interpretation of its puzzling structure. Besides the
three components A, B, and C that are detected at higher frequencies
and are seen at 22 GHz together with the H2O masers, there are two
other components E and F that are visible only at lower frequencies,
following the convention used in Irwin & Seaquist (1988). These additional
components have the same orientation and are equally spaced as the 22
GHz components A and B, but they are shifted about 25 mas 2
pc to the east; they form the 18-cm radio signature that is observed
in HI and OH absorption experiments.
In this paper, we present
VLBI observations of OH absorption at the nuclear region of
NGC 3079. With observations using European VLBI Network (EVN) at the
highest spectral-line sensitivity of any existing VLBI facility, we
aim to review the kinematics of the circumnuclear region in the
galaxy.
| RA (J2000) | 10h01m57.8050s |
|---|---|
| Decl (J2000) | 5540’47.080” |
| Systemic Velocity (21-cm HI) | 1116 1 km s-1 |
| Distance | 16 Mpc |
| Inclination (optical) | 84 |
| Optical class | LINER/Seyfert 2 |
| Fν (1.4 GHz) | 5.7 1.7 mJy |
| (8.4 GHz) | 14.2 0.7 mJy |
| (15 GHz) | 24.4 0.6 mJy |
| (22 GHz) | 12.1 0.7 mJy |
| LIR | 3 1010 erg s-1 |
| LX-ray(0.1-6.5keV) | 1.0 1042 erg s-1 |
| L | 3.3 1041 erg s-1 |
2 Observations
The central region of NGC 3079 was observed at 18-cm on 2000 November 15 with
the EVN, which consisted of eight telescopes: Cambridge, Effelsberg,
Jodrell Bank (Lovell), Medicina, Noto, Onsala, Torun, and the Westerbork
phased-array. We observed the 1667 and 1665 MHz main line transitions of the
, J=3/2 ground-state of OH in absorption toward the central
radio continuum source in NGC 3079.
NGC 3079 was observed in a phase-referencing mode over a period of
5.7 hrs, interspersed with observations of a phase calibrator source
J 0957+5522, which is located about 1 degree from the target
source. The total time of one observing cycle was 13 minutes with 10
minutes for NGC 3079 and 3 minutes for J 0957+5522. The total time
spent on the target was about 3 hours. The data were recorded in both
left and right circular polarizations using a single intermediate
frequency (IF) band with 8 MHz bandwidth. The IF baseband was
subdivided into 128 spectral points, yielding a frequency resolution
of 62.5 kHz, or 11.2 km sin velocity at the source distance. The IF
velocity coverage is 1440.5 km s-1. In order to cover both the main
line transitions, we centered the IF on V= 1350 km sand the
Doppler velocity center was referenced to the 1667 MHz
line. Hereafter, all velocities are in the radio convention and with
respect to LSR. The system temperature and antenna sensitivity for
each EVN antenna over the observing frequency range from 30 K 100
K during the observing run. DA 193 was measured in the middle of the
observations for calibrating the absolute amplitude gain and the
bandpass correction. The data-recording rate was 128 Mbit per second
with a MkIV terminal.
The correlation of the data was performed at the EVN MkIV correlator at the Joint Institute for VLBI in Europe (JIVE). Data analysis was made using the NRAO AIPS package. After the delay and delay rate calibration using J 0957+5522, the bandpass corrections were applied. We discarded the data from six baselines, Noto(NT)-Medicina(Mc), Mc-Torun(Tr), Tr-NT, Cambridge(Cm)-Tr, Cm-NT, and Cm-Mc baseline, due to inadequate data quality. The continuum visibility data set was generated from the spectral-line visibility data set by averaging absorption-free channels using the AIPS task of UVLIN. The continuum visibility data set was then used for self-calibration to improve the image sensitivity. After iterations of the self-calibration in both phase and amplitude, the solutions were transferred to the spectral-line visibility data. The continuum and spectral-line visibilities were imaged employing IMAGR.
3 Results
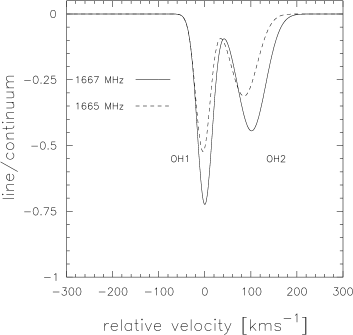
Fig. 1 () shows the EVN spectrum of OH absorption integrated
over the nuclear radio continuum source (Fig. 4) with natural weighting
with a spectral resolution of 11.2 km s-1. The systemic velocity of the
galaxy V= 1116 km sand the peak velocities of HI absorption and
water maser emission are denoted. The rms noise level is 0.7 mJy beam-1 per
channel. The OH main-line transitions of 1667 MHz and 1665 MHz are
clearly detected against an unresolved continuum source at the centre
of NGC 3079. Both transitions have two distinct components, one of
which is blue-shifted (OH1) and the other is nearly centred on the
systemic velocity (OH2). This is consistent with the spectra at lower
resolutions (Baan & Irwin, 1995). By comparison with the single-dish
spectrum, the OH absorption lines observed in these observations have
lost their broad wings. The integrated intensities of the 1667 MHz OH
absorption estimated from the single-dish and the EVN spectrum in
Fig. 1 () are about 8.3 Jy km s(Baan & Irwin, 1995) and 0.74 Jy
km s-1, respectively. Only 8.9 percent of the absorption intensity was
recovered in the EVN observations. This accounts for the narrower
line-widths of the OH absorption spectra obtained with the EVN (Table
2). The OH emissions in the wing of the absorption at V= 910 and
around V= 1260 km ssuggested by Baan & Irwin (1995) coincide with weak
emission features seen in our EVN spectrum, although both of them need
to be confirmed in further observations. Two Gaussian components have
been fitted to the absorption profiles of each of the transition
(Fig. 1 ); the results are listed in Table 2. The resultant
opacity and column density are listed in Table 3 together with those
of the previous VLA and VLBI observations obtained at different
angular scales. The OH absorption velocity center (Gaussian-fitted) is
V(OH1)= 1011.9 0.9 km sand V(OH2)= 1113.5 2.0
km s-1, while the centre velocities derived from the VLA-A data are
V= 1013 km sand V= 1114 km s(Baan & Irwin, 1995). These values
are consistent within the spectral resolution of one channel. The HI
absorptions are peaked at V= 1010 km s-1, 1120 km s-1, and 1265
km s(Baan & Irwin, 1995), where the red-shifted third component has no OH
counterpart. The ratios of the double peaks in both transitions are
quite consistent, which may imply that both main-line features are
associated with the same continuum source. The line ratio 1667 to 1665
MHz in the Gaussian-fitted profiles is 1.5, which is lower than the
Local Thermodynamic Equilibrium (LTE) value of 1.8.
Velocity-integrated maps of the 1667 MHz OH absorption integrated over
11.2 km sintervals and the CLEAN map of a 18-cm radio continuum
source are shown in Fig. 2 (All are uniformly weighted.). Fifteen
velocity channel maps cover the velocity range of the absorption from
990.4 km sto 1147.7 km s-1.
The continuum emission was not resolved in
this experiment. The peak flux density of the continuum map produced
with uniform weighting is 8.8 mJy beam-1 and the rms noise level is 0.25
mJy beam-1. The peak flux density and the noise level of the continuum map
produced with natural weighting are 11.8 mJy beam-1 and 0.085 mJy beam-1,
respectively. The integrated flux density of the continuum is 14.3
0.7 mJy, while the 21-cm integrated flux density obtained by
single-dish measurements is 760 31 mJy (Condon, 1983). Hence,
more than 95 percent of the continuum flux is missing in this EVN
experiment. Because the limited angular resolution of our EVN
observations compared with the past VLBI observations at higher
frequencies, the nuclear continuum remains unresolved without showing
any structure. The EVN synthesized beam is larger than the angular
separation between the various nuclear components (Fig. 7), which
limits the discussion on the possible associations of the OH absorbing
gas with individual sources in later sections.
A position-velocity (PV) diagram of the 1667 MHz absorption is
presented in Fig. 3. A cut was made through the continuum emission at
P.A. = 15 (rotated clockwise by 15 degrees), which aligns a cut
along a major axis of the rotation traced by CO(1–0)
(Sofue & Irwin, 1992; Koda et al., 2002) and which was also used from the PV diagrams in
Baan & Irwin (1995). The gradients in the 1665 MHz line show the same trend
as those seen in the 1667 MHz line. Note that there are significant
position offsets of 7-8 mas in declination between the two peaks
of OH1 (blue-shifted) and OH2 (systemic), which could not be measured
in the PV diagrams of Baan & Irwin (1995) at 1 arcsec resolution with the
VLA-A. The velocity contours of OH1 and OH2 are separate, as compared with the PV diagrams in Fig. 7 in Baan & Irwin (1995).
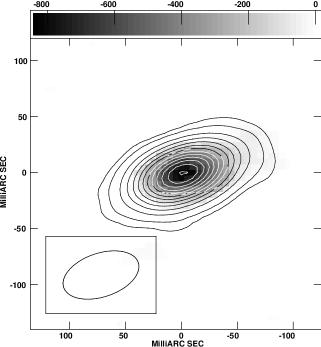
Fig. 4 shows a naturally weighted 18-cm continuum map superposed on
the integrated 1667 MHz OH intensity (0th moment) map. The absorption
is apparently concentrated towards the centre with a weak outward
extension. This is similar to the east-west
elongation of the HI and OH absorbing gas seen at 1 arcsec resolution
and caused by the orientation and separation ( 25 mas or
2 pc) of the L-band components E and F (Irwin & Seaquist, 1988; Baan & Irwin, 1995; Middelberg et al., 2003).
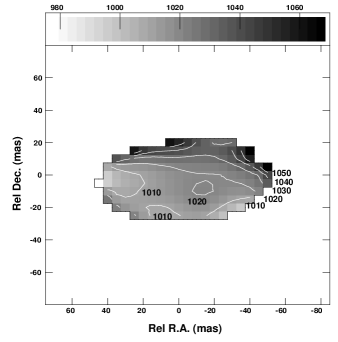
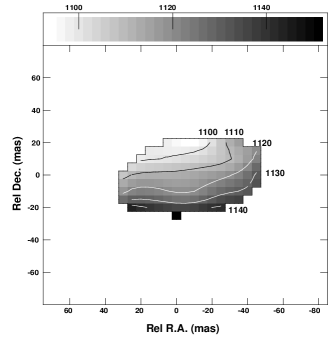
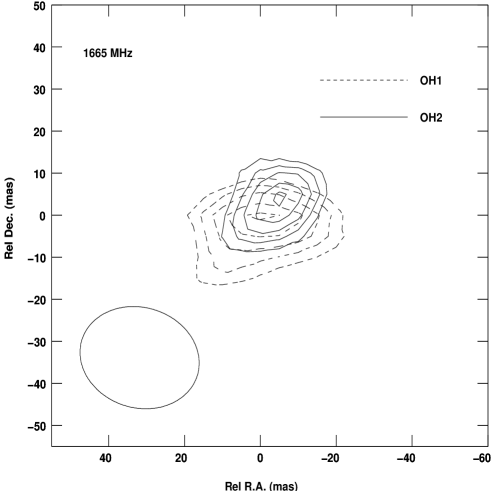
Fig. 5 displays the OH velocity field of the two components (1st
moment). The velocity field of OH1 varies from southwest to northwest
in P.A.= 60, while that of OH2 is seen approximately from north
to south in P.A.= 145. The velocity gradients of OH1 and OH2
are 10 km spc-1 and 13 km spc-1,
respectively. The kpc-scale CO(1–0) velocity gradient is found to be
also in the north-to-south direction and has a value of 0.85 km spc-1 and a P.A.= 15 (Sofue & Irwin, 1992). The compact nuclear
CO(1–0) core at PA= 4, tilted by about 10 w.r.t the kpc-scale
CO(1–0) disk, within central 125 pc shows a rigid rotation with a
velocity of 300 km s(Sofue et al., 2001; Koda et al., 2002). This yields the
velocity gradient of 2.4 km spc-1. Just as Baan & Irwin (1995) also
Sawada-Satoh et al. (2000) have interpreted the equivalent HI components to
originate against the two continuum components A and B, which in
reality were components E and F (Middelberg et al., 2003). The velocity
differences estimated from the CO velocity gradients between the two
continuum components F (A) and E (B), separated by 25 mas or 2 pc, are
only 1.7 km sor 4.8 km s-1. Such values are not
consistent with the observed velocity difference of 101.6 km sbetween
OH1 and OH2, which would suggest that the two detected OH absorptions
arise from neither the kpc-scale CO disk nor the nuclear CO
core. MERLIN observations at 400 mas resolution resolved the
rotational motion of the HI absorbing gas (Pedlar et al., 1996), which
matches the sense of the rotation traced by the HI emission
(Irwin & Seaquist, 1991). The directions of the HI velocity fields in the three
HI VLBI absorption components have not been presented in
Sawada-Satoh et al. (2000), which prevents a comparison with the OH velocity
fields in Fig. 5.
Comparisons of the intensity distribution of OH1 and OH2 for each
transition are presented in Fig. 6. The intensity maps were produced from the
uniformly weighted spectral-line cubes. We find that there is a difference in
the spatial distribution in both 1667 MHz and 1665 MHz absorption, which is
even more distinct in the 1665 MHz line. The distribution of the blue-shifted
OH1 is downward w.r.t that of the systemic OH2 by approximately 8 mas, or 0.6
pc in declination. This trend is also true in the PV diagram of Fig. 3, where
the difference is clearly seen for both main-lines.


4 Discussion
4.1 The puzzle of the nuclear radio continuum
NGC 3079 is known to exhibit a complex radio structure in the nuclear region.
Recent VLBI studies reveal a multiple milli-arcsec-scale nuclear
source structure with five frequency dependent components (Middelberg et al., 2003). The
continuum components A, B and C are only present in maps at 22 GHz but are
totally obscured at L-band. The identification of a true nucleus in the galaxy
has been a subject to debate. If the H2O maser structure is indeed confirmed
to be a disk with a rotation axis misaligned by 15–20 with respect to the kpc-scale CO(1–0) disk at P.A.= 30, then the nucleus would lie close to the A-C-B line (Fig. 7). Trotter et al. (1998) proposed that the dynamical center lies
between components A and B, more specifically at the intersection of the jet
axis and a north-south distribution of the H2O masers. The north-south
distribution of the H2O maser was more convincingly confirmed in Kondratko (2003)
by measuring the positions of the new red-shifted H2O maser features reported
in Hagiwara et al. (2002a). An H2O disk centered close to C and having a systemic
velocity of 1120 km swould be consistent with the H2O components at 1123 km sat C, the systemic velocity of the HI absorption of 1116 km s, and the
systemic OH component (OH2) at 1114 km s-1. The models based on the velocity signature of the
OH and HI absorption (Baan & Irwin, 1995) and of the HI VLBI signature (Sawada-Satoh et al., 2000) refer to components E and F and do not reflect the location
of the nucleus. Various monitoring programs have been executed to detect a
velocity drift of the systemic components as seen in NGC 4258, but they have
failed to find any drifting component to confirm the disk signature (e.g. Baan & Haschick 1996; Hagiwara et al. 2002a).
Considering the available evidence, the true nucleus is hidden at L-band and
lies close to C on the line connecting components C and B. The nature of the L-band components E and F is not yet certain. These components could be
circum-nuclear starburst regions but for that E has too high a brightness
temperature and could be a supernova remnant.
4.2 The nature of the OH absorption
An important result of our EVN observations is the interpretation of the two different velocity fields traced by the two OH absorption components on scales of 10 mas towards the unresolved radio continuum nucleus. The spectrum in Fig. 1 shows that most of the OH absorption has been resolved out in our data set, as compared with single-dish and VLA spectra in Baan & Irwin (1995). This implies that we observe compact gas that extends no more than the beam size of 45 mas, or 4 pc, which is almost equal to the size of the background continuum. The OH absorbing gas has been interpreted primarily to be a part of circum-nuclear gas traced by the CO(1–0) emission (Baan & Irwin, 1995). A single black body fit based on the measurement of far-infrared (FIR) flux densities at 12 – 100 in NGC 3079 gives a temperature of 43 K and the maximum extent of this large-scale FIR source (e.g. torus) of about 130 pc. Our EVN data do not provide compelling evidence for such a large-scale torus.
4.2.1 The absorbing gas structure
The nucleus of NGC 3079 hosts a LINER or a type 2 Seyfert
nucleus. Therefore, the nucleus could be obscured by an edge-on dusty
torus or intervening medium along the line of sight. Because of the
systematic similarity of the HI and OH absorptions, Baan & Irwin (1995)
suggested a possible association of the two HI and OH absorbing gas
components with the double continuum source (Fig. 7). With a 1.0
arcsec (corresponding to 80 pc) resolution of the VLA in A
Configuration, the data in Baan & Irwin (1995) were insufficient to extract
precise connections between these absorption components and the
nuclear radio continuum structure.
Interpretation of the VLBI data in Sawada-Satoh et al. (2000) shows that the three
HI components are resolved and that the column densities of each
component against F (blue-shifted HI), F+E (systemic HI), and E
(red-shifted HI) are almost the same, suggesting that E and F are
uniformly obscured by the ISM foreground to the nuclear sources. Our
EVN data failed to resolve E from F, so that we cannot identify the
individual contributions for OH absorption and the OH column
densities for each component with those of HI. Baan & Irwin (1995)
introduced a rotating disk model, in which the torus is confined in
the roughly north-south orientation with an inclination about
–20 w.r.t the CO(1–0) disk standing at P.A.= 15. In this
discussion, the jet axis connecting the nuclear radio sources of E and F
makes an angle of about 45 with the confining torus. The sense
of the rotation of the torus proposed in Baan & Irwin (1995) is consistent
with that of the CO disk/core and the edge-on H2O maser disk proposed
in Trotter et al. (1998) and Kondratko (2003). Sawada-Satoh et al. (2000) proposed a
counter-rotating disk at P.A. = 30 in order to explain the
spatially resolved HI absorption. However, the directions and
position angles of the torus and the CO and H2O maser disks are completely
inconsistent with those of the torus model in Sawada-Satoh et al. (2000) and the
evidence for this counter-rotation is weak.
On the other hand, a counter-rotating structure reversed to the kiloparsec-scale CO(1–0) disk has been observed in OH absorption in a type 2 Seyfert galaxy NGC 5793 (Hagiwara et al., 2000). Similarly, two nuclear disks with radii 100 pc embedded in the outer kpc-scale gas disk have been clearly resolved in CO(2–1) in the merging nuclei of the ultra-luminous infrared galaxy Arp 220 (IC 4553). The rotational sense between these two disks is reversed due to the counter rotation of the two nuclei themselves (Sakamoto et al., 1999).
4.2.2 Interpretations of the double OH peaks
The OH absorption in the EVN spectrum shows double peaks with a separation of
101.6 km sin velocity (Table 2). Baan & Irwin (1995) considered the association of
OH1 and OH2 with the radio twin peaks E and F (Fig. 7) with an OH velocity
gradient between the two components along the jet axis of approximately 50 cos
km spc-1. The projected separation of the twin radio peaks E and F
is 25 mas or 2 pc and the projected angle () lies between the
radio axis E–F and the plane of the OH gas motion. The value of the gradient
would be 10 times larger than that of the CO(1–0) kpc-scale disk and the
CO(1–0) nuclear core rotating in the north-south direction, unless cos
is unrealistically small. Consequently, it is not plausible to correlate the
OH velocity difference between E and F and the internal
velocity gradients of the CO(1–0) disk/core, although the direction of the OH
velocity gradients agrees with that of the larger-scale CO(1–0) disk.
This velocity gradient would also be about 10 times larger than those seen in
the merging galaxy Arp 220 (Mundell, Ferruit & Pedlar, 2001) and the Seyfert galaxies Mrk 231
and Mrk 273 (Klöckner, Baan, & Garrett, 2003; Klöckner & Baan, 2003), where HI absorption or OH maser emission
reveal a rotating molecular torus with an inner radius of several tens of
parsecs from the central engine.
Considering the available evidence, the double peaks must arise from two
kinematically independent systems in the nuclear region. The direction of the
velocity gradient of the systemic OH2 is in good agreement with that of the CO
and H2O maser disks. In addition, the velocity range of OH2 nearly coincides
with the systemic velocity of NGC 3079. We know that the HI absorption at the
systemic velocity is seen against the whole nuclear continuum at 21-cm
(Sawada-Satoh et al., 2000). This can be accounted for by clumpy gas in a kiloparsec-scale
disk. Accordingly, the systemic OH2 probes gaseous components in the CO disk,
and particularly the inner disk on scales of 10-100 pc.
On the other hand, the velocity field of the blue-shifted OH1 is very different
from that of OH2 and of the CO disk. Baan & Irwin (1995) argued that a foreground
and an expanding shell driven by the nuclear superbubble could explain the
large blue-shift of the OH1 centroid velocity, while a receding shell may
account for the other weak red-shifted OH absorption component around V=
1260 km s-1, as observed with VLA. In the starburst galaxy M 82, distinct
outflow components of molecular gas were discovered that extend over 500 pc
above the plane of the disk and lie along the minor axis of the galaxy (e.g.
Nakai et al. 1987).
It is uncertain whether or not the outflows traced by OH1 are
associated with the (possible) starburst-related components E and F themselves because the velocity gradient of OH1 does not align with this E–F axis (Fig. 7). It should be noted
that the velocity range of OH1 (V= 956–1050 km s-1) overlaps with
that of several blue-shifted H2O features peaking at velocities V= 1012, 1018, 1034, and 1035 km s(Trotter et al., 1998). Although these
features have a velocity signature similar to that of the OH1
absorption component, there is no evidence for a physical
association. Some of the H2O maser components outside the
edge-on masering disk of the Circinus galaxy are interpreted as molecular
outflow components, ejected from the edge-on structure (Greenhill et al., 2003).
The two OH emission features identified at V= 910 km sand 1230 km sin
Baan & Irwin (1995) and detected weakly in our data may be accounted for by the
blue-shifted 1667 MHz and 1665 MHz OH features that lie at velocities just
below the OH1 outflow components. They may arise in the shocked molecular
components foreground to the outflow structure. In the above picture, an
association with molecular outflows can explain the blue-shifted OH1, the weak
OH emission, and also possibly the H2O maser components. However, this last association cannot be quantified due to difficulties in comparing the distribution of weak H2O masers and the OH absorption on very different angular scales.
5 Conclusions and Summary
The broad OH absorption towards the nuclear continuum source in NGC 3079 was imaged using VLBI techniques. The EVN observations reveal two kinematically independent OH absorption components, where OH1 is the blue-shifted absorption, and OH2 is the absorption at the systemic velocity of the galaxy. The understanding of the kinematics of these components is limited by the fact that the 18-cm background continuum and the OH components have not been spatially resolved.
1. The OH2 component shows a distinct velocity gradient in roughly north-to-south direction viewed against the unresolved nuclear continuum at 18-cm consisting of components E and F. This velocity gradient of the systemic OH2 is consistent with that of the clumpy gas component in the kpc-scale CO disk (P.A.= 15).
2. The blue-shifted component OH1 appears to be associated with molecular outflows and is possibly associated with the nuclear super-bubble due to circum-nuclear starburst activity at components E and F and possibly at other locations. The velocity gradient of the OH1 component is not yet understood butis almost reversed from that of the systemic component OH2. The weak OH emission features marginally detected in our EVN observation may also be associated with shocked gas in these nuclear outflows.
3. The H2O masers in the galaxy have been attributed to a compact disk structure around the true nucleus located west of the radio continuum component C. The OH1 velocity range is similar to that of the blue-shifted H2O maser components and there may be some relation.
The combined knowledge of our OH data, of previous VLBI data on the radio continuum, of H2O masers, and of the HI absorption on scales of 100 pc down to sub-parsec scales, provides a clear and consistent interpretation of the various spectral components seen at the nucleus. VLBI observations at even higher angular resolution and high sensitivity could resolve the nature of the OH and HI components in relation to H2O maser components in the nuclear region of NGC 3079.
Acknowledgments
This research has made use of the NASA/IPAC Extragalactic Database (NED), which is operated by the Jet Propulsion Laboratory, California Institute of Technology, under contract with the National Aeronautics and Space Administration. The European VLBI Network is a joint facility of European, Chinese, South African and other radio astronomy institutes funded by their national research councils. We thank the anonymous referee for useful comments.
References
- Baan (1989) Baan W.A., 1989, ApJ, 338, 804
- Baan & Irwin (1995) Baan W.A., Irwin J.A., 1995, ApJ, 446, 602
- Baan & Haschick (1996) Baan W.A., Haschick A., 1996, ApJ, 473, 269
- Braatz, Wilson & Henkel (1996) Braatz J.A., Wilson A.S., Henkel C., 1996, ApJS, 106, 51
- Cecil et al. (2001) Cecil G., Bland-Hawthorn J., Veilleux S., Filippenko A.V., 2001, ApJ, 555, 338
- Cecil et al. (2002) Cecil G., Bland-Hawthorn J., Veilleux S., 2002, ApJ, 576, 745
- Condon (1983) Condon J.J., 1983, ApJS, 53,459
- Ford et al. (1986) Ford H.C., Dahari O., Jacoby G.H., Crane P.C., Ciardullo R., 1986, ApJ, 311, L7
- Greenhill et al. (2003) Greenhill L.J., Booth R.S., Ellingsen S.P., et al., 2003, ApJ, 590, 162
- Hagiwara et al. (2000) Hagiwara Y., Diamond P.J., Nakai N., Kawabe, R., 2000, A&A, 360, 49
- Hagiwara et al. (2002a) Hagiwara Y., Henkel C., Sherwood W.A., Baan W.A., 2002a, A&A, 387, 29L
- Hagiwara et al. (2002b) Hagiwara Y., Henkel C., Sherwood W.A., 2002b, in Migenes V., Reid M.J., eds, IAU Symp. 206, Cosmic Masers: From Protostars to Black Holes, p.392
- Haschick & Baan (1985) Haschick A.D., Baan W.A., 1985, Nature, 314, 14
- Haschick et al. (1990) Haschick A.D., Baan W.A., Schneps M.H., Reid M.J., Moran J.M., Güsten R., 1990, ApJ, 356, 149
- Heckman (1980) Heckman T.M., 1980, A&A, 87, 152
- Henkel et al. (1984) Henkel C., Güsten R., Downes D., Thum C., Wilson T.L., Biermann P., 1984, A&A, 141, L1
- Herrnstein et al. (1998) Herrnstein J.R., Greenhill L.J., Moran J.M., Diamond P.J., Inoue M., Nakai N., Miyoshi M., 1998, ApJ, 497, L69
- Irwin & Seaquist (1988) Irwin J.A., Seaquist E.R., 1988, ApJ, 335, 658
- Irwin & Seaquist (1991) Irwin J.A., Seaquist E.R., 1991, ApJ, 371, 111
- Irwin & Sofue (1992) Irwin J.A., Sofue Y., 1992, ApJ, 396, L75
- Klöckner, Baan, & Garrett (2003) Klöckner H-R, Baan W.A., Garrett M.A., 2003, Nature, 421, 821
- Klöckner & Baan (2003) Klöckner H-R, Baan W.A., 2004, A&A, in press
- Koda et al. (2002) Koda J., Sofue Y., Kohno K., Nakanishi H., Onodera S., Okumura S.K., Irwin J.A., 2002, ApJ, 573, 105
- Kondratko (2003) Kondratko P. T., 2003, research exam paper, Harvard University
- Middelberg et al. (2003) Middelberg E., Kurichbaum T.P., Roy A.L., Witzel A., Zensus J.A., 2003, in Romney J.D., Reid M.J., eds, Proc. Future Directions in High Resolution Astronomy: A Celebration of the 10th Anniversary of the VLB. Astron. Soc. Pac., San Francisco, in press
- Mundell, Ferruit & Pedlar (2001) Mundell C.G., Ferruit P., Pedlar A., 2001, ApJ, 560, 168
- Nakai et al. (1987) Nakai N., Hayashi M., Handa T., Sofue Y., Hasegawa T., Sasaki M., 1987, PASJ, 39, 685
- Pedlar et al. (1996) Pedlar A., Mundell C.G., Gallimore J.F., Baum S.A., O’Dea C.P., 1996, Vistas Astron., 40, 91
- Sakamoto et al. (1999) Sakamoto K., Scoville N.Z., Yun M.S., Crosas M., Genzel R., Tacconi L.J., 1999, ApJ, 514, 68
- Sawada-Satoh et al. (2000) Sawada-Satoh S., Inoue M., Shibata K.M., Kameno S., Migenes V., Nakai N, Diamond P.J., 2000, PASJ, 52, 421
- Sawada-Satoh et al. (2001) Sawada-Satoh S., Inoue M., Shibata K.M., Kameno S., Nakai N., Migenes V., Diamond P.J., 2001, in Schilizzi R.T., Vogel S.N., Paresce F., Elvis M.S., eds, Proc. IAU Symp. 205, Galaxies and their Constituents at the Highest Angular Resolutions, p.196
- Sofue & Irwin (1992) Sofue Y., Irwin J.A., 1992, PASJ, 44, 353
- Sofue et al. (2001) Sofue Y., Koda J., Kohno K., Okumura S.K., Honma M., Kawamura A., Irwin J.A., 2001, ApJ, 547, L115
- Trotter et al. (1998) Trotter A.S., Greenhill L.J., Moran J.M., Reid M.J., Irwin J.A., Lo K.-Y. 1998, ApJ, 495, 740
| VLA | EVN (This paper) | |||||
| Vc | Sp | V | Vc | Sp | V | |
| (km s-1) | (mJy beam-1) | (km s-1) | (km s-1) | (mJy beam-1) | (km s-1) | |
| OH ABSORPTION | ||||||
| OH1 (1667 MHz) | 1013 | 22 | 84 | 1011.9 0.9 | 8.5 0.4 | 38.7 2.2 |
| (1665 MHz) | 1354 | 15 | - | 1361.6 1.3 | 6.1 0.4 | 37.2 3.1 |
| OH2 (1667 MHz) | 1114 | 27 | 92 | 1113.5 2.0 | 5.2 0.3 | 72.1 5.0 |
| (1665 MHz) | 1462 | 18 | - | 1450.7 2.9 | 3.6 0.3 | 67.8 7.3 |
| OH EMISSION | ||||||
| (1667 MHz) | 910 | 4.7 | 61 | (900) | (0.5) | - |
| (1665 MHz) | 1260 | 1.7 | - | (1235) | (0.5) | - |
| EVN | Global-VLBI | VLA (A Configuration) | ||||
|---|---|---|---|---|---|---|
| OH1 (Blue-shift) | OH2 (Systemic) | OH1 | OH2 | OH1 | OH2 | |
| Optical depth () | 0.46 0.03 | 0.31 0.02 | 0.73 0.17 | 0.79 0.13 | 1.03 | 1.28 |
| N (K -1 cm-2) | 4.3 1015 | 5.3 1015 | 9.2 1016 | 1.8 1017 | 2.2 1016 | 2.5 1016 |