Chandra and FUSE spectroscopy of the hot bare stellar core H 1504$+$65††thanks: Based on observations made with the NASA-CNES-CSA Far Ultraviolet Spectroscopic Explorer. FUSE is operated for NASA by the Johns Hopkins University under NASA contract NAS5-32985.
H 1504$+$65 is an extremely hot hydrogen-deficient white dwarf with an effective temperature close to 200 000 K. We present new FUV and soft X-ray spectra obtained with FUSE and Chandra, which confirm that H 1504$+$65 has an atmosphere primarily composed of carbon and oxygen. The Chandra LETG spectrum (60 – 160Å) shows a wealth of photospheric absorption lines from highly ionized oxygen, neon, and – for the first time identified in this star – magnesium and suggests relatively high Ne and Mg abundances. This corroborates an earlier suggestion that H 1504$+$65 represents a naked C/O stellar core or even the C/O envelope of an O-Ne-Mg white dwarf.
Key Words.:
stars: abundances – stars: atmospheres – stars: evolution – stars: AGB and post-AGB – stars: white dwarfs – stars: individual: H 1504$+$65| element | ion | NLTE levels | lines | |
|---|---|---|---|---|
| He | I | 1 | 0 | |
| II | 10 | 36 | ||
| III | 1 | – | ||
| C | III | 6 | 4 | |
| IV | 36 | 98 | ||
| V | 1 | 0 | ||
| O | IV | 1 | 0 | |
| V | 20 | 24 | ||
| VI | 52 | 231 | ||
| VII | 1 | 0 | ||
| Ne | IV | 1 | 0 | |
| V | 5 | 0 | ||
| VI | 23 | 56 | ||
| VII | 54 | 250 | ||
| VIII | 5 | 6 | ||
| IX | 1 | 0 | ||
| Mg | IV | 1 | 0 | |
| V | 10 | 7 | ||
| VI | 48 | 161 | ||
| VII | 39 | 86 | ||
| VIII | 23 | 56 | ||
| IX | 1 | 0 | ||
| Al | IV | 1 | 0 | |
| V | 7 | 4 | ||
| VI | 20 | 19 | ||
| VII | 41 | 31 | ||
| VIII | 35 | 16 | ||
| IX | 1 | 0 | ||
| Na | IV | 1 | 0 | |
| V | 41 | 142 | ||
| VI | 43 | 130 | ||
| VII | 43 | 164 | ||
| VIII | 11 | 13 | ||
| IX | 1 | 0 | ||
| Fe | VI | 7 | 25 | (340 132) |
| VII | 7 | 24 | (86 504) | |
| VIII | 7 | 27 | (8 724) | |
| IX | 7 | 25 | (36 843) | |
| X | 7 | 28 | (45 229) | |
| XI | 1 | 0 | ||
| Ni | VI | 7 | 27 | (1 110 584) |
| VII | 7 | 18 | (688 355) | |
| VIII | 7 | 27 | (553 549) | |
| IX | 7 | 24 | (79 227) | |
| X | 1 | 0 | ||
| generic | VI | 7 | 28 | (1 755 957) |
| (Ca-Ni) | VII | 7 | 28 | (1 244 159) |
| VIII | 7 | 28 | (819 983) | |
| IX | 8 | 36 | (844 432) | |
| X | 1 | 0 |
1 Introduction
H 1504$+$65 is a faint blue star that has been identified as the counterpart of a bright soft X-ray source (Nousek et al. 1986) discovered by an early X-ray survey (Nugent et al. 1983). Spectroscopically, the star is a member of the PG1159 class which comprises hot hydrogen-deficient (pre-) white dwarf stars (=75 000 K–180 000 K, =5.5–8 [cgs]; Werner 2001). The PG1159 stars are probably the outcome of a late helium-shell flash, a phenomenon that drives the currently observed fast evolutionary rates of three well-known objects (FG Sge, Sakurai’s object, V605 Aql). A late helium-shell flash may occur in a post-AGB star or a white dwarf. Flash induced envelope mixing generates a H-deficient surface layer. The surface chemistry then essentially reflects that of the region between the H-and He-burning shells of the precursor AGB star. The He-shell flash transforms the star back to an AGB star and the subsequent, second post-AGB evolution explains the existence of Wolf-Rayet central stars of planetary nebulae and their successors, the PG1159 stars.
Within the PG1159 group H 1504$+$65 is an extraordinary object, as it has been shown that it is not only hydrogen-deficient but also helium-deficient. From optical spectra it was concluded that the atmosphere is primarily composed of carbon and oxygen, by equal amounts (Werner 1991, W91). Strong neon lines were detected in soft X-ray spectra taken with the EUVE satellite and in an optical-UV Keck spectrum and an abundance of Ne=2–5% (all abundances in this paper are given as mass fractions) was derived (Werner & Wolff 1999, WW99). The origin of this exotic surface chemistry is unclear.
Here we present new results of observations performed with FUSE (Far Ultraviolet Spectroscopic Explorer) and the Chandra X-ray Observatory, whose spectroscopic resolution is more than an order of magnitude better than that of previous FUV and EUV missions (HUT and EUVE). We will show that the Chandra spectrum contains a wealth of photospheric absorption lines from highly ionized metals. Ionization balances of O, Ne, and Mg lines provide new constraints on the effective temperature and, for the first time, allow an estimation of the Mg abundance. We also analyze the spectra with respect to other metals, namely Al, Na, and the iron group.
In the following sections we will first describe the model atmosphere calculations. Then we will present in detail the compilation of atomic data and design of the model atoms. After a coarse characterization of the FUSE and Chandra spectra we turn to the detailed comparison between synthetic and observed spectra. Finally we discuss the results and their implications on the evolutionary history of H 1504$+$65.

2 Model atmosphere calculations
Line blanketed NLTE model atmospheres were computed using our PRO2 code (Werner et al. 2003a). The models are in hydrostatic and radiative equilibrium. The atomic models account for the most abundant elements in H 1504$+$65, carbon, oxygen and neon. Helium is also included in order to be able to derive an upper limit for the He abundance from the He ii Balmer lines in the FUSE spectra. It is important to include Stark broadened profiles for the strongest spectral lines (from C iv, O vi and Ne vii) even at this stage of calculations, because they do affect the atmospheric structure by blanketing and cooling effects (Werner 1996).
Model atmospheres with numerous parameter sets for , , and He/C/O/Ne element mixtures were computed to find the best fitting model for H 1504$+$65. Based on these model structures (keeping them fixed), we performed NLTE line formation iterations for additional chemical elements (Mg, Al, Na, Fe, and Ni) in order to guide our search for lines of these species in the observed spectra. Test calculations have shown that neglecting the back-reaction of these species onto the atmospheric structure and the emergent spectrum is unimportant for our analysis, except for the iron group elements, which can affect the overall flux distribution when included into the models self-consistently. Hence, we have also computed exploratory models accounting for all elements with Z=20–28 (Ca, Sc, Ti, V, Cr, Mn, Fe, Co, Ni), using a generic model atom comprising these species. Table 1 summarizes all model atoms employed. For the final spectrum synthesis fine structure splitting of atomic levels of light metals must be considered; level populations were taken from the models with appropriate statistical weights. For some multiplets of neon and magnesium, treatment of the fine structure splitting is not entirely possible because excitation energies are not known for all sublevels. As a consequence, uncertainties of the order 0.1Å in line positions within a multiplet remain.
In the following section we describe in detail the design of our model atoms used for the spectral analysis. This is necessary and useful because our Chandra spectrum of H 1504$+$65 represents the first high-resolution spectral observation of a purely photospheric stellar spectrum in the soft X-ray region. Consequently, the majority of the detected absorption lines were never observed before in any astrophysical object.
| /Å | Ion | Transition | ||
|---|---|---|---|---|
| 948.09, 948.21 | C IV | 3s – | 4p | |
| 970.55 | O VI | 5s – | 8p | * |
| 973.33 | Ne VII | 2p1Po – | 2p2 1D | |
| 986.35 | O VI | 4s – | 5p | |
| 1018.11, 1018.25 | O VI | 5p – | 8d | * |
| 1031.28 | C IV | 4s – | 9p | : |
| 1031.91 | O VI | 2s – | 2p(3/2) | |
| 1036.67 | O VI | 5p – | 8s | * |
| 1037.08, 1037.17 | O VI | 5d – | 8f | * |
| 1037.61 | O VI | 2s – | 2p(1/2) | |
| 1038.18, 1038.32 | O VI | 5f – | 8d | * |
| 1038.40, 1038.42 | O VI | 5f – | 8g | * |
| 1038.46, 1038.49 | O VI | 5g – | 8h | * |
| 1038.56, 1038.58 | O VI | 5g – | 8f | * |
| 1043.05, 1043.14 | O VI | 5d – | 8p | * |
| 1080.88, 1081.63 | O VI | 4p – | 5d | |
| 1097.32, 1097.34 | C IV | 4s – | 8p | : |
| 1107.59, 1107.98 | C IV | 3p – | 4d | |
| 1118.25, 1118.41 | C IV | 4p – | 9s | : |
| 1122.35, 1122.62 | O VI | 4d – | 5f | |
| 1124.72, 1124.83 | O VI | 4f – | 5g | |
| 1126.35, 1126.47 | O VI | 4f – | 5d | * |
| 1146.79, 1147.07 | O VI | 4d – | 5p | |
| 1168.86, 1169.01 | C IV | 3d – | 4f | |
| 1171.56, 1172.44 | O VI | 4p – | 5s | |
| 1184.59, 1184.78 | C IV | 4p – | 8d | : |
| /Å | Transition | ||
|---|---|---|---|
| O V | – | ||
| 114.36 | 2s 1S – | 8p 1Po | - |
| 116.16 | 2s 1S – | 7p 1Po | - |
| 119.10 | 2s 1S – | 6p 1Po | - |
| 124.62 | 2s 1S – | 5p 1Po | - |
| O VI | – | ||
| 93.07 | 2s – | 10 | : |
| 93.91 | 2s – | 9p | : |
| 95.08 | 2s – | 8p | |
| 96.84 | 2s – | 7p | |
| 99.60, 99.66 | 2p – | 17 | |
| 99.69 | 2s – | 6p | |
| 99.78, 99.83 | 2p – | 16 | |
| 99.99, 100.00 | 2p – | 15 | |
| 100.25, 100.31 | 2p – | 14 | |
| 100.58, 100.63 | 2p – | 13 | |
| 100.99, 101.04 | 2p – | 12 | |
| 101.51, 101.57 | 2p – | 11 | |
| 102.24, 102.30 | 2p – | 10 | |
| 103.21, 103.26 | 2p – | 9d | |
| 103.34, 103.40 | 2p – | 9s | |
| 104.61, 104.67 | 2p – | 8d | |
| 104.80, 104.86 | 2p – | 8s | |
| 104.81 | 2s – | 5p | |
| 106.73, 106.79 | 2p – | 7d | |
| 107.02, 107.08 | 2p – | 7s | |
| 110.15, 110.22 | 2p – | 6d | |
| 110.66, 110.72 | 2p – | 6s | |
| 115.82, 115.83 | 2s – | 4p | |
| 116.35, 116.42 | 2p – | 5d | |
| 117.33, 117.40 | 2p – | 5s | |
| 129.78, 129.87 | 2p – | 4d | |
| 132.22, 132.31 | 2p – | 4s | |
| 150.09, 150.12 | 2s – | 3p | |
| /Å | Transition | ||
|---|---|---|---|
| Ne vi | |||
| 111.10, .16, .26 | 2p 2Po – | 3p 2D | |
| 114.07, .13, .24, .30 | 2p 2Po – | 3p 2P | |
| 120.21, .24, .27, .31, .35, .40, .45 | 2p2 4P – | 3d 4Po | |
| 121.05, .06, .10, .11, .13, .15, .19, .21 | 2p2 4P – | 3d 4Do | |
| 122.49, .69 | 2p 2Po – | 3d 2D | |
| 133.47, .48, .51, .51 | 2p2 2D – | 3d 2Do | |
| 136.22, .28, .34, .36, .37, .45, .48 | 2p2 4P – | 3s 4Po | |
| 138.39, .64 | 2p 2Po – | 3s 2S | |
| Ne vii | |||
| 67.88 | 2s2 1S – | 4d 1Po | |
| 69.40 | 2s2 1S – | 4s 1Po | |
| 74.78, .81, .87 | 2p 3Po – | 4p 3D | |
| 75.76 | 2s2 1S – | 4p 1Po | : |
| 81.37 | 2p 1Po – | 4p 1P | |
| 82.16 | 2s2 1S – | 3d 1Po | |
| 82.17, .20, .27 | 2p 3Po – | 4d 3D | |
| 84.19, .23, .30 | 2p 3Po – | 4s 3S | |
| 85.12, .15, .22 | 2p2 3P – | 4d 3Do | |
| 85.19, .22, .30 | 2p2 3P – | 4d 3Po | |
| 86.47 | 2p2 1D – | 4d 1Po | : |
| 86.82 | 2p2 1D – | 4d 1Fo | |
| 87.46 | 2s2 1S – | 3s 1Po | |
| 87.85 | 2p2 1D – | 4d 1Do | |
| 89.02 | 2p2 1D – | 4s 1Po | |
| 89.37 | 2p 1Po – | 4d 1D | |
| 91.56 | 2p 1Po – | 4s 1S | : |
| 92.85 | 2p2 1S – | 4d 1Po | |
| 94.26, .27, .30, .31, .36, .39 | 2p 3Po – | 3p 3P | |
| 94.80, .84, .93 | 2p 3Po – | 3p 3S | |
| 95.65 | 2p2 1S – | 4s 1Po | |
| 95.75, .81, .89, .90, .91, 96.00 | 2p 3Po – | 3p 3D | |
| 97.50 | 2s2 1S – | 3p 1Po | |
| 103.09 | 2p 1Po – | 3p 1D | |
| 106.03, .08, .19 | 2p 3Po – | 3d 3D | |
| 107.10 | 2p 1Po – | 3p 1P | |
| 108.17 | 2p2 1S – | 4p 1Po | : |
| 109.75, .78, .82, .87, .92, .98 | 2p2 3P – | 3d 3Po | |
| 110.53, .56, .59, .63, .67, .70 | 2p2 3P – | 3d 3Do | |
| 111.15 | 2p2 1D – | 3d 1Po | |
| 111.81 | 2p2 1D – | 3d 1Fo | |
| 115.33, .39, .52 | 2p 3Po – | 3s 3S | |
| 115.96 | 2p2 1D – | 3d 1Do | |
| 116.69 | 2p 1Po – | 3d 1D | |
| 120.20, .27, .33, .35, .42, .48 | 2p2 3P – | 3s 3Po | |
| 121.13 | 2p2 1D – | 3s 1Po | |
| 121.77 | 2p2 1S – | 3d 1Po | |
| 127.67 | 2p 1Po – | 3s 1S | : |
| 133.64 | 2p2 1S – | 3s 1Po | |
| 135.29, .33, .38, .40, .50, .54 | 2p2 3P – | 3p 3Po | |
| 141.22 | 2p2 1D – | 3p 1Po | : |
| Ne viii | |||
| 88.08, .12 | 2s 2S – | 3p 2Po | |
| 98.11, .26 | 2p 2Po – | 3d 2D | |
| 102.91, 103.08 | 2p 2Po – | 3s 2S | |
| /Å | Transition | ||
|---|---|---|---|
| Mg v | – | ||
| 137.40, .41, .42, .74, .75, .88 | 2p4 3P – | 3s’ 3Do | : |
| Mg vi | |||
| 83.56 | 2p3 4So – | 4s 4P | Mg vii bl |
| 87.40, .41 | 2p3 2Do – | 4s 2P | : |
| 89.64, .65 | 2p3 2Po – | 4s 2P | : |
| 93.52 | 2p3 2Do – | 3d” 2D | : |
| 95.38, .42, .48 | 2p3 4So – | 3d 4P | Mg vii bl |
| 96.08, .09 | 2p3 2Po – | 3d” 2D | |
| 96.26, .30 | 2p3 2Do – | 3d’ 2P | |
| 97.25, .28 | 2p3 2Do – | 3d’ 2F | |
| 98.50, .51 | 2p3 2Po – | 3d’ 2S | |
| 98.98, .99, 99.02, .04 | 2p3 2Po – | 3d’ 2P | |
| 100.70, .90 | 2p3 2Do – | 3d 2F | |
| 101.49, .55 | 2p3 2Do – | 3d 2P | O vi bl |
| 104.52, .53, .59, .60 | 2p3 2Po – | 3d 2P | O vi bl |
| 111.17, .19 | 2p3 2Po – | 3s” 2S | Ne vii bl |
| 111.55, 75, .86 | 2p3 4So – | 3s 4P | : |
| 113.19 | 2p3 2Do – | 3s’ 2D | |
| 116.97, 117.22 | 2p3 2Do – | 3s 2P | |
| 116.97, .99 | 2p3 2Po – | 3s’ 2D | |
| 117.55 | 2p4 2D – | 3sv 2Po | |
| 121.01, .03, .29, .30 | 2p3 2Po – | 3s 2P | Ne vii bl |
| 123.59 | 2p4 2D – | 3siv 2Do : | |
| 130.31, .64 | 2p4 2P – | 3sv 2Po | |
| 137.81, 138.17 | 2p4 2P – | 3siv 2Do : | |
| /Å | Transition | ||
|---|---|---|---|
| Mg vii | |||
| 78.34, .41, .52 | 2p3 3P – | 3p 3Po | |
| 80.95, 81.02, .14 | 2p3 3P – | 3p 3So | : |
| 82.94, 82.97, 83.01 | 2p3 5So – | 3d 5P | |
| 83.51, .56, .59, .64, .71, .76 | 2p3 3P – | 3d 3Po | |
| 83.91, .96, .99, 84.02, .09, .11 | 2p3 3P – | 3d 3Do | |
| 85.34 | 2p2 1D – | 3d 1Po | : |
| 85.41 | 2p2 1D – | 3d 1Fo | |
| 87.72 | 2p2 1D – | 3d 1Do | |
| 87.89 | 2p2 1D – | 3d 3Fo | intercomb. |
| 88.68 | 2p2 1S – | 3d 1Po | |
| 94.04, .17, .24 | 2p3 5So – | 3s 5P | Mg viii bl |
| 95.03, .04 | 2p3 3Do – | 3s’ 3D | |
| 95.26, .38, .42, .49, .56, .65 | 2p3 3P – | 3s 3Po | |
| 98.03 | 2p2 1D – | 3s 1Po | |
| 98.98 | 2p3 3Po – | 3s’ 3D | |
| 101.96, .97, 102.14, .23 | 2p3 3Do – | 3s 3P | |
| 102.47 | 2p2 1S – | 3s 1Po | |
| 105.17 | 2p3 1Do – | 3s’ 1D | |
| 106.52, .71, .81 | 2p3 3Po – | 3s 3P | O vi bl |
| 110.11 | 2p3 1Po – | 3s’ 1D | O vi bl |
| 111.98, 112.00, .11, .12, .27 | 2p3 3Do – | 3p 3P | |
| 117.43, .66, .78 | 2p3 3So – | 3s 3P | |
| 117.52, .64, .81 | 2p3 3Po – | 3p 3P | |
| 130.94, 131.09, .30 | 2p3 3So – | 3p 3P | : |
| Mg viii | |||
| 69.41, .47, .57 | 2p 2Po – | 3p 2D | |
| 74.27, .32, .34, .37, .41, .43 | 2p2 4P – | 3d 4Do | |
| 74.86, 75.03, .04 | 2p 2Po – | 3d 2D | |
| 80.23, .25 | 2p2 2D – | 3d 2Do | |
| 81.73, .79, .84, .87, .94, .98 | 2p2 4P – | 3s 4Po | |
| 82.60, .82 | 2p 2Po – | 3s 2S | |
| 86.24, .36, .38 | 2p2 2P – | 3d 2Do | |
| 86.84, .85, 87.02 | 2p2 2D – | 3s 2Po | : |
| 92.13, .32 | 2p2 2S – | 3s 2Po | : |
| 93.89, 94.07, .10, .27 | 2p 2P – | 3s 2Po | : |
| 98.13, .15 | 2p3 4So – | 3p 4P | Ne viii bl |
| 102.13, .21 | 2p2 2S – | 3p 2Po | : |
| 105.97, .98, 106.0 | 2p3 2Do – | 3p 2P | Ne vii bl |
| 106.81, .83 | 2p3 2Po – | 3p 2S | O vi bl |
| 108.93, 109.18, .20 | 2p3 2Po – | 3p 2D | |
| 114.90, .91, .93, .94 | 2p 2Do – | 3d 2D | : |

3 Atomic data
We have performed a detailed search for reliable atomic data in a number of atomic data sources. These are the following databases:
(i) Kurucz (1991) level and line lists111http://cfa-www.harvard.edu/amdata/ampdata/kurucz23/sekur.html,
(ii) Opacity Project (OP, Seaton et al. 1994) TOPbase222http://legacy.gsfc.nasa.gov/topbase/home.html,
(iii) National Institute of Standards and Technology (NIST)333http://physics.nist.gov/,
(iv) Chianti database (Young et al. 2003)444http://wwwsolar.nrl.navy.mil/chianti.html,
(v) Kelly Atomic Line Database555http://cfa-www.harvard.edu/amdata/ampdata/kelly/kelly.html,
(vi) University of Kentucky Atomic Line List666http://www.pa.uky.edu/∼peter/atomic/,
as well as the monograph of Bashkin & Stoner (1975). The Kurucz and OP databases are our basic sources for atomic data of heavy and light metals, respectively. Bashkin & Stoner is an important source for accurate level energies and line positions for light metals. Important additional data in this respect were found in the NIST and Chianti databases.
For the light metals (C-Na) the most serious problem in many cases is the lack of accurate line positions for highly ionized species, often making individual line identifications difficult or impossible. The same problem is faced with Ca and the iron group elements: Their combined opacity is important for the overall flux distribution, but identifying these species by means of individual lines is hardly possible. However, it turns out that the cumbersome work for a critical data compilation can yield satisfying results. A large number of multiplets from Ne and Mg can be identified in the Chandra data.
Line broadening is a critical issue and introduces considerable uncertainties for detailed line-profile fits. Linear Stark broadening is assumed for ions with one valence electron (He ii, C iv, O vi) and treated in an approximate way, while quadratic Stark broadening is assumed for all other ions (for details see Werner et al. 1991).
Another problem is posed by the requirement of good photoionization (b-f) cross-sections for metals. The strengths of absorption edges within the Chandra spectral range and the adjacent EUV/FUV region affects the spectral energy distribution. We have investigated this problem, as well as the effect of pressure ionization on the absorption edges, in detail before and refer to our earlier EUVE analysis of H 1504$+$65 (WW99). What is a new problem, that becomes important with the superior Chandra spectral resolution, is the occurrence of autoionization resonances in the b-f cross-sections. Some of these resonances are strong and narrow, mimicking absorption lines in the spectra (Fig. 1). Although these resonances are included in the OP data, their wavelength position is too uncertain for a unique identification in the observations. As a consequence, hitherto unidentified lines in the Chandra spectrum may be due to b-f resonances of metals and, vice versa, absorption features in the synthetic spectra without an observed counterpart could be due to such resonances in the models. For this reason we have substituted the OP b-f data by hydrogen-like cross-sections in the detailed final spectral fits shown in this paper. This does change the continuum flux slightly, but in view of the difficulties we encounter with fitting the overall flux distribution (see below), this is considered unimportant. Generally, strong resonances are fortunately not very frequent and can be identified in the models on a case-by-case basis.
Let us now present the design of our model atoms. A good orientation concerning the ionization degree of different species is provided by Fig. 2. Besides the temperature and electron density stratification of a model with =175 000 K it shows the ionization fractions of all considered chemical species. We will discuss the changes in ionization balance with in Sect. 5.
3.1 Helium, carbon, and oxygen
Because of the high temperatures in the atmosphere of H 1504$+$65, helium is strongly ionized so that a one-level He i model atom is sufficient.
For C and O, the helium-like noble-gas configurations (C v, O vii) represent the highest ionization stages in the model atoms. They are also the dominant ionization stages in our model atmospheres (see Fig. 2). Test calculations based upon extended model atoms including H-like ions C vi, O viii showed that this is sufficient. The population of the latter ions becomes significant only in the outermost and innermost layers of the hottest models calculated (=250 000 K). This neither changes the observed C iv and O vi line profiles nor the flux distribution in the wavelength bands studied here. Also, the population of excited levels in C v and O vii is very weak, which explains why no subordinate lines from these ions are detected in the observed data (the respective resonance lines are located blueward of the recorded Chandra spectrum).
The UV/optical spectrum of H 1504$+$65 is dominated by C iv and O vi lines (but note that no C iv lines are located in the Chandra spectral range). Available level energies often yield line positions that do not coincide with line positions from laboratory measurements. This is frequently the case for O vi lines, but also sometimes for C iv lines. When an exact line position could be taken from the databases, we shifted the synthetic line to that position, but uncertainties remain for many lines, particularly in the FUV range. Similar problems occur with many O v lines in the Chandra range, preventing their identification, which is unfortunate because these lines would be sensitive indicators. In all cases we restricted detailed profile analyses to lines with accurately known wavelengths. Tables 2 and 3 list the identified C and O lines.
3.2 Neon, magnesium, aluminum, and sodium
Besides O vi lines, lines from Ne vii are the strongest absorption features in the Chandra spectrum of H 1504$+$65. This ion also has a strong optical line at 3644Å, which we detected in a Keck spectrum (WW99), and in the present paper we announce the detection of the Ne vii 973.3Å absorption line 2p1Po–2p2 1D; to our knowledge it is the first time ever seen in an astrophysical spectrum. There is some uncertainty in the literature concerning the accurate wavelength position of this line. The first measurement was published by Johnston & Kunze (1971) who give 973.6Å. Lang (1983) quotes 973.33Å (without reference) and this value is also found in the Chianti database. According to Kramida (NIST, priv. comm.) the best measurement for this line was done by Lindeberg (1972). The measured wavelength is 973.3020.005Å. For our synthetic spectra we have adopted 973.33Å. We also model the line spectrum of Ne vi and Ne viii and successfully identify these ions in the Chandra data (see below). Table 4 gives a complete list of all lines considered in the spectrum synthesis calculations. As already mentioned, fine structure splitting of multiplets is problematic in those cases, in which knowledge of energy levels within one term is incomplete. This can cause uncertainties in wavelength positions of individual lines within a multiplet of the order 0.1Å. We have omitted all lines involving energy levels uncertain to an extent that the corresponding wavelength uncertainty is much larger than 0.1–0.2Å. As a consequence, many unidentified lines in the Chandra spectrum probably stem from such Ne lines.
After first test calculations with a small magnesium model atom we found that some lines of these species might be present in the Chandra data. However, because the Mg lines are much weaker than O and Ne lines, we have designed a very detailed model atom for Mg in order to look for as many lines of this species as possible. After a critical data compilation and the rejection of many lines because of wavelength uncertainties there is no doubt that we can identify many lines of Mg v-viii. As in the case of Ne, many unidentified Chandra spectral lines certainly stem from Mg lines with uncertain wavelength positions. It is interesting to note that we predict an observable intercombination line, which indeed is identified in the Chandra data (Table 5).
In the very same way we tried to identify Al and Na lines in the Chandra spectrum. Although large model atoms were constructed, we cannot detect these species beyond doubt. Details of this search will be described below.
3.3 Calcium and iron group elements
Synthetic spectra including lines from Ca and Fe group elements were calculated using a superlevel/superline approach which is described, e.g., in Rauch & Deetjen (2003). All line data were taken from Kurucz’s line lists, except for Fe x, which were taken from the Opacity Project’s TOPbase. Ni x lines exist neither in those two datasets nor in the NIST database and, hence, could not be considered here. Kurucz’s data compilation consists of two sets. The first one includes only lines with accurate wavelengths determined from laboratory experiments (“POS” data). The second list additionally includes predicted lines with uncertain wavelengths (“LIN” data). Our strategy is that we perform model and line formation iterations using the full (LIN) line list, because precise wavelength positions are unimportant at this stage of calculations, but accounting for the complete line opacities is important. The final synthetic spectra that are compared with observations, however, are computed using the POS data only, in order to facilitate line identifications. We shall see that strong blanketing by the large number of LIN lines makes the identification of individual POS lines of iron and nickel virtually impossible. The OP Fe x lines are treated like Kurucz’s LIN lines, because their positions are uncertain, too.
4 Overview of FUSE and Chandra Observations
H 1504$+$65 was observed by FUSE on four separate occasions, with a total integration time of 67 ksec. The FUSE instrument consists of four coaligned telescopes, each with a prime-focus spectrograph. The observation log is given in Table 6; all data were obtained in time-tag mode and processed with CALFUSE v2.4. The LWRS spectrograph apertures were used for all observations, hence the zero-point of the wavelength scale is uncertain to within about Å. All exposures were photometric, or nearly so, in all channels. Descriptions of the FUSE instrument, and channel alignment and wavelength calibration issues are given by Moos et al. (2000) and Sahnow et al. (2000). The wavelength scales for spectra from the individual exposures were coaligned separately for each channel by means of narrow interstellar absorption lines. Spectra from channels other than LiF1 were then given an additional zero-point offset so that lines (which are present in all channels) had a common heliocentric velocity. The spectra from all the channels were then resampled onto a common wavelength scale with 0.025Å pixels, and combined. The resulting spectrum covers 912 - 1187Å with a typical spectral resolution of 0.08–0.10Å.
| Prog ID | Date | (ksec) |
|---|---|---|
| Q1090202 | 2000-02-19 | 11.3 |
| S6010202 | 2002-01-28 | 32.7 |
| M1052601 | 2003-01-13 | 13.9 |
| M1052602 | 2003-05-06 | 8.9 |
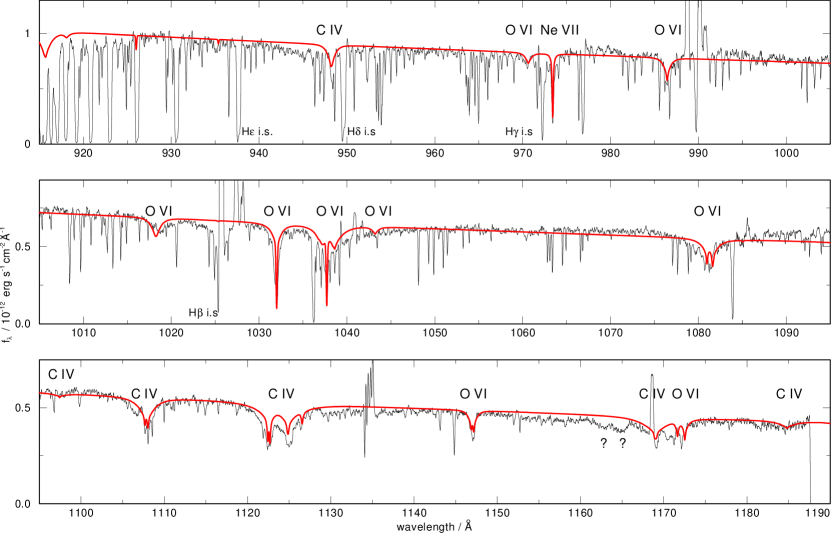
The spectrum is characterized by a few broad photospheric lines of C IV and O VI and many narrow interstellar lines, predominantly from H2 (see Fig. 3). The identified photospheric lines are listed in Table 2. All other absorption features are of interstellar origin, except for two broad and shallow features at 1163Å and 1165Å (marked by “?” in Fig. 3), which we think are of photospheric origin, but cannot be identified. They are also seen, even more prominently, in other very hot PG1159 stars, the central stars K1-16 and RX J2117+3412. There are S viii lines listed at these wavelengths, however, this identification is regarded as unlikely, because of the high level energies and because other lines from this ion should be detectable, too, which is not the case. The model spectra shown here are shifted by +0.09Å in order to fit the bulk of the observed lines.
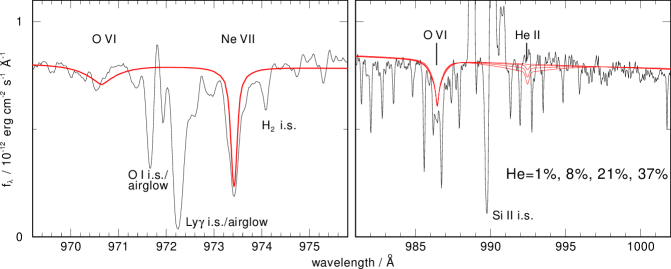
Two interesting details are shown in Fig. 4. The left panel focuses on the region around a rather strong absorption line, which stems from Ne vii. As already mentioned this is the first detection of this line in a stellar spectrum. It is also seen in FUSE spectra of other PG1159 stars (e.g. in the prototype PG1159-035 itself). The overplotted model, which fits the observed line very well, has a Ne abundance of 2%, in agreement with the results from the Chandra spectrum analysis described below. The right panel of Fig. 4 is centered around the location of a He ii line. He ii absorption is not detectable and a comparison with models shows that H 1504$+$65 is strongly helium-deficient. This corroborates the result of an optical spectral analysis (He1%), which was based on the lack of a He II 4686Å emission line (W91). From Fig. 4 we derive a (less tight) upper limit for the He abundance, namely He5%.
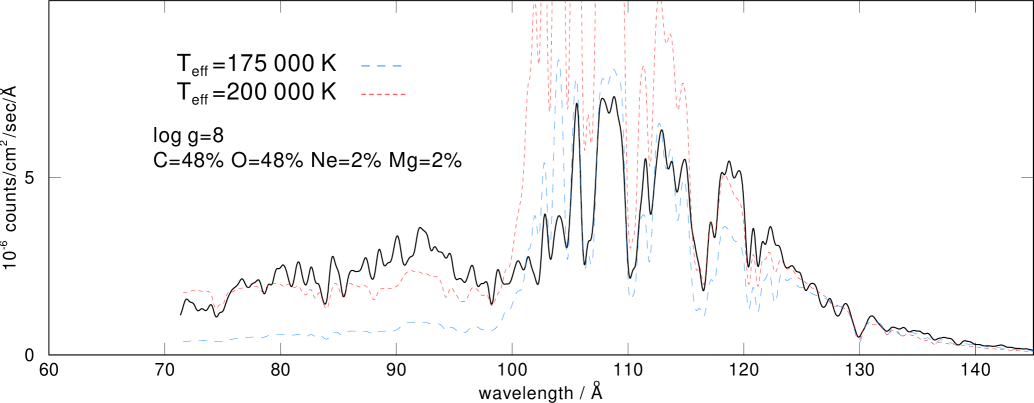
H 1504$+$65 was observed with Chandra on Sep. 27, 2000, with an integration time of 7 hours. Flux was detected in the range 60Å–160Å and the spectral resolution is about 0.1Å. Fig. 5 shows the overall spectrum. It is characterized by a roll-off at long wavelengths due to ISM absorption. The maximum flux is detected near 110Å. Between 105Å and 100Å the flux drops because of photospheric absorption from the O vi edge caused by the first excited atomic level. The edge is not sharp because of a converging line series and pressure ionization (see WW99 for detailed model spectra). Below 100Å the flux decreases, representing the Wien tail of the photospheric flux distribution. Fig. 5 demonstrates that our models cannot fit the entire wavelength range at a unique temperature, however, from the overall flux shape can be constrained between 175 000 K and 200 000 K.
We have looked for possible explanations for the inability of our models to fit the overall X-ray flux distribution. We must look for processes which decrease the flux level at Å and/or increase the flux level at shorter wavelengths. Line blanketing by heavy metals (introduced below) does not solve the problem. Including the large number of absorption lines blocks flux at Å, but this flux re-emerges in the same wavelength region just in between spectral windows of strong line blanketing, hence, a flux increase at Å cannot be enforced by including this opacity source. From this result we feel that we must look for a missing continuous opacity.
One possibility was that our carbon model atom needed to be extended to higher ionization stages. Excited levels of C v (2s and 2p) potentially cause absorption edges between 130–150Å. This could decrease the flux for Å and at the same time, because of total flux constancy, could increase the flux Å. However, a test calculation has shown that this does not solve the problem. Even in a model with =250 000 K, in which C v is the dominant ionization stage of carbon in most parts of the atmosphere, only weak C v edges appear, decreasing the maximum model flux near 110Å by less than 10%. By analogy, excited O vii levels can cause absorption edges. But their strength is expected to be even less important, because the ionization potential of O vi is higher than that of C iv.
We also tried to vary other model parameters to overcome this problem. Increasing the surface gravity from = 8 to = 9 causes a flux decrease of about 50% in the 100–130Å range. The additional opacity is caused by Ne vii and O vi line wings which become very strongly pressure broadened. In addition, increased pressure ionization of O vi causes a shift of the strong ionization edges towards lower wavelengths. But again, the result is not a flux increase at Å, but a higher flux at Å. A similar result was obtained from an exercise, where we increased the (uncertain) line broadening parameters even by very large amounts. The oxygen abundance is also not a critical parameter. Tests show that the strength of the O vi absorption edge near 100Å is insensitive to variations of the O abundance within reasonable limits. Even a reduction of the O abundance by a factor of 10 decreases the continuum flux jump at the absorption edge from 95% only to 80%. In the same direction, we artificially decreased the b-f cross-section of the O vi levels by factors larger than we expect from the uncertainty in the atomic data for this relatively simple one-electron ion. Switching between OP cross-sections and hydrogen-like cross-sections has only a weak effect on the model flux.
To summarize these tests, the only way to significantly increase the short wavelength flux is to increase the effective temperature to roughly 200 000 K. An unknown opacity source must be responsible for suppressing the excess model flux at longer wavelengths. A detailed analysis of the Chandra line spectrum can be used to further constrain the effective temperature by using ionization balances of several species. We will now show that this supports the =200 000 K estimate.
5 Analysis of the X-ray absorption line spectrum
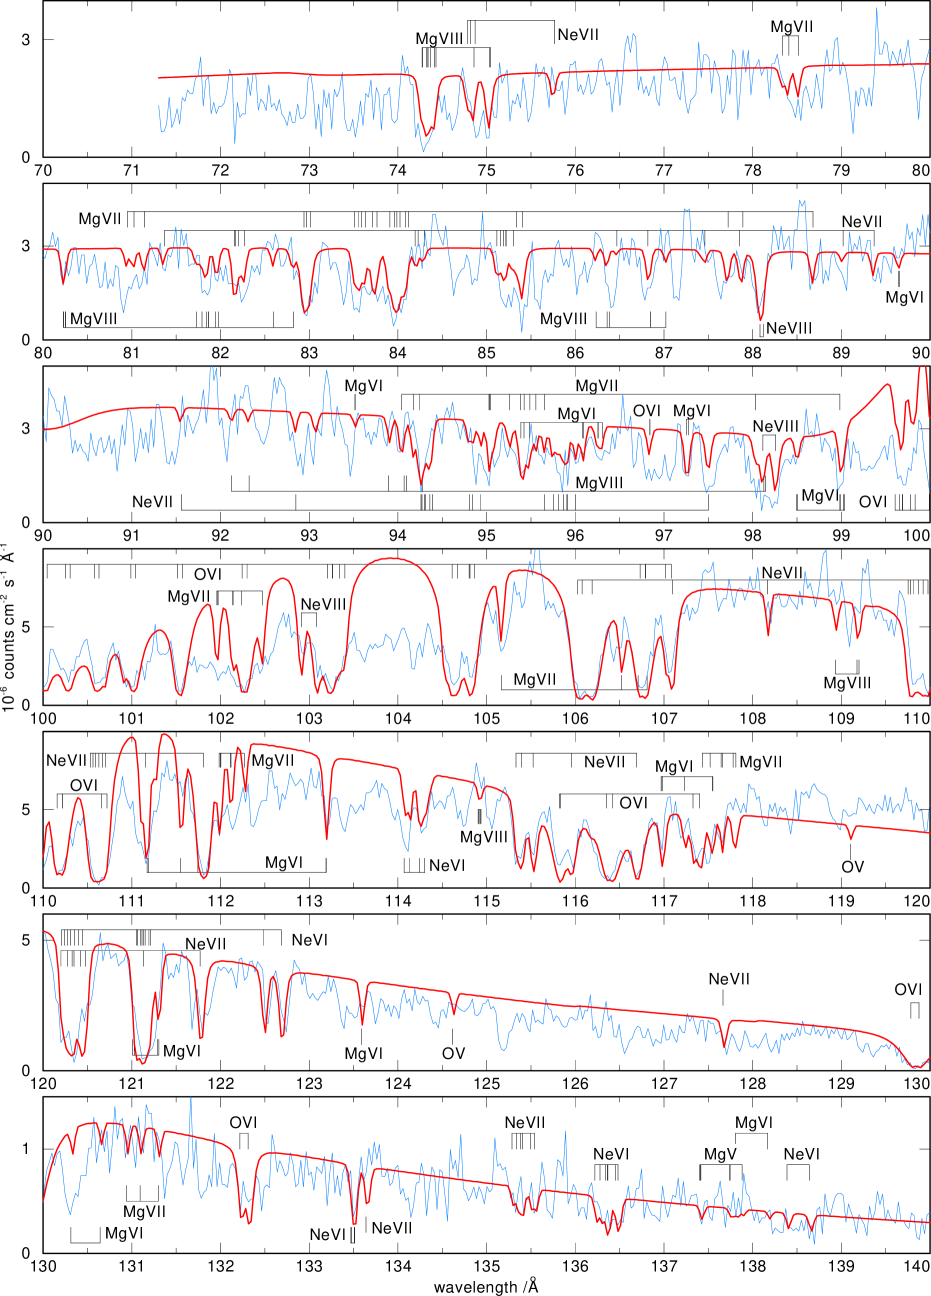
Figure 6 shows in more detail the Chandra spectrum of H 1504$+$65. Considering the problems with fitting the overall continuum flux, we now normalize the model flux to the local continuum in each panel of this figure. In order to facilitate line identifications, we overplot that model from our grid which turned out to fit best to the line spectrum. The observed spectrum was shifted by -0.06Å to the rest wavelength. We detect lines from O vi, Ne vi-viii, and Mg v-viii. The strong and broad O vi and Ne vii lines were already detected in the EUVE spectrum (WW99), the detection of magnesium is new. Identification of even the strongest lines becomes difficult at longer wavelengths (see bottom panel of Fig. 6) due to the decreased S/N-ratio.
For a concise presentation of our analysis, we first concentrate on the effective temperature which is the most important parameter determining ionization balances, while keeping fixed = 8 from our analysis of optical spectra. We think that an improvement of the error range for the gravity (0.5 dex, W91) is not possible because of uncertainties in line broadening calculations. We also keep fixed the relative abundances of C, O, and Ne, which are the dominant species, and include He as a trace element (which has unimportant effects on model structures and fluxes). Hence, the composition of all models shown here is: He=1%, C=48.5%, O=48.5%, Ne=2%. As mentioned above, other elements are included later in line formation iterations.
We start the analysis with a first estimate for the Mg abundance (2%) which will be justified later. After this we turn to the search for other species (Al, Na, Fe, Ni).
5.1 Effective temperature from ionization balances
Given the described uncertainty in the determination of from the overall X-ray flux shape, it is important to constrain the temperature by comparing line strengths from different ionization stages of the identified species. We discuss their appearance in the context of three models with =175 000 K, 200 000 K, and 250 000 K. Qualitatively, the shift of ionization balances and, hence, the change of line strengths with increasing can be understood with the help of Fig. 2.
Oxygen
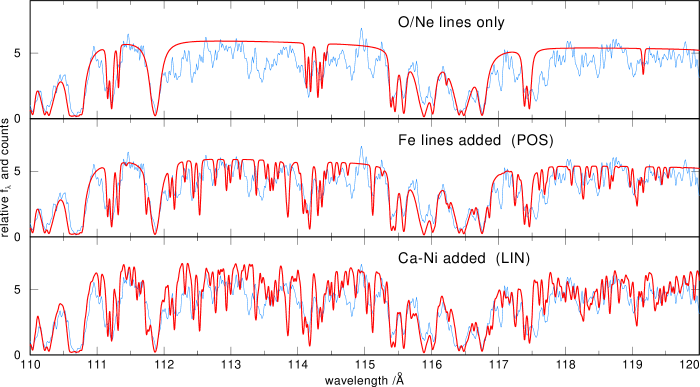
First of all, the observed spectrum does not exhibit O v lines. Two relatively unblended O v lines (at 119.1Å and 124.6Å) appear very strong in the 175 000 K model and decrease in strength with increasing . Even at 200 000 K the lines are still quite strong. On the other hand, at 250 000 K all strong O vi lines generally become too weak. This clearly suggests 200 000 K). As we will see later, strong line blanketing by Fe group elements can severely hamper the detection of individual weak lines. Fig. 9 shows for example how the O v 119.1Å line becomes difficult to detect in the respective model spectra.
Neon
We detect several Ne vi lines, the strongest are located at 122.5,122.7Å and 114.1–114.4Å. They come out too strong in the 175 000 K model and too weak at 250 000 K, they fit best at =200 000 K. =250 000 K can also be excluded because all Ne vii lines become too weak.
Magnesium
Increasing in our models from 175 000 K to 250 000 K has the following consequences for the line strengths: Lines from Mg v and Mg vi become weaker, Mg vii strengths are hardly affected (they are maximal at 200 000 K), and Mg viii lines become very strong. We point out some individual lines, which altogether suggest =200 000 K: Mg v 137.4Å is barely detectable. It would have completely disappeared if =250 000 K. A broad trough of Mg vii lines is located near 83–84Å. It is very nicely fitted by our models, however, it is quite insensitive against . More interesting is Mg viii 74.3–74.4Å. It is best fitted by the 200 000 K model, while too weak or too strong at 175 000 K and 250 000 K, respectively. It seems as if two lines from Mg vi are predicted too strong even at 200 000 K, namely the multiplets near 123.6Å and 111.7Å but, again, Fe group line blanketing could obscure these features.
As to the magnesium abundance, we calculated a 200 000 K model with the Mg reduced by a factor of 10. The vast majority of the lines become significantly too weak. In contrast the assumed abundance of 2% generally gives a good fit. We estimate the Mg abundance error to 0.5 dex. In view of the uncertainty to define the flux continuum we have to accept that a more accurate determination is not possible.
5.2 Search for aluminum and sodium
As already mentioned, the detection of weak individual lines is very difficult due to strong line blending from Fe group elements. Even careful modeling of this dense line curtain does not help, because the positions of most Fe group lines are inaccurate. So we are very conservative in our search for further species in the Chandra spectrum.
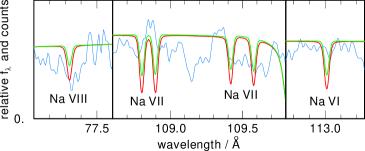
Sodium and aluminum are important elements for the discussion of the evolutionary status of H 1504$+$65. Fig. 7 compares calculated sodium line profiles with the Chandra spectrum. We have selected some of the strongest lines of three ionization stages, Na vi–viii. The profiles are computed for two different Na abundances, 0.3% and 0.03%. There is no clear evidence for sodium lines in the Chandra spectrum. We estimate an upper limit of Na=0.1%, which is about 30 times solar.
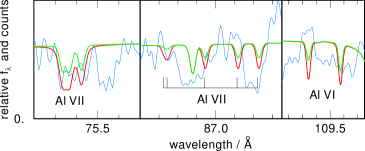
Al vi and Al vii show the strongest aluminum lines in the model with =200 000 K. Al v and Al viii are predicted to be much weaker. Some of these strongest lines are shown in Fig. 8. Two models were calculated with abundances of 0.1% and 0.01%. Although there seems to be a good fit by the calculated quartet at 75.2Å (left panel), this is regarded as a chance coincidence with some other unidentified feature, because other Al lines cannot be identified. We estimate an upper limit of Al=0.1%, which is about 20 times solar.
5.3 Search for iron and nickel
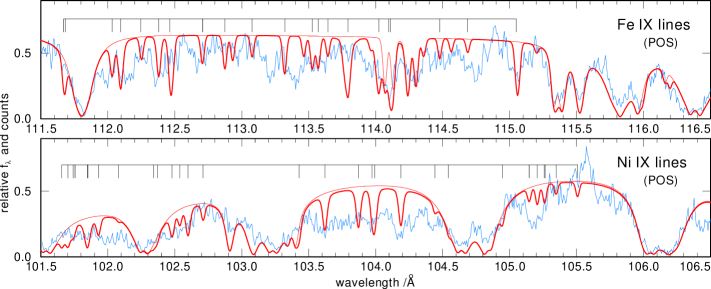
Figure 9 shows the strong influence of heavy metal line blanketing. It becomes clear that the identification of individual lines from the POS line lists is affected by the many more lines from the LIN lists, which have uncertain wavelengths. Indeed, it is not possible to identify the majority of the strong Fe ix and Ni ix lines appearing in the synthetic spectra shown in Fig. 10, hence, we cannot derive abundances for individual Fe group elements. For all models including Ca–Ni we have assumed solar abundances for these elements. This appears to be a good estimate, because in many parts of the Chandra spectrum the line blanketed models seem to give a better overall fit to the observation. So we conclude that the Fe group elements have a total abundance which is in accordance with solar values, albeit with a large uncertainty.
5.4 Unidentified absorption features
Many absorption features in the Chandra spectrum cannot be identified. Considering the large number of potential iron group lines whose exact wavelength position is unknown, this is not surprising. However, let us comment on about a dozen of the strongest of these features. Some of them can be attributed to magnesium and neon lines which are not included in our model atoms, because their high upper level energies would require excessively large model atoms. These are lines from Mg v (114.8/115.1Å), Mg vii (79.25Å, 84.64Å, 87.13/.17Å, 91.49Å), Mg viii (80.89Å, 84.92Å), and Ne vi (109.03/.07Å). The strong absorption at 125.1Å remains unidentified. It cannot be a quartet transition of Mg vi located there. It is included in our models but it is very weak. The same applies to a Ne vi doublet at this position. A line observed at 86.4Å could be from Al viii 86.43Å, but this is a triplet-quintet intercombination transition and therefore probably too weak to explain the observation. Other strong unidentified features are located at 93.5Å (a Fe viii line here is too weak) and 113.4Å. We recall that they could also stem from resonances in bound-free cross-sections.
It is our general impression, supported for example by Fig. 9 that, besides strong O, Ne, and Mg lines, the blanketing by many relatively weak iron group lines characterizes the Chandra spectrum. Our models show similar characteristics, except for wavelengths below, say, 100Å. We attribute this to those high ionization stages, particularly of Fe and Ni, for which no line lists are available. We are probably neglecting a large number of Fe xi and Ni x-xi lines at Å, hence, atomic data for these species are badly needed. In the case of Ni x we computed the positions of a dozen of resonance lines from Bashkin & Stoner (1975) energy levels. They are located around 85Å and one of these lines could in fact explain the unidentified 86.4Å feature mentioned above.
6 Summary of spectral analysis
Let us summarize the properties of H 1504$+$65:
Element abundances in % mass fraction:
The value of and abundances for C, O, and Ne were taken from previous work (W91, WW99). Estimated errors for abundances are: 20% for mass fraction of C and O, and a factor of 3 for Ne, Mg, and Fe-group.
Stellar mass and luminosity can be derived by comparing the position of H 1504$+$65 in the - diagram with theoretical evolutionary tracks. We use the post-AGB tracks of Blöcker (1995) and derive:
Note that the mass of H 1504$+$65 is considerably higher than the mean mass of the PG1159 stars (0.6 M⊙). The spectroscopic distance was obtained by comparing the measured visual flux (V=16.24, Nousek et al. 1986) with the flux of the final model (=200 000 K, = 8): Hν[5400Å]= erg/cm2/s/Hz). Interstellar reddening was neglected for this determination, because it is very low. In fact, the best model fit to the continuum shape of the UV/FUV spectrum taken with HUT provided E(B-V)=0 (Kruk & Werner 1998).
7 Discussion
PG1159 stars are extremely hot post-AGB stars, many of them have already entered the hot end of the WD cooling sequence. Generally their atmospheres are H-deficient and primarily composed of He, C, O, and Ne (typical abundances are 33%, 50%, 15%, 2%; Werner 2001). It is now generally accepted that they expose intershell matter, i.e., material that was located between the H- and He-burning shells in the former AGB precursor star. In contrast to “normal” H-rich post-AGB stars the PG1159 stars have suffered a late He-shell flash, during the post-AGB or WD stage. The flash induces mixing of the intershell (which has a mass of about 0.01M⊙) with the much less massive H-rich envelope (about M⊙). Quantitatively, the intershell element abundances (He, C, O, Ne) in stellar evolutionary models are now in good agreement with observations. The observed high O abundances require strong convective overshoot in order to dredge up oxygen from the stellar C/O core into the convective intershell (Herwig et al. 1999).
The high amount of 22Ne in the intershell is generated by -captures on 14N from CNO cycling (see, e.g., Iben 1995, or Lattanzio 2003). Provided the temperature is high enough (which is the case in relatively massive AGB stars) another -capture on 22Ne yields 25Mg or 26Mg by (,n) or (,) reactions, respectively. This can explain the high amount of Mg that we found in H 1504$+$65, which is the most massive PG1159 star. We also would expect to find a Mg enrichment in other PG1159 stars, but the lack of appropriate spectral lines in the optical/UV prevents its detection.
Besides the production of Ne and Mg in the intershell of AGB stars during the usual He-shell flashes (thermal pulses), one expects processing of these elements to Na and Al if they are dredged up into the H-burning shell, namely through the Ne-Na and Mg-Al cycles: 22Ne(p,)23Na and 25,26Mg(p,)26,27Al. The high amounts of Ne and Mg in H 1504$+$65 on the one hand and the fact that we could not detect strong overabundances of Al and Na on the other hand suggests that these cycles were unimportant for the creation of today’s photospheric chemistry of H 1504$+$65.
It is unfortunate that we are not able to determine quantitatively the abundances of individual Fe peak elements. We expect that we should see effects of s-processing on these elements, shifting away their relative abundances from the solar values. In fact, it has been found that PG1159 stars are Fe-deficient, and we suspect this is indeed a result of n-captures on Fe seeds (Miksa et al. 2002, Werner et al. 2003b, Herwig et al. 2003). 13C is the main neutron source and it is created by 12C from He-burning and hydrogen from the surface layer: 12C(p,)13N()13C(,n)16O. Another source can be the above mentioned 22Ne(,n)25Mg reaction.
But how can we explain the He-deficiency of H 1504$+$65? Is it just an extreme PG1159 star in which He was completely burnt up to C and O during the late He shell flash? This can only be a speculation. There are no appropriate model calculations supporting such a scenario. Another idea which we already discussed before (W91, WW99) is that H 1504$+$65 has an evolutionary history completely different from the other PG1159 stars. H 1504$+$65 could have gone through carbon burning, i.e., it would now have a O-Ne-Mg core and we could see the C/O-rich envelope on top of it. Hence, H 1504$+$65 might have been one of the “heavy-weight” intermediate-mass stars (8 M 10 M☉) which form white dwarfs with electron-degenerate O-Ne-Mg cores. Evolutionary models by Iben et al. (1997) predict high Ne and Mg abundances for the C/O envelope, also in agreement with our analysis. So it is not possible to decide if we are looking onto a C/O core or a C/O envelope unless, in the latter case, we should see direct evidence for C-burning. One such piece of evidence would be a strong sodium (23Na) enrichment. The 23Na abundance at the bottom of the C/O envelope is comparable to that of neon (main isotope 20Ne) and magnesium (24,25,26Mg, see Fig. 34 of Iben et al. 1997). This is not observed in H 1504$+$65, however, we stress the difficulty of giving a tight upper abundance limit for Na from the present observational data.
The possibility that H 1504$+$65 is a O-Ne-Mg white dwarf is remarkable, because evidence for the existence of such objects is rather scarce (Weidemann 2003). Evidence from single massive WDs is weak, and the most convincing cases are WDs in binary systems. Strong neon overabundances are found in novae (Livio & Truran 1994) or in eroded WD cores in low-mass X-ray binaries (e.g. Juett et al. 2001, Werner et al. 2004).
It is also interesting to note that the supersoft X-ray source RX J0439.8-6809 was suggested to be similar to H 1504$+$65. This very faint object (V21) has a steep blue and almost featureless optical/UV spectrum, except for each two O vi and N v emission lines in optical spectra (van Teeseling et al. 1999, Reinsch et al. 2002). The presence of nitrogen in completely 3-processed matter is hard to understand and, instead, it might be possible that the respective optical lines stem from C v and O viii. Such highly ionized emission lines have been detected in the hottest helium-rich DO white dwarf KPD 0005+5106 and some PG1159 stars (Werner et al. 1994) and were attributed to non-photospheric shock-heated emission regions.
8 Summary
We have analyzed new FUV and soft X-ray spectra of the unique object H 1504$+$65. We confirm its exotic chemical composition, which is dominated by C and O. We confirm the high Ne abundance and find a similarly high abundance of Mg. This chemistry either reflects that of the core of a C/O white dwarf or the C/O envelope of a white dwarf with a O-Ne-Mg core. It therefore remains unclear if H 1504$+$65 has gone beyond 3 burning through a subsequent C burning phase or not. In any case, the origin of the He-deficiency remains obscure. H 1504$+$65 could be an extreme PG1159 star which – in contrast to the other stars of this group – has for some unknown reason burned up its helium completely. Alternatively, H 1504$+$65 could have burned carbon, now being a O-Ne-Mg white dwarf. Some unidentified mechanism (C shell flashes?) may be responsible for the loss of helium by ingestion and burning in deep hot layers. Interestingly, Iben and collaborators have predicted that such C-burning stars in the super-AGB phase could loose their H- and He-rich envelopes by a radiation driven superwind (Ritossa et al. 1996). H 1504$+$65 might resemble the result of such a scenario.
A surprisingly rich photospheric absorption line spectrum in the soft X-ray regime has been revealed by our Chandra observation. Although the overall flux distribution cannot be explained by a single model with a particular temperature, the ionization equilibria of O, Ne, and Mg suggest that is slightly higher than determined in previous analyses (200 000 K20 000 K). This makes H 1504$+$65 the hottest known post-AGB star and white dwarf ever analyzed in detail with model atmosphere techniques.
Acknowledgements.
FUSE and Chandra data analysis in Tübingen is supported by the DFG under grant We 1312/30-1. TR is supported by the DLR under grant 50 OR 0201. MAB is supported by the Particle Physics and Astronomy Research Council, UK. JWK is supported by the FUSE project, funded by NASA contract NAS5-32985. We thank Dr. Kramida (NIST) and Prof. Kunze (University of Bochum) for their advice on the Ne vii 973Å line identification. This research has made use of the SIMBAD Astronomical Database, operated at CDS, Strasbourg, France.References
- (1) Bashkin, S., & Stoner, J.O. Jr. 1975, Atomic Energy Levels & Grotrian Diagrams, Vol. 1, Amsterdam, North Holland
- (2) Blöcker, T. 1995, A&A, 299, 755
- (3) Herwig, F., Blöcker, T., Langer, N., & Driebe, T. 1999, A&A, 349, L5
- (4) Herwig, F., Lugaro, M., & Werner, K. 2003, in Planetary Nebulae: Their Evolution and Role in the Universe, eds. S. Kwok, M. Dopita, R. Sutherland, IAU Symp. 209, ASP, p. 85
- (5) Iben, I. Jr. 1995, Phys. Rep., 250, 2
- (6) Iben, I. Jr., Ritossa, C., & Garcia-Berro, E. 1997, ApJ, 489, 772
- (7) Johnston, W.D., & Kunze H.-J. 1971, Phys. Rev. A, 4, 962
- (8) Juett, A.M., Psaltis, D., & Chakrabarty, D. 2001, ApJ, 560, L59
- (9) Kruk, J.W., & Werner, K. 1998, ApJ, 502, 858
- (10) Kurucz, R.L. 1991, in Stellar Atmospheres: Beyond Classical Models, eds. L. Crivellari, I. Hubeny, D.G. Hummer, Kluwer, Dordrecht, NATO ASI Series C, 341, 441
- (11) Lang, J. 1983, J. Phys. B, 16, 3907
- (12) Lattanzio, J. 2003, in Planetary Nebulae: Their Evolution and Role in the Universe, eds. S. Kwok, M. Dopita, R. Sutherland, IAU Symp. 209, ASP, p. 73
- (13) Lindeberg, S. 1972, Uppsala Univ. Inst. Phys., Report UUIP-759, 1
- (14) Livio, M., & Truran, J.W. 1994, ApJ, 425, 797
- (15) Miksa, S., Deetjen, J.L., Dreizler, S., Kruk, J., Rauch, T., & Werner, K. 2002, A&A, 389, 953
- (16) Moos, H.W., Cash, W.C., Cowie, L.L., et al. 2000, ApJL, 538, 1
- (17) Nousek, J.A., Shipman, H.L., Holberg, J.B., et al. 1986, ApJ, 309, 230
- (18) Nugent, J.J., Jensen, K.A., Nousek, J.A., et al. 1983, ApJS, 51,1
- (19) Rauch, T., & Deetjen, J.L. 2003, in Stellar Atmosphere Modeling, eds. I. Hubeny, D. Mihalas, K. Werner, ASP Conf. Ser., 288, 31
- (20) Reinsch, K., Beuermann, K., & Gänsicke, B.T. 2002, in The Physics of Cataclysmic Variables and Related Objects, eds. B.T. Gänsicke, K. Beuermann, K. Reinsch, ASP Conf. Ser., 261, 653
- (21) Ritossa, C., Garcia-Berro, E., & Iben, I. Jr. 1996, ApJ, 460, 489
- (22) Sahnow, D.J., Moos, H.W., Ake, T.B., et al. 2000, ApJL, 538, 7
- (23) Seaton, M.J., Yan, Y., Mihalas, D., & Pradhan, A.K. 1994, MNRAS, 266, 805
- (24) van Teeseling, A., Gänsicke, B.T., Beuermann, K., Dreizler, S., Rauch, T.,& Reinsch, K. 1999, A&A, 351, L27
- (25) Weidemann, V. 2003, in White Dwarfs, eds. D. de Martino, R. Silvotti, J.-E. Solheim, R. Kalytis, NATO Sci. Ser. II, Kluwer, Vol. 105, 3
- (26) Werner, K. 1991, A&A, 251, 147 (W91)
- (27) Werner, K. 1996, ApJ, 457, L39
- (28) Werner, K. 2001, in Low Mass Wolf-Rayet Stars: Origin and Evolution, eds. T. Blöcker, L.B.F.M. Waters, A.A. Zijlstra, Ap&SS, 275, 27
- (29) Werner, K., & Wolff, B. 1999, A&A, 347, L9 (WW99)
- (30) Werner, K., Heber, U., & Hunger, K. 1991, A&A, 244, 437
- (31) Werner, K., Heber, U., & Fleming, T. 1994, A&A, 284, 907
- (32) Werner, K., Deetjen, J.L., Dreizler, S., Nagel, T., Rauch, T., & Schuh, S.L. 2003a, in Stellar Atmosphere Modeling, eds. I. Hubeny, D. Mihalas, K. Werner, ASP Conf. Ser., 288, 31
- (33) Werner, K., Deetjen, J.L., Dreizler, S., Rauch, T., & Kruk, J.W. 2003b, in Planetary Nebulae: Their Evolution and Role in the Universe, eds. S. Kwok, M. Dopita, R. Sutherland, IAU Symp. 209, ASP, p. 169
- (34) Werner, K., Nagel, T., Dreizler, S., & Rauch, T. 2004, in Compact Binaries in the Galaxy and Beyond, IAU Coll. 194, in press (astro-ph/0312561)
- (35) Young, P.R., Del Zanna, G., Landi, E., Dere, K.P., Mason, H.E., & Landini M. 2003, ApJS, 144, 135