X-ray, Radio, and Optical Observations of the Putative Pulsar in the Supernova Remnant CTA 1
Abstract
A Chandra image of the central X-ray source RX J0007.0+7303 in the supernova remnant CTA 1 reveals a point source, a compact nebula, and a bent jet, all of which are characteristic of energetic, rotation-powered pulsars. Using the MDM 2.4m telescope we obtain upper limits in the optical at the position of the point source, (J2000) , , determined to an accuracy of , of , , , and ; these correspond to an X-ray-to-optical flux ratio . Neither a VLA image at 1425 MHz, nor a deep pulsar search at 820 MHz using the NRAO Green Bank Telescope, reveal a radio pulsar counterpart to an equivalent luminosity limit at 1400 MHz of 0.02 mJy kpc2, which is equal to the lowest luminosity known for any radio pulsar. The Chandra point source accounts for of the flux of RX J0007.0+7303, while its compact nebula plus jet comprise . The X-ray spectrum of the point source is fitted with a power-law plus blackbody model with , keV, and km, values typical of a young pulsar. An upper limit of K to the effective temperature of the entire neutron star surface is derived, which is one of the most constraining data points on cooling models. The 0.5–10 keV luminosity of RX J0007.0+7303 is ergs s-1, but the larger ( diameter) synchrotron nebula in which it is embedded is two orders of magnitude more luminous. These properties allow us to estimate, albeit crudely, that the spin-down luminosity of the underlying pulsar is in the range ergs s-1, and support the identification of the high-energy -ray source 3EG J0010+7309 as a pulsar even though its spin parameters have not yet been determined.
1 Introduction
The supernova remnant CTA 1 (G119.5+10.2) is a radio shell with a diameter of (Seward, Schmidt, & Slane, 1995) and a center-filled X-ray morphology. It has a kinematic distance of kpc derived from an associated H I shell (Pineault et al., 1993), and the remnant age from a Sedov analysis is yr (Slane et al., 2004). A detailed X-ray spectral study of the SNR using ASCA data showed that the large-scale extended emission is likely of a synchrotron origin; its total luminosity is ergs s-1 in the 0.5–10 keV band (Slane et al., 1997). The compact ROSAT PSPC source RX J0007.0+7303 is located in the brightest part of the synchrotron nebula (Seward et al., 1995; Slane et al., 1997; Brazier et al., 1998). RX J0007.0+7303 has the requisite properties for a rotation-powered pulsar. Its X-ray luminosity in the 0.1–2.4 keV band is ergs s-1 (Slane et al., 1997), typical of young pulsars, but atypically small compared to the total luminosity of the large synchrotron nebula in CTA 1. Appealing to an empirical relation between X-ray luminosity and spin-down power , Slane et al. (1997) argued that the current spin-down power of the pulsar, required to account for the present nonthermal emission from the entire synchrotron nebula, is ergs s-1. Combining this with the Sedov age predicts a rotation period s and a dipolar surface magnetic field strength G.
Within the boundary of CTA 1 lies 3EG J0010+7309, one of the brighter unidentified EGRET sources. With a 95% confidence localization diameter of only and an intermediate Galactic latitude of , this EGRET/SNR coincidence is one of the most convincing among the unproven identifications (Brazier et al., 1998), especially because of the likely pulsar in RX J0007.0+7303. The -ray source itself has all of the characteristics of the known pulsars. It is not variable; other -ray pulsars show little if any change in flux while most blazars, the other major class of EGRET source, are often dramatically variable. Its photon spectral index of (Hartman et al., 1999) ( between 70 MeV and 2 GeV, Brazier et al. 1998), is similar to other EGRET pulsars, and flatter than that of most blazars. The estimated values of , and are all typical of what one would expect for a young -ray pulsar. In particular, the distance to CTA 1 is typical for the predicted EGRET pulsar population (e.g., Halpern & Ruderman, 1993; Kaaret & Cottam, 1996; Romani & Yadigaroglu, 1995; Yadigaroglu & Romani, 1995, 1997), and the inferred energetics are comparable to those of the Vela pulsar and other sources with similar values of .
Recent observations with XMM-Newton resolved RX J0007.0+7303 into a point source and a diffuse nebula, and found a two-component (blackbody plus power-law) spectral fit that is consistent with a young pulsar (Slane et al., 2004). Here, we present a higher resolution Chandra observation of these features that further resolves out a prominent jet-like structure and possible evidence of a torus, features typical of pulsar wind nebulae (PWNe) found around the most energetic of pulsars. In §2 we present our Chandra imaging and spectroscopic results, in §3 the optical observations, and in §4 new radio imaging and deep radio search for pulsations from RX J0007.0+7303. In §5 we discuss the constraints on for the putative pulsar in CTA 1 based on its X-ray and (likely) -ray luminosities. Throughout this paper, for clarity, we refer to the small-scale nebula resolved by Chandra within RX J0007.0+7303 as the PWN, as distinct from the large synchrotron nebula, which is also likely wind fed.
2 Chandra Observation of RX J0007.0+7303
The central region of CTA 1 was observered on 2003 April 13 with the Advanced CCD Imaging Spectrometer (ACIS; Burke et al., 1997) onboard the Chandra X-ray Observatory (Weisskopf, O’Dell, & van Speybroeck, 1996). The source RX J0007.0+7303 was positioned at the default location on the back-illuminated S3 chip of the ACIS-S array. The standard TIMED readout with a frame time of 3.2 s was used, and the data were collected in VFAINT mode. A total of 50139 s of on-time was accumulated, while the effective exposure live-time was 49484 s. All data reduction and analysis were performed using the CIAO (V3.0.1), FTOOLS (V5.2), and XSPEC (V11.2) X-ray analysis software packages. No time filtering was necessary as the background rate was stable over the course of the observation. Photon pile-up was not a consideration as the total count rate in the point source of interest was s-1.
We used the standard processed and filtered event data with the latest aspect alignments, with the exception that the 0.5 pixel () randomization that is ordinarily applied to the photon positions was reversed, restoring slightly sharper images. The ACIS pixels slightly undersample the on-axis point spread function of the Chandra mirrors in the restored images, as the radius encircling of the energy is . However, the spacecraft dithering and time-dependent aspect solution preclude the need for additional randomization, which degrades a study of faint point sources embedded in diffuse emission.
2.1 ACIS Image
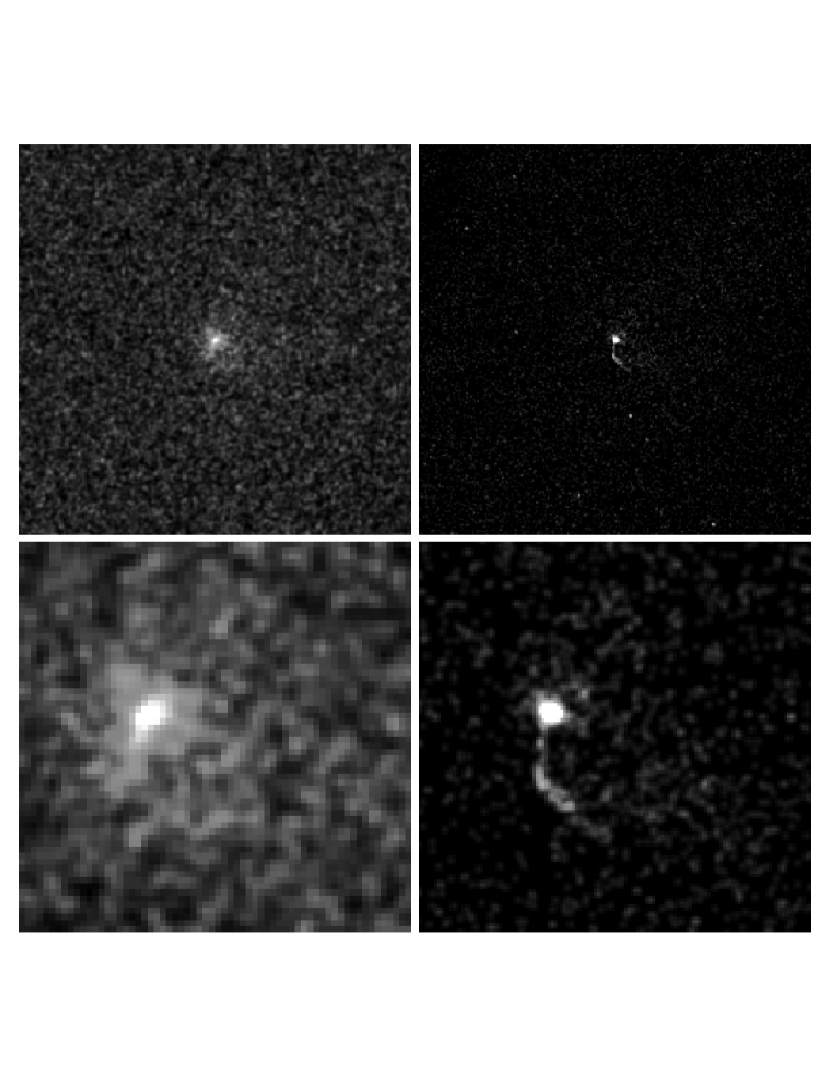
In Figure 1 we compare the Chandra ACIS image of RX J0007.0+7303 from 2003 April 13 with the combined MOS1 and MOS2 image from the XMM-Newton observation of 2002 February 21, originally reported by Slane et al. (2004). In the Chandra image, 187 photons (after background subtraction) are found within of the source maximum; most are attributable to a point source. Figure 2 shows the radial profile of the Chandra source, with a simulated point-spread-function (PSF) scaled to the detected counts in the central pixel. There is also a compact surrounding nebulosity with 136 photons within a radius of (the PWN), as well as a jet that extends to the south, with a bend to the southwest at from the point source. There is also a possible faint extension of the jet for an additional to the southwest, although the latter may be part of a general expansion of the jet into a large, low-surface brightness nebulosity extending to the west and northwest. The total number of photons in the jet is 45 after background subtraction. From the Vela pulsar, similar diffuse emission apparently supplied by its jet has been observed (Kargaltsev et al., 2003; Pavlov et al., 2003).
In view of Chandra’s unique ability to reveal graphic evidence of a rotation-powered neutron star, we refer in this paper to “the pulsar” in RX J0007.0+7303 rather than the customary circumlocution “candidate pulsar.” The ACIS frame time of 3.2 s does not permit a search for X-ray pulsations in this observation. From the XMM-Newton EPIC pn data taken with 6 ms time resolution, Slane et al. (2004) derive an upper limit of 61% sinusoidal pulsed fraction for frequencies up to 83 Hz. Nevertheless, we regard it as appropriate in cases such as this one to classify an X-ray source as a pulsar even though its spin parameters are not yet known. The position of the pulsar is (J2000) , (see §3 for a description of the astrometry).
While the similarity between the jets of RX J0007.0+7303 and Vela is striking, it is curious that the prominent torus structure of Vela is so much weaker in RX J0007.0+7303, if it is present at all. The compact PWN surrounding the pulsar appears to be elongated at an angle perpendicular to the inner jet, which by analogy with Vela may plausibly be interpreted as an equatorial torus with the jet emerging along the rotation axis. Figure 3 shows the Chandra image in two different energy bands, soft (0.2–2.0 keV) and hard (2–8 keV). The PWN is more prominent in the hard band, while the pulsar itself is brighter in the soft band, presumably due to the contribution of surface thermal emission from the neutron star (see §2.2.2), which has a softer spectrum than the synchrotron nebulosity. Apparent spectral differences exist along the length of the jet. The hardest regions of the jet are closest to the pulsar, while the softest part of the jet is farther away, below the bend.
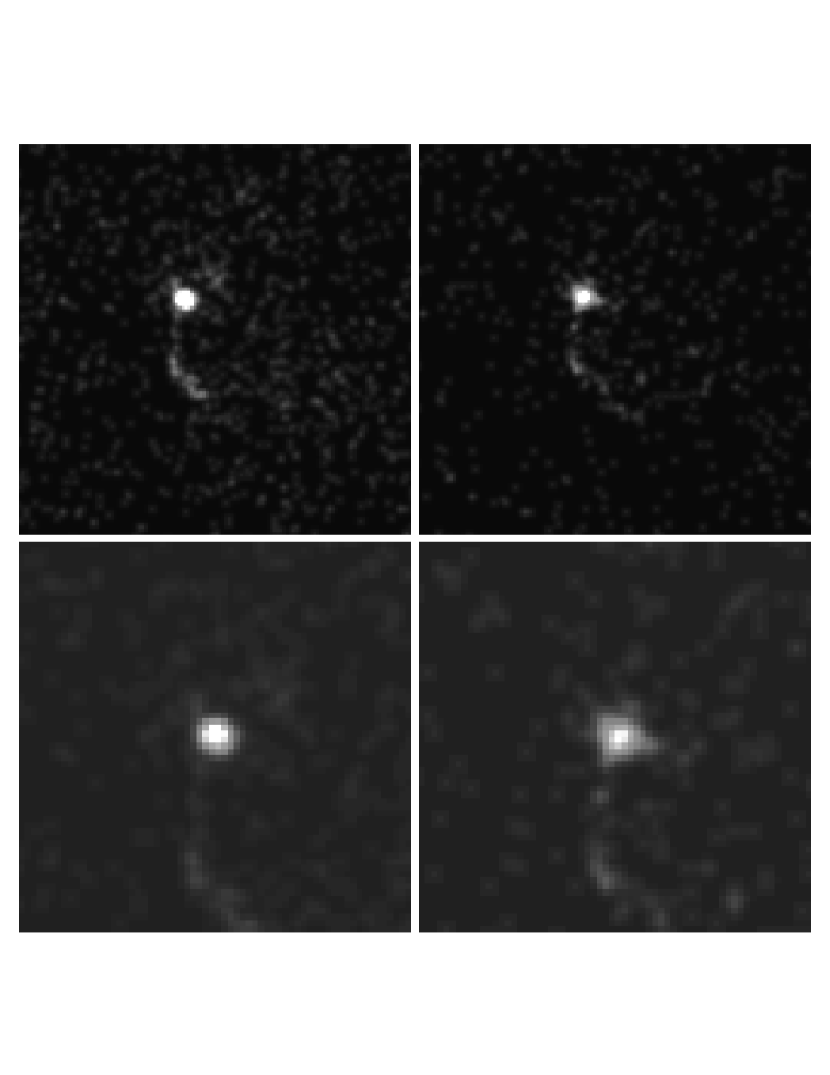
The features of the lower-resolution XMM-Newton image are roughly consistent with what one would expect from the Chandra image, although the part of the jet past the bend is not obvious with XMM-Newton. It is possible that the structure of the jet has changed markedly in the 14 months between the two observations. Such behavior would be consistent with the rapid changes seen in the jet of the Vela pulsar (Kargaltsev et al., 2003; Pavlov et al., 2003), which moves with speeds in the range , even in directions transverse to its length. Velocities comparable to were also seen in Chandra observations of G11.2–0.3 (Roberts et al., 2003). At the 1.4 kpc distance of CTA 1, the length of the jet corresponds to cm, or 130 light days. The length of the Vela pulsar’s jet is almost the same, cm, which may suggest that the two sources have similar spin-down luminosities. The bending and termination of the jet can plausibly be explained by its impact against the larger synchrotron nebula. In addition, if the pulsar is traveling toward the southeast, the low surface brightness diffuse emission to the west and northwest of the pulsar may be due to jet material dumping its energy and dispersing it into the larger nebula, as suggested by Pavlov et al. (2003) in the case of Vela.
2.2 X-ray Spectral Fitting
Source and background spectra were extracted using the CIAO script psextract to generate the photon energy histograms and appropriate response matrices for analysis of three spatial regions: the pulsar (), the PWN (), and the jet (irregular polygon). The PWN region served as background for the pulsar spectrum, while a larger annular background region () was extracted for use with the PWN and the jet spectra. All spectra were grouped with a minimum of 20 counts per bin.
2.2.1 The PWN and its Intervening Column Density
We first fitted the 136 background-subtracted counts obtained from the PWN region to an absorbed power-law model. This produced a rather unconstrained fit with cm-2 and , where the range is given in parentheses. The unabsorbed flux in the keV band is ergs cm-2 s-1 after adding a presumed contribution, scaled by area, from within the pulsar region (). We note that the best fitted value of cm-2 is somewhat larger than expected based on the total Galactic optical extinction in the direction of CTA 1. According to the m IRAS/COBE maps (Schlegel, Finkbeiner, & Davis, 1998), mag, corresponding to , which can be considered an upper limit on the extinction to CTA 1. The Predehl & Schmitt (1995) relation cm-2 mag-1 then implies cm-2. The latter value is close to that derived by Slane et al. (1997) from joint fits to ROSAT PSPC and ASCA spectra, which gave cm-2. Given the distance and intermediate Galactic latitude of CTA 1 (), it is plausible that the source lies above the bulk of the dust layer, since pc. Therefore, we adopt a fixed value of cm-2 in all further spectral fits, the results of which are listed in Table 1.
The 0.5–10 keV luminosity of the compact PWN region in RX J0007.0+7303 is ergs s-1. In comparison, the 0.1–10 keV luminosity of the Vela nebula within a radius of ( cm) is ergs s-1 (Helfand, Gotthelf, & Halpern, 2001; Pavlov et al., 2003), a difference that is manifest in the relative prominence of the toroidal features of the Vela nebula.
2.2.2 The Pulsar
We next fitted the pulsar spectrum, consisting of 187 background-subtracted counts, to a two-component absorbed power-law plus blackbody model, to allow for non-thermal magnetospheric emission and thermal emission from the neutron star surface, respectively. The column density was held fixed at cm-2. The best fitted parameters are and keV, with unabsorbed fluxes in the keV band of ergs cm-2 s-1 and ergs cm-2 s-1, for the power-law and blackbody components, respectively. The small effective radius of the blackbody component, km, is similar to the value km from the XMM-Newton analysis (Slane et al., 2004), and might be evidence of a hot polar cap heated by backflow of energetic particles. On the other hand, Slane et al. (2004) also fitted a light-element atmosphere model with a larger fixed radius of 10 km, enabling a lower temperature to be derived. Such systematic ambiguities are always present in thermal modeling of neutron star spectra.
Independent of this spectral fit to the pulsar, we also derive an upper limit to the effective blackbody temperature of the entire neutron star surface. Assuming kpc, cm-2, and a radius at infinity of 12 km, we compared simulated blackbody spectra of increasing temperature with the data until the predicted spectrum exceeded the observered counts in the lowest energy bin by , or nearly a factor of 2. The resulting upper limit is K. In Figure 4, we compare this value with a range of cooling models that include both standard and “exotic” processes (see also Page & Applegate 1992; Tsuruta et al. 2002, and the reviews of neutron star cooling by Tsuruta 1998 and Yakovlev & Pethick 2004). Recent calculations show that the temperatures or upper limits on all cooling neutron stars, such as Vela, Geminga, 3C 58 (PSR J0205+6449), and RX J0007.0+7303, can be fitted with models that include proton and neutron superfluidity, and masses (Kaminker, Yakovlev, & Gnedin, 2002; Yakovlev et al., 2002), as shown in Figure 4. Here, the direct Urca process is operating in the more massive neutron stars. Cooling can also be enhanced in a superfluid neutron star by Cooper-pairing neutrino emission, which was modeled most recently by Gusakov et al. (2004) and Page et al. (2004).
2.2.3 The Jet
For the jet we created a polygonal region which encompassed and followed the contour of the jet from to from the pulsar. A fit to the 45 background-subtracted photons with an absorbed power-law model, with again fixed to the ASCA value, yielded and an unabsorbed flux of ergs cm-2 s-1. While there are probably changes in spectral index along the jet that are related to the apparent differences in the soft and hard images (Fig. 3), there are too few photons to fit spectra to multiple regions. The 0.5–10 keV luminosity of the jet, ergs s-1, is almost identical to that of the main (inner plus outer) jet of the Vela pulsar, which has ergs s-1 (Pavlov et al., 2003). Within the range of uncertainty and variability, these two sources have jets of equal length and luminosity, which is in curious contrast to the relative dominance of the toroids in Vela.
3 Optical Observations of RX J0007.0+7303
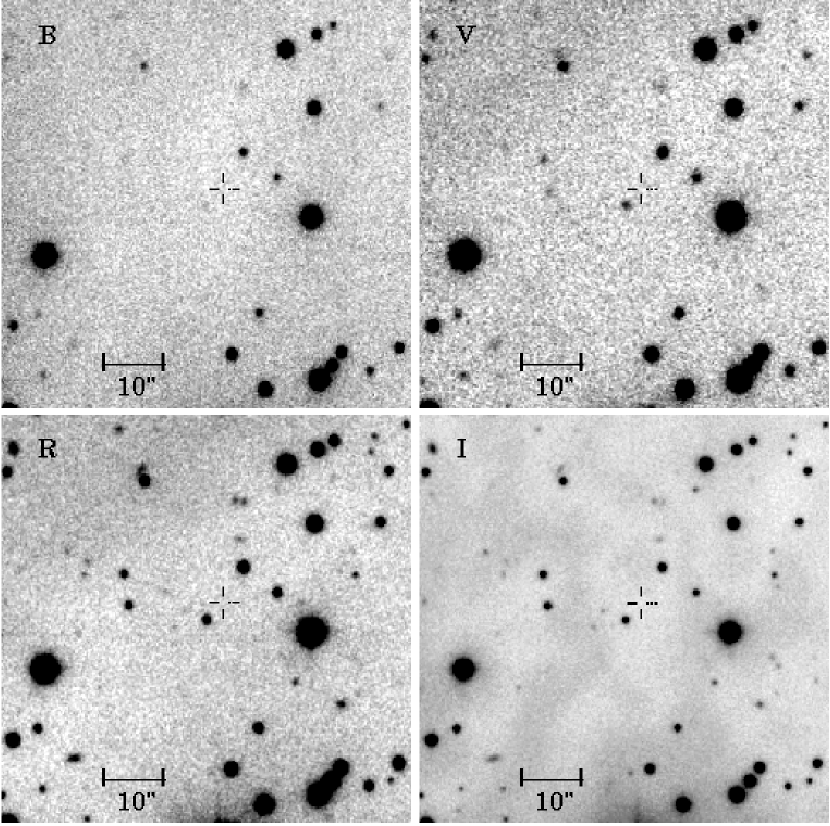
We obtained multiple CCD images of the field of RX J0007.0+7303 using the 2.4m Hiltner telescope of the MDM Observatory on 2002 August 26-30. A thinned, back-illuminated SITe CCD with a spatial scale of per m pixel was used to cover a area. The sky conditions were usually photometric enough to calibrate the images with Landolt (1992) standard stars, although moonlight prevented us from reaching the deepest possible limiting magnitudes. Total integration times were 100, 72, 120, and 75 minutes in , and , respectively. The seeing in the final, summed images, shown in Figure 5, ranged from a best of in to a worst of in .
We were able to confirm and refine the astrometric accuracy of the Chandra X-ray image relative to the optical reference frame of the USNO-A2.0 catalog (Monet et al., 1998) by identifying the counterparts of several X-ray sources in the vicinity of RX J0007.0+7303. X-ray positions and counts from the standard data processing, and optical positions and magnitudes from our CCD images, are listed in Table 2. The X-ray centroids and source counts are calculated within the 80% enclosed energy contour of the local point-spread function. All of the optical counterparts in Table 2 appear point-like except the first entry, CXOU J000647.2+730109, which is evidently a compact galaxy, and perhaps the very faint CXOU J000739.2+730404, whose structure is not clear. The five neighboring sources had mean X-ray–optical offsets of only in right ascension and in declination, and rms scatter of in right ascension and in declination. The rms scatter is consistent with the statistical accuracies of the individual optical and X-ray source positions, while the mean offset is well within the Chandra systematic 90% confidence accuracy of . Accordingly, we corrected the Chandra coordinates of the RX J0007.0+7303 point source by the small mean offsets, obtaining a final position of (J2000) , , which we expect is accurate to relative to the optical reference frame.
Limiting () magnitudes at the position of the Chandra point source are , , , and . The extinction-corrected limits using the Schlegel et al. (1998) values of , and , are , , , and . This corresponds to , or after correction for extinction. Similar values are obtained in the other bands, and are consistent with an isolated neutron star at the distance of CTA 1. No extended optical emission is seen associated with the X-ray jet.
4 Radio Observations of RX J0007.0+7303
4.1 VLA Image
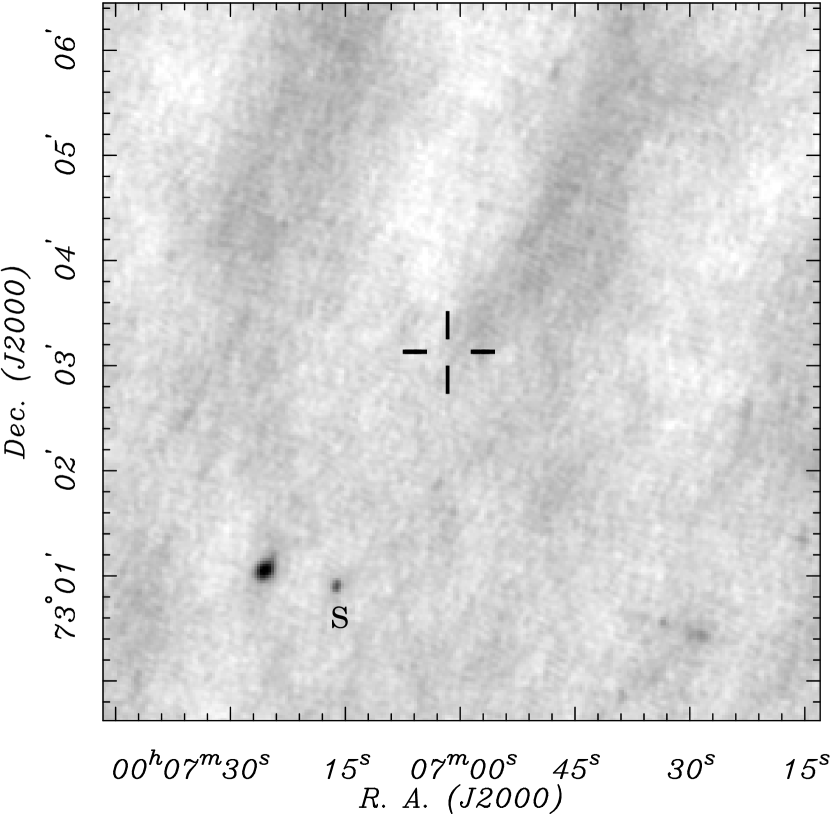
The field of RX J0007.0+7303 was imaged at 1425 MHz using the AB configuration of the VLA on 2002 May 27, which gave a beam FWHM of . An exposure time of 1 hour achieved a noise level of Jy and a non-detection at the precise Chandra position of the pulsar. This is equivalent to a flux density upper limit of mJy. The relevant part of the image in shown in Figure 6.
4.2 Radio Pulsar Search at GBT
CTA 1 was searched for pulsations by Nice & Sayer (1997) at radio frequencies of 370 MHz and 1390 MHz. The sensitivity of those observations, translated to a standard frequency of 1400 MHz using a spectral index (the median for all pulsars; Lorimer et al. 1995), was mJy and mJy, respectively. Also, Lorimer, Lyne, & Camilo (1998) reached a limit mJy in their search at 600 MHz. Our VLA upper limit, mJy, implies a luminosity mJy kpc2. While this is a stringent limit (the least luminous young radio pulsar known, in SNR 3C 58, has about twice this luminosity; Camilo et al. 2002c), there are weaker pulsars known. We therefore used the extremely sensitive Green Bank Telescope (GBT), where CTA 1 is a circumpolar source, to improve on this limit.
We observed the Chandra position of the pulsar for a total of 19.60 hr on 2003 October 11. We used the Berkeley-Caltech Pulsar Machine (BCPM; Backer et al. 1997), an analog/digital filter-bank with 96 channels for each of two polarizations, to record a 48 MHz-wide band centered at a sky frequency of 820 MHz. After summing in hardware the signals from the two polarizations, removing the mean and scaling, the power levels from each frequency channel were recorded with 4-bit precision to disk every s, for a total of 980 million time samples. [See Camilo et al. (2002c) for more details of a similar observation at the GBT using the BCPM.]
We analyzed the data using standard methods as implemented in the software package PRESTO (Ransom, 2001). This involved identification and removal of the worst radio-frequency interference (much of it generated at the observatory), time-shifting the 96 frequency channels to compensate for dispersive interstellar propagation prior to summing the respective samples (doing this once for each assumed value of dispersion measure, the integrated column density of free electrons), performing a Fast-Fourier Transform of the resulting one-dimensional time series for each trial DM after transformation to the solar-system barycenter, and sifting the resulting spectrum for statistically significant peaks. The last stage included searching for narrow pulse shapes by summing up to eight harmonics of the spectrum; and also searching for moderately accelerated signals, as might be expected from a pulsar in a binary system, or a young one with a large period derivative.
At a distance of 1.4 kpc, both the Taylor & Cordes (1993) and Cordes & Lazio (2002) electron density models predict cm-3 pc for the putative radio pulsar in CTA 1. However, the X-ray-measured cm-2 would predict cm-3 pc, assuming an average ratio . Also, the maximum Galactic dispersion in the direction of CTA 1 predicted by the Cordes & Lazio model is 200 cm-3 pc, so we searched up to this DM. Although the expected period for the pulsar in CTA 1 is s, and almost certainly not less than ms, we chose to analyze our data with much higher time resolution in order to retain serendipitous sensitivity to any pulsars located within the -diameter GBT beam. In order to simplify the onerous reduction task, we first rebinned the data four-fold to a time resolution of 0.288 ms, which we kept for the first 240 trial DMs, each separated by 0.5 cm-3 pc. The effective time resolution at the upper end of this range, limited by dispersive smearing within one frequency channel, is about 1 ms. We then further halved the time resolution, doubled the DM step, and searched a further 80 time series. In the end, we examined significant signals that appeared at more than one DM, but none showed a true interstellar dispersion pattern that would qualify it as a good pulsar candidate.
We now estimate the flux density limit of our observation. The ideal rms noise of the observation is , where K includes the system temperature on cold sky as well as a K contribution from Galactic synchrotron emission and K from CTA 1; K Jy-1 is the telescope gain; polarizations; is the bandwidth; and is the integration time. With our parameters, Jy. Including a factor accounting for losses due to hardware limitations and a threshold signal-to-noise ratio of 8, we obtain an estimated sensitivity for a sinusoidal pulse shape of Jy. For a pulse with duty cycle , this limit is further improved by a factor of . Translating this to 1400 MHz with , we obtain Jy for a sinusoidal pulse shape or Jy for . Strictly, these limits apply to relatively long pulse periods; for ms the limits are somewhat worse, the more so as increases.
Taking Jy as the flux density limit at 1400 MHz for the pulsar in CTA 1 implies mJy kpc2. This is equal to the lowest luminosity known for a radio pulsar, and is a factor of below the least-luminous pulsar known with an age of less than 1 Myr. If the pulsar in CTA 1 emits radio waves that intersect the Earth, its luminosity is lower than that of any detected radio pulsar; perhaps more likely, if it is a radio pulsar at all, its beam does not intersect the Earth.
5 Discussion: What is the Pulsar ?
The most important unknown property of RX J0007.0+7303 is its spin-down luminosity. Predictions of typically make use of correlations between and among known pulsars (e.g., Seward & Wang, 1988; Possenti et al., 2002), but this method is fraught with uncertainty, as well as special difficulties in the case of RX J0007.0+7303. The 0.5–10 keV luminosity of RX J0007.0+7303 that we measure with Chandra, including the point and diffuse components, is ergs s-1. This is slightly smaller than the value of ergs s-1 measured by Slane et al. (2004) using XMM-Newton, the difference probably attributable to an additional contribution of diffuse emission contained in the larger XMM-Newton extraction region. The spin-down luminosity predicted by Slane et al. (2004) using the Seward & Wang (1988) relation is then ergs s-1, comparable to the values found for older -ray pulsars such as Geminga, which has an ergs s-1. This interpretation is troubling in its neglect of the large synchrotron nebula, for which there is no proposed power source other than the pulsar. It is impossible to measure the entire synchrotron nebula of CTA 1 with Chandra because of its large size, low surface brightness, and lack of a clear boundary. But since the total synchrotron emission seen by ASCA exceeds the compact source luminosity by more than two orders of magnitude, consideration of the total energy budget would favor a minimum value of ergs s-1, as originally proposed by Slane et al. (1997).
We may also look to more detailed X-ray studies of pulsars with PWNe to estimate the spin-down power of CTA 1. From an empirical perspective, bright PWNe are found only around pulsars with ergs s-1 (Gotthelf, 2004).111Extended emission recently found around the nearby ( pc) Geminga pulsar (Caraveo et al., 2003) has of only ergs s-1, a mere of its or 2% of its . Such weak emission would not have been detected at the distance of CTA 1. Above this threshold, PWN emission typically exceeds the pulsar point-source luminosity by an order of magnitude. Furthermore, the spectral index of the pulsar in the 2–10 keV band correlates with according to the Gotthelf (2003) relation , where is the spin-down power in units of Applying this to CTA 1 for which suggests that ergs s-1, allowing for scatter in the relation.
Further indication that is in this higher range is suggested by the -ray luminosity of 3EG J0010+7309, which provides a lower-limit on the spin-down power. At kpc, the -ray flux integrated above 100 MeV corresponds to ergs s-1 if isotropic, or ergs s-1 if beamed into 1 steradian as is often (but arbitrarily) assumed. Thus, a prediction of ergs s-1 is incompatible with isotropic -ray emission, and requires a substantial degree of beaming. On the other hand, if ergs s-1, then the ratio is only 0.01 in the isotropic case, which is similar to Vela, whose ergs s-1. Note that this argument is independent of whether the X-ray spectrum of RX J0007.0+7303 can be extrapolated over four orders of magnitude in energy to join the -ray spectrum. Such a connection was suggested by Slane et al. (2004), but it is impossible to verify, as well as unnecessary for associating the sources. The keV power law of the Geminga pulsar clearly does not connect with its -ray spectrum (Jackson et al., 2002); rather, they are separate spectral components arising from different emission mechanisms.
6 Conclusions
The resemblance of the X-ray morphology of RX J0007.0+7303 to the PWN and jets seen in Chandra images of the Crab (Weisskopf et al., 2000), Vela (Helfand et al., 2001; Pavlov et al., 2001, 2003), PSR B1509–58 (Gaensler et al., 2002), and other newly discovered young pulsars (Halpern et al., 2001; Lu et al., 2002; Camilo et al., 2002a; Hessels et al., 2004), enables us to point confidently to “the pulsar” in the SNR CTA 1 even though its spin parameters have not yet been determined. Similar conclusions were drawn from Chandra observations of supernova remnants G0.9+0.1 (Gaensler, Pivovaroff, & Garmire, 2001), IC 443 (Olbert et al., 2001), 3C 396 (Olbert et al., 2003), and another unidentified EGRET source, GeV J1809–2327 (Braje et al., 2002). Using clues gathered from its X-ray luminosity, morphology, spectrum, and likely identification with 3EG J0010+7309, we predict that the spin-down power of the pulsar in RX J0007.0+7303 is in the range ergs s-1.
The upper limit of K that we derive on the effective temperature of the full neutron star surface in CTA 1 is more constraining of cooling models than nearly all other cases. As described by Yakovlev et al. (2002), X-ray observations do not yet require exotic phases of matter such as pion and kaon condensates, or free quarks. However, it is necessary to allow a range of neutron star masses if the measured temperatures and ages are to be accommodated by a single equation of state and theory of superfluid properties (Gusakov et al., 2004). In this sense, the neutron star in CTA 1 is cooler for its age than most others, and similar to Vela and Geminga in requiring a mass . If so, it may become an issue to understand why single neutron stars often have inferred masses greater than the precise values that are measured in binary radio pulsars, which cluster tightly around (Thorsett & Chakrabarty, 1999; Stairs et al., 2002; Lyne et al., 2004; Weisberg & Taylor, 2003). Discussion of that potential problem is beyond the scope of this paper.
Energetic pulsars are being discovered with extremely small radio luminosities; whether this is intrinsic or due to beaming remains unclear. Recent examples include PSR J2229+6114 coincident with 3EG J2227+6122 (Halpern et al., 2001), PSR J1930+1852 in G54.1+0.3 (Lu et al., 2002; Camilo et al., 2002a), PSR J1124–5916 in G292.0+1.8 (Hughes et al., 2001; Camilo et al., 2002b), and PSR J0205+6449 in 3C 58 (Murray et al., 2002; Camilo et al., 2002c). All of these pulsars have ergs s-1 and luminosities at 1400 MHz of mJy kpc2. Such radio luminosities are less than those of of all pulsars, and less than every other pulsar younger than yr (Camilo et al., 2002b). In comparison, the luminosity upper limit for RX J0007.0+7303 is only mJy kpc2, which makes it fainter in the radio than all pulsars except the nearby Geminga and perhaps the putative pulsar powering 3EG J1835+5918 (Mirabal et al., 2000; Mirabal & Halpern, 2001; Halpern et al., 2002). If due to unfavorable orientation with respect to the radio beam, the likely existence of a radio-quiet -ray pulsar in CTA 1 tends to support the outer-gap model, in which the -rays arise from regions far out in the magnetosphere and are emitted into a wide fan beam, illuminating a much larger fraction of the sky than does the narrow radio beam.
References
- Backer et al. (1997) Backer, D. C., Dexter, M. R., Zepka, A., Ng, D., Werthimer, D. J., Ray, P. S., & Foster, R. S. 1997, PASP, 109, 61
- Braje et al. (2002) Braje, T. M., Romani, R. W., Roberts, M. S. E., & Kawai, N. 2002, ApJ, 565, L91
- Brazier et al. (1998) Brazier, K. T. S., Reimer, O., Kanbach, G., & Carramiñana, A. 1998, MNRAS, 295, 819
- Burke et al. (1997) Burke, B. E., Gregory, J., Bautz, M. W., Prigozhin, G. Y., Kissel, S. E., Kosicki, B. N., Loomis, A. H., & Young, D. J. 1997, IEEE Trans. Electron Devices, 44, 1633
- Camilo et al. (2002a) Camilo, F., Lorimer, D. R., Bhat, N. D. R., Gotthelf, E. V., Halpern, J. P., Wang, Q. D., Lu, F. J., & Mirabal, N. 2002a, ApJ, 574, L71
- Camilo et al. (2002b) Camilo, F., Manchester, R. N., Gaensler, B. M., Lorimer, D. R., & Sarkissian, J. 2002b, ApJ, 567, L71
- Camilo et al. (2002c) Camilo, F., et al. 2002c, ApJ, 571, L41
- Caraveo et al. (2003) Caraveo, P. A., Bignami, G. F., DeLuca, A., Mereghetti, S., Pellizzoni, A., Mignani, R., Tur, A., & Becker, W. 2003, Science, 301, 1345
- Cordes & Lazio (2002) Cordes, J. M., & Lazio, T. J. W. 2002, preprint (astro-ph/0207156)
- Gaensler et al. (2002) Gaensler, B. M., Arons, J., Kaspi, V. M., Pivovaroff, M. J., Kawai, N., & Tamura, K. 2002, ApJ, 569, 878
- Gaensler, Pivovaroff, & Garmire (2001) Gaensler, B. M., Pivovaroff, M. J., & Garmire, G. P. 2001, ApJ, 556, L107
- Gotthelf (2003) Gotthelf, E. V. 2003, ApJ, 591, 361
- Gotthelf (2004) Gotthelf, E. V. 2004, in IAU Symp. 218, Young Neutron Stars and their Environment, ed. F. Camilo & B. M. Gaensler (San Francisco: ASP), 000
- Gusakov et al. (2004) Gusakov, M. E., Kaminker, A. D., Yakovlev, D. G., & Gnedin, O. Y. 2004, A&A, submitted (astro-ph/0404002)
- Halpern et al. (2001) Halpern, J. P., Camilo, F., Gotthelf, E. V., Helfand, D. J., Kramer, M., Lyne, A. G., Leighly, K. M., Eracleous, M. 2001, ApJ, 552, L125
- Halpern et al. (2002) Halpern, J. P., Gotthelf, E. V., Mirabal, N., & Camilo. F. 2002, ApJ, 573, L41
- Halpern & Ruderman (1993) Halpern, J. P., & Ruderman, M. 1993, ApJ, 415, 286
- Hartman et al. (1999) Hartman, R. C., et al. 1999, ApJS, 123, 79
- Helfand et al. (2001) Helfand, D. J., Gotthelf, E. V., & Halpern J. P. 2001, ApJ, 556, 380
- Hughes et al. (2001) Hughes, J. P., Slane, P. O., Burrows, D. N., Garmire, G., Nousek, J. A., Olbert, C. M., & Keohane, J. W. 2001, ApJ, 559, L153
- Hessels et al. (2004) Hessels, J. W. T., Roberts, M. S. E., Ransom, S. M., Kaspi, V. M., Romani, R. W., Ng, C.-Y., Freire, P. C. C., & Gaensler, B. M. 2004, ApJ, in press (astro-ph/0403632)
- Jackson et al. (2002) Jackson, M. S., Halpern, J. P., Gotthelf, E. V., & Mattox, J. R. 2002, ApJ, 578, 935
- Kaaret & Cottam (1996) Kaaret, P., & Cottam, J. 1996, ApJ, 462, L1
- Kaminker et al. (2002) Kaminker, A. D., Yakovlev, D. G., & Gnedin, O. Y. 2002, A&A, 383, 1076
- Kargaltsev et al. (2003) Kargaltsev, O., Pavlov, G. G., Teter, M. A., & Sanwal, D. 2003, NewAR, 47, 487
- Landolt (1992) Landolt, A. U. 1992, AJ, 104, 340
- Lorimer et al. (1998) Lorimer, D. R., Lyne, A. G., & Camilo, F. 1998, A&A, 331, 1002
- Lorimer et al. (1995) Lorimer, D. R., Yates, J. A., Lyne, A. G., & Gould, D. M. 1995, MNRAS, 273, 411
- Lu et al. (2002) Lu, F. J., Wang, Q. D., Aschenbach, B., Durochoux, P., & Song, L. M. 2002, ApJ, 568, L49
- Lyne et al. (2004) Lyne, A. G., et al. 2004, Science, 303, 1153
- Mirabal & Halpern (2001) Mirabal, N., & Halpern, J. P. 2001, ApJ, 547, L137
- Mirabal et al. (2000) Mirabal, N., Halpern, J. P., Eracleous, M., & Becker, R. H. 2000, ApJ, 541, 180
- Monet et al. (1998) Monet, D., et al. 1998, USNO-SA2.0 (Washington, DC: US Naval Obs.)
- Murray et al. (2002) Murray, S. S., Slane, P. O., Seward, F. D., Ransom, S. M., & Gaensler, B. M. 2002, ApJ, 568, 226
- Nice & Sayer (1997) Nice, D. J., & Sayer, R. W. 1997, ApJ, 476, 261
- Olbert et al. (2001) Olbert, C. M., Clearfield, C. R., Williams, N. E., Keohane, J. W., & Frail, D. A. 2001, ApJ, 554, L205
- Olbert et al. (2003) Olbert, C. M., Keohane, J. W., Arnaud, K. A., Dyer, K. K., Reynolds, S. P., & Safi-Harb, S. 2003, ApJ, 592, L450
- Page (1998) Page, D. 1998 in The Many Faces of Neutron Stars, ed. R. Buccheri, J. van Paradijs, & M. A. Alpar (Dordrecht: Kluwer), 539
- Page & Applegate (1992) Page, D., & Applegate, J. H. 1992, ApJ, 392, L17
- Page et al. (2004) Page, D., Lattimer, J. M., Prakash, M., & Steiner, A. W. 2004, ApJ, submitted (astro-ph/0403657)
- Pavlov et al. (2001) Pavlov, G. G., Kargaltsev, O. Y., Sanwal, D., & Garmire, G. P. 2001, ApJ, 554, L189
- Pavlov et al. (2003) Pavlov, G. G., Teter, M. A., Kargaltsev, O., & Sanwal, D. 2003, ApJ, 591, 1157
- Pineault et al. (1993) Pineault, S., Landecker, T. L., Madore, B., & Gaumont-Guay, S. 1993, AJ, 105, 1060
- Possenti et al. (2002) Possenti, A., Cerutti, R., Colpi, M., & Mereghetti, S. 2002, A&A, 387, 993
- Predehl & Schmitt (1995) Predehl, P., & Schmitt, J. H. M. M. 1995, A&A, 293, 889
- Ransom (2001) Ransom, S. M. 2001, Ph.D. thesis, Harvard Univ.
- Roberts et al. (2003) Roberts, M. S. E., Tam, C. R., Kaspi, V. M., Lyutikov, M., Vasisht, G., Pivovaroff, M., Gotthelf, E. V., & Kawai, N. 2003, ApJ, 588, 992
- Romani & Yadigaroglu (1995) Romani, R. W., & Yadigaroglu, I.-A. 1995, ApJ, 438, 314
- Schlegel et al. (1998) Schlegel, D. J., Finkbeiner, D. P., & Davis, M. 1998, ApJ, 500, 525
- Seward & Wang (1988) Seward, F. D., & Wang, Z.-R. 1988, ApJ, 332, 199
- Seward et al. (1995) Seward, F. D., Schmidt, B., & Slane, P. 1995, ApJ, 453, 284
- Slane, et al. (2002) Slane, P., Helfand, D. J., & Murray, S. S. 2002, ApJ, 571, L45
- Slane et al. (1997) Slane, P., Seward, F., Bandiera, R., Torii, K., & Tsunemi, H. 1997, ApJ, 485, 221
- Slane et al. (2004) Slane, P., Zimmerman, E. R., Hughes, J. P., Seward, F. D., Gaensler, B. M., & Clarke, M. J. 2004, ApJ, 601, 1045
- Stairs et al. (2002) Stairs, I. H., Thorsett, S. E., Taylor, J. H., & Wolszczan, A. 2002, ApJ, 581, 501
- Taylor & Cordes (1993) Taylor, J. H., & Cordes, J. H. 1993, ApJ, 411, 674
- Thorsett & Chakrabarty (1999) Thorsett, S. E., & Chakrabarty, D. 1999, ApJ, 512, 288
- Tsuruta (1998) Tsuruta, S. 1998, Phys. Rep., 292, 1
- Tsuruta et al. (2002) Tsuruta, S., Teter, M. A., Takatsuka, T., Tatsumi, T., & Tamagaki, R. 2002, ApJ, 571, L143
- Weisberg & Taylor (2003) Weisberg, J. M., & Taylor, J. H. 2003, in ASP Conf. Proc. 302, Radio Pulsars, ed. M. Bailes, D. J. Nice, & S. E. Thorsett (San Francisco: ASP), 93
- Weisskopf et al. (1996) Weisskopf, M. C., O’Dell, S. L., & van Speybroeck, L. P. 1996, Proc. SPIE, 2805, 2
- Weisskopf et al. (2000) Weisskopf, M. C., et al. 2000, ApJ, 536, L81
- Yadigaroglu & Romani (1995) Yadigaroglu, I.-A., & Romani, R. W. 1995, ApJ, 449, 211
- Yadigaroglu & Romani (1997) ———. 1997, ApJ, 476, 347
- Yakovlev & Pethick (2004) Yakovlev, D. G., & Pethick, C. J. 2004, ARA&A, in press (astro-ph/0402143)
- Yakovlev et al. (2002) Yakovlev, D. G., Kaminker, A. D., Haensel, P., & Gnedin, O. Y. 2002, A&A, 389, L24


| ParameteraaUncertainties are 68% confidence for one interesting parameter. | Pulsar | PWN | Jet |
|---|---|---|---|
| Net counts | 187 | 136 | 45 |
| (cm-2) (fixed) | |||
| (photons cm-2 s-1 keV-1)bbPower-law normalization at 1 keV. | |||
| (ergs cm-2 s-1)ccUnabsorbed fluxes and luminosities in the 0.5–10 keV band, assuming kpc. | |||
| (ergs cm-2 s-1)ccUnabsorbed fluxes and luminosities in the 0.5–10 keV band, assuming kpc. | |||
| (keV)ddSpherical blackbody parameters for kpc. | . . . | . . . | |
| (km)ddSpherical blackbody parameters for kpc. | . . . | . . . | |
| (ergs cm-2 s-1)ccUnabsorbed fluxes and luminosities in the 0.5–10 keV band, assuming kpc. | . . . | . . . | |
| (bol) (ergs cm-2 s-1)ddSpherical blackbody parameters for kpc. | . . . | . . . | |
| [dof] | 0.58[6] | 0.68[4] | 0.75[5] |
| Source | X-ray Position | Photons | Optical Position | R.A. | Decl. | ||
|---|---|---|---|---|---|---|---|
| R.A. Decl. | (0.1–10 keV) | R.A. Decl. | (′′) | (′′) | (mag) | (mag) | |
| CXOU J000647.2+730109 | 00 06 47.244 +73 01 09.12 | 15 | 00 06 47.369 +73 01 09.33 | 24.8 | |||
| CXOU J000659.4+730219 | 00 06 59.414 +73 02 19.16 | 23 | 00 06 59.393 +73 02 19.00 | 20.3 | |||
| RX J0007.0+7303 | 00 07 01.537 +73 03 08.17 | 274 | . . . | . . . | . . . | ||
| CXOU J000739.2+730404 | 00 07 39.276 +73 04 04.74 | 36 | 00 07 39.289 +73 04 04.58 | 25.2 | |||
| CXOU J000740.3+730649 | 00 07 40.343 +73 06 49.43 | 176 | 00 07 40.408 +73 06 49.31 | 23.3 | |||
| CXOU J000741.9+730227 | 00 07 41.936 +73 02 27.17 | 158 | 00 07 41.877 +73 02 27.11 | 23.6 |
Note. — Units of right ascension are hours, minutes, and seconds, and units of declination are degrees, arcminutes, and arcseconds.