Mid-infrared selection of AGN ††thanks: Based on observations with the Infrared Space Observatory ISO, an ESA project with instruments funded by ESA Member States (especially the PI countries: France, Germany, the Netherlands and UK) and with the participation of ISAS and NASA, and also based on observations at the South African Astronomical Observatory SAAO.
Since a large fraction of active galactic nuclei (AGN) is missed in common UV-excess surveys and is even hard to find in radio, near-IR and X-ray surveys, we have used a new AGN selection technique which is expected to be not affected by extinction. Within the scientific verification of the ISOCAM Parallel Survey at m we have discovered objects with exceptional mid-infrared (MIR) emission. They are essentially not detected on IRAS-ADDSCANs and only very few of them show up in the NVSS and FIRST radio surveys. Various colour criteria of the m data with 2MASS and optical wavebands show that the sources reach more extreme IR colours than the sources in the Hubble Deep Field-South and the ELAIS survey. The comparison with known object types suggests that we have found AGN with a pronounced MIR emission, probably due to circum-nuclear dust. First results from optical spectroscopy of ten candidates corroborate this interpretation showing four AGN, two reddened LINER and four extremely reddened emission-line galaxies with MIR/FIR flux ratios higher than for known pure starburst galaxies. The results will make a significant contribution to the debate on the entire AGN population.
Key Words.:
Galaxies: fundamental parameters – Galaxies: photometry – Quasars: general – Infrared: galaxies1 Introduction
The realisation that obscuration plays a critical role in the classification of AGN fundamentally inspired the current research. Attempts to overcome the limitations of dust extinction and to identify the entire AGN population – including type 2 and dust-enshrouded AGN – encompass surveys in the near-IR, radio, and X-ray regimes. However, searching for very red AGN the colour selection via (Cutri et al. 2001) excludes most of the known AGN (Barkhouse and Hall 2001), only about 30% of AGN are radio-loud (Urry & Padovani 1995), and there seems to exist many X-ray faint AGN (Wilkes et al. 2002). Thus, a considerable fraction of the AGN population must have escaped detection due to observational bias. Webster et al. (1995) found that their radio-selected quasar sample is significantly redder than an optical comparison sample and concluded that up to 80% of the quasars have been missed in conventional optical surveys, provided that the redder colours of the radio-loud quasars are due to dust reddening and that the radio-quiet quasars contain as much dust as the radio-loud ones. By new strategies in the optical, assuming that the narrow-line regions are sufficiently extended and that only the continuum emission is hidden, type-2 quasar candidates have been selected as objects with narrow permitted emission lines and high [O III]5007 equivalent widths (Djorgovski et al. 2001, Zakamska et al. 2003). Applying a moderate colour cut , from about 1500 sources in 2MASS Francis et al. (2004) find only tentative evidence that Seyfert 2 nuclei are more common in the NIR selected survey than in blue selected galaxy surveys, and they can place only very weak constraints on any population of dusty AGN.
The disadvantage of heavy extinction in optical and NIR surveys can turn into a valuable detection tool, when observing dust-surrounded AGN at MIR wavelengths. There, the reemission of the hiding dust heated by the strong radiation field of the AGN should be seen easily as MIR excess. In fact, for known (powerful) AGN of both type 1 and type 2 a steep near- to mid-IR slope has been revealed by sensitive MIR observations (e.g. Haas et al. 2003, Haas et al. 2004, Siebenmorgen et al. 2004).
We therefore started a new approach, searching for AGN by means of their MIR emission of the nuclear dust torus. However, one complication with this method has to be solved: Since luminous IR starburst galaxies may also show a pronounced MIR emission due to the PAH emission bands around m, it is of special importance to distinguish them from AGN. In this Letter we describe the new technique for the mid-IR selection of AGN candidates using IR colour diagrams and report about first results from optical spectroscopy.
2 Selection of MIR sources
ISO has performed a serendipitous survey at m ( band), the ISOCAM Parallel Survey, with 6 spatial resolution and a positional accuracy of better than 3 (Siebenmorgen et al. 1996, Ott et al. 2003). Over 27 square degrees of the sky are processed and currently being catalogued. For point sources the detection limit is about 0.5 mJy.
Within the scientific verification of the 17000 detected sources (Ott et al. 2004 in prep.) we have selected unresolved sources at galactic latitude . We then performed cross correlations with the 2MASS all sky point source catalogue (Cutri et al. 2003), with the USNO-B, DSS and UCAC optical catalogues, as well as the NVSS and FIRST radio surveys, and analysed IRAS ADDSCANs. We excluded objects which have multiple NIR and optical counterparts within 10, or are contaminated by extended sources (2MASS XSC), or have proper motion ( from UCAC). The resulting list contains about 3000 ISOCAM point sources with and (m) photometry (henceforth denoted ISOCP sources). The brightness ranges are: mag, mag, mag (Vega based system). The typical errors on the and colours are 0.1 0.2 mag and 0.3 0.5 mag, respectively.
3 AGN candidate selection
The ISOCP list contains various object classes like stars, normal and active galaxies. Fig. 1 (top) shows their distribution in the versus colour-colour diagram. Noteworthy, the ISOCP sources clearly reach more extreme IR colours than those of the Hubble Deep Field South (Oliver et al. 2002, Mann et al. 2002) and the ELAIS fields (Väisänen et al. 2002, Rowan-Robinson et al. 2003). The corresponding limits are indicated in Fig. 1.
To identify the types of objects that populate different regions of the colour-colour diagram shown in Fig. 1 (top), we show the same diagram for sources with known identification in Fig. 1 (bottom). Stars, i.e. proper motion objects, lie in the lower left corner at and . This area also contains radio-quiet elliptical galaxies from the revised Shapley-Ames catalog.


UV-excess selected Palomar-Green (PG) quasars (AGN type 1, data from Haas et al. 2003) and powerful FR 2 radio galaxies from the 3CR catalogue (AGN type 2, data from Haas et al. 2004 and Siebenmorgen et al. 2004) lie in the upper right corner at and – a region that is also populated by 3CR quasars (AGN type 1). As an additional check, we cross-correlated the UV-selected quasars in the Véron-Cetty & Véron catalog (2003, 11th edition) with the 2MASS catalog. More than 90% of the quasars with mag and lie at . At the fraction goes down to 10%, probably due to the shift of the NIR excess beyond the -band. The sources from the PG and the 3CR catalogs, respectively, shown in Fig. 1 bottom are at . For simplicity, we denote the sources in the colour range and as excess sources.
The ISOCP excess sources are neither carbon stars (e.g. Liebert et al. 2000) nor AGB stars (Joris Blommaert, priv. comm.), both types showing optical and NIR colours different from these ISOCP sources. Also, dusty young stars show different optical colours and they are not expected at high galactic latitude .
Normal star forming galaxies (Boselli et al. 1998, Dale et al. 2001) populate the full range of , reaching into the regime of AGN, but they lie significantly lower in (), so that they can be distinguished from the PG/3CR AGN. Even IR luminous starburst galaxies having [L, like Arp 157, NGC 1569, NGC 2146, NGC 3256 or M 82, fall into this colour range ().
Seyfert 1 and 2 galaxies, from the sample by Clavel et al. (2001) with averages listed in Tab. 1, lie in the ”transition range” between normal star forming galaxies and PG/3CR AGN. While Sy 2s on average are below , Sy 1s are above and for clarity of the plot only the word ”Seyferts” delineates their colour location in Fig. 1 bottom.
| N | N | |||
|---|---|---|---|---|
| Sy1 (1.8) | 0.59 0.18 | 25 | 2.8 0.6 | 25 |
| Sy2 (1.8) | 0.39 0.18 | 23 | 2.7 0.8 | 23 |
| SBs-ULIRGs | 0.49 0.17 | 21 | 3.9 0.5 | 7 |
| AGN-ULIRGs | 0.94 0.35 | 5 | 3.9 0.4 | 5 |
The colours of IR ultra-luminous (L⊙) starburst galaxies (including LINERs), which we derived from the sample of Klaas et al. (2001) together with 2MASS and ISOCAM 6.7m data, lie in the range and (Tab. 1). 13 of them lie below and 8 above overlapping with the range of the PG/3CR AGN. In Fig. 1 only the word ”SB-ULIRGs” is placed at their mean location. On the other hand, the AGN-ULIRGs with ”warm” colours (like Mrk 231 and IRAS 05189-2524) clearly fall into the colour range of the PG/3CR AGN (Tab. 1).
In following we discuss, whether the ISOCP excess sources could be explained in terms of pure starburst IR galaxies. We will argue that such starforming galaxies would be either too bright or too distant to match both the observed fluxes at , and at 60m and the corresponding colours of the ISOCP excess sources. Our argumentation is essentially based upon the following empirical facts:
-
1.
The ISOCP excess sources have median (mean) fluxes at and of 0.66 mJy (0.9 mJy) and 1.75 mJy (3.2 mJy), respectively.
-
2.
The flux of a starburst galaxy with is mostly due to the PAH bands around 7.7 m (e.g. Laurent et al. 2000). For this feature is shifted out of the passband (m) resulting in a reduced colour below 2.7.
-
3.
If a red () starburst galaxy has a band excess – originating from hot dust close to the sublimation temperature – then its 60 m emission is also expected to be strong. E.g. the five SB-ULIRGs observed by Klaas et al. (2001) with show a flux ratio . Less luminous, more gently star-forming galaxies might have a smaller ratio, but – on the other hand – the typical known SB-LIRGs like M 82 are bluer () than the present ISOCP excess sources.
PAH bands: First, we make use of the PAH bands and discuss the ISOCP excess sources with mJy. In order to match this limit, a typical SB-ULIRG, like e.g. IRAS 17208-0014, with mJy at , would have to lie at . In this case, however, would attain values below 2.7, see point (2.) above. The same argument applies to other SB-ULIRGs (like MRK 273, ARP 220, IRAS 14348-1447 and IRAS 23365+3604). Hence, a pure starburst counterpart of the faint ISOCP excess sources must have a lower luminosity, i.e. being at most an SB-LIRG.
ratio: Second, we make use of the ratio, which attains typically values above 230 for SB-ULIRGs. A similar flux ratio is expected for highly dust-enshrouded SB-LIRGs with (down-sized SB-ULIRGs), if they exist. In order to match mJy for the bright ISOCP sources, the expected flux at 60 m would have to be at least mJy, which is above the IRAS detection threshold at low-cirrus high-galactic latitudes.
For faint ISOCP sources with fluxes 1 mJy we expect useful IRAS upper limits. We have examined the 70 unclassified ISOCP excess sources (Fig. 1, top) individually: only eight of them show a marginal detection in the m IRAS ADDSCAN data, the remaining sources have upper limits between 90 and 190 mJy. Two of the detected sources exhibit 230, all of the remaining sources have 180 and at least 40 of them even have 100. These low limits show that most of the 70 ISOCP sources are characterized by a high MIR/NIR flux ratio, which is not accompanied by a high FIR/MIR ratio as expected for known dust-enshrouded pure starburst galaxies with 0.5.
If the ISOCP excess sources are not a new population of star-forming galaxies, which are highly dust-enshrouded (with red ), rich in PAH emission (with bright FLW2) and have cool FIR colours (with low 60m flux), then the arguments above favour a significant AGN contribution in these sources. Furthermore, the four AGN-ULIRGs show an ratio between 10 and 50, consistent with the 60m upper limits found for the ISOCP excess sources.
Based on the comparison with known object types we predict that most of the 80 ISOCP excess sources house an AGN and have Seyfert luminosities, but could be more powerful if at . Therefore, we consider the ISOCP excess sources as promising AGN candidates. At redshift about , when the AGN-typical SED bump shifts, the colours of the sources may become bluer than , and a refined analysis using other filters has to be applied in order to identify all AGN. Remarkably, the new method is - á priori - not biased against optical-UV selected QSOs. For comparison, the 2MASS AGN search catches only the range (roughly corresponding to the criterion used by Francis et al. 2004), hence may ignore more of the known AGN - even among the local ones.
4 Optical spectroscopy
Obviously, our predictions about the nature of the ISOCP excess sources have to be verified by optical spectroscopy. Ten of our 80 AGN candidates are already listed in the NED as QSOs. None is listed as a star (in SIMBAD) or starburst galaxy. Twelve sources have 1.4 GHz radio detections, 4 being radio loud. Only one source (3C345, Sandage & Wyndham 1965) has also been identified spectroscopically as QSO in the Sloan Survey (SDSS DR1, Abazajian et al. 2003) while SDSS DR2 contains only one more spectrum of an ISOCP excess source (RA,DecJ2000 = 13:25:07.8, +05:41:07) – it is a QSO at = 0.2.
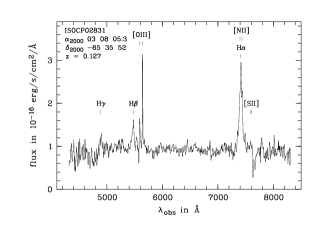
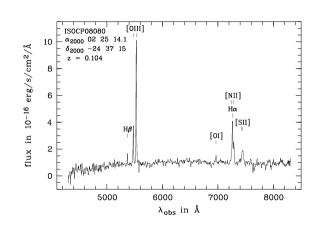
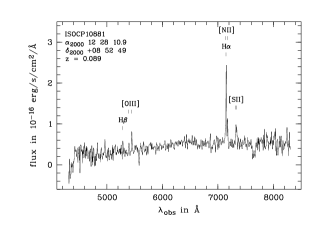
Because of the marginal spectroscopic classification of the ISOCP sources, we have started a spectroscopic survey for the 70 unknown ISOCP excess sources ( and ). First results obtained at the 1.9 m SAAO telescope by end of January 2004 on ten sources confirm their extragalactic nature (Leipski et al. 2004 in prep.). The observations reveal two type-1 AGN and two type-2 AGN, one of which (ISOCP08080, Fig. 2) has a high [O III]5007 luminosity above 108 L⊙ and can be classified as QSO-2. Furthermore, we find two reddened LINER and four extremely reddened emission-line galaxies. Example spectra are given in Fig. 2. The visual extinction of the emission-line galaxies as inferred from the ratio Hα/H is mag; actually is expected to be much stronger when derived from data at longer wavelengths, as found in many dust-enshrouded IR sources (e.g. Haas et al. 2001). The redshift range is . Evidence is growing that LINER galaxies contain an AGN (e.g. Satyapal et al. 2004). Also the four emission-line galaxies may contain an AGN, since their flux ratio 100 is below that found for known pure starburst IR galaxies. Therefore, the ongoing results with a fraction of 40% (4/10) optically identifyable classical AGN are consistent with our prediction that most of the ISOCP excess sources are AGN. Alternatively, we would have to postulate a new population of dust-enshrouded unusually cool star-forming galaxies.
5 Conclusions
We have discovered a sample of unique MIR excess sources. Various arguments suggest that they likely contain an AGN. The ongoing optical spectroscopy indicates 40% of the sample to be classical AGN and the remaining part to be dust-enshrouded sources. They appear enigmatic in terms of having a high MIR/NIR flux ratio, but relatively low FIR upper limits. Since a moderate FIR/MIR flux ratio is more typical for AGN, it argues against pure starbursts. This conjecture has to be confirmed. Because of the high extinction, optical observations might not be able to see the true AGN or starburst or composite nature of those sources. Therefore, future observations with XMM-Newton, the VLA and IR spectroscopy with the Spitzer Space Telescope are planned.
If all 80 ISOCP MIR excess sources turn out to be AGN and if 32 of them (= 40%) are classical AGN which could have been identified also in optical surveys, then the number counts of AGN may increase by a factor of up to 80/32 = 2.5 due to the inclusion of dusty AGN. Clearly, a reliable comparison will have to wait until spectra of more ISOCP sources are obtained.
The emphasis of this letter is on presenting a promising strategy how to find the presumed missing AGN. The selection of MIR excess sources via the and colour-colour diagrams in combination with the low 60m upper flux limits turns out to be efficient in separating starbursts from AGN. It will establish a long sought-after technique for selecting the full population of AGN largely free of extinction.
Acknowledgements.
We thank Michael Strauss and Nadia Zakamska for their constructive and detailed referee report. This research is based on the Data Archives of ISO, 2MASS, USNO-B, UCAC, IRAS, NVSS and FIRST. The NED, SIMBAD and the VisieR Service were used. This work is supported by the Nordrhein-Westfälische Akademie der Wissenschaften, funded by the Federal State and the Federal Republic of Germany. BC thanks the South African National Research Foundation NRF for financial support.References
- (1) Abazajian K., et al. 2003, AJ 126, 2081
- (2) Barkhouse W.A., Hall P.B., 2001, AJ 121, 2843
- (3) Boselli A., Lequeux J., Sauvage M., et al., 1998, A&A 335, 53
- (4) Clavel J., Schulz B., Altieri B., et al., 2001, A&A 357, 839
- (5) Cutri R.M., Nelson B., Kirkpatrick J., et al., 2001, AAS 198, 3317
- (6) Cutri R.M., Skrutskie M.F., van Dyk S., et al., 2003, ”2MASS All-Sky Catalog of Point Sources”, VizieR On-line Data Catalog: II/246
- (7) Dale D.A., Helou G., Contursi A., et al., 2001, ApJ 549, 215
- (8) Djorgovski S., Mahabal A., Brunner R. et al., 2001, ASP Con. 225, 52
- (9) Francis P.J., Nelson B.O., Cutri R.M., 2004, AJ 127, 646
- (10) Haas M., Klaas U., Müller S.A.H., et al., 2001, A&A 367, L9
- (11) Haas M., Klaas U., Müller S.A.H., et al., 2003, A&A 402, 87
- (12) Haas M., Müller S.A.H., Bertoldi F., et al., 2004, A&A submitted
- (13) Klaas U., Haas M., Müller S.A.H., et al., 2001, A&A 379, 823
- (14) Laurent O., Mirabel I.F., Charmandaris V., et al., 2000, A&A 359, 887
- (15) Liebert J., Cutri R.M., Nelson B., et al., 2000 PASP 112, 1315
- (16) Mann R.G., Oliver S., Carballo R., et al., 2002, MNRAS 332, 549
- (17) Oliver S., Mann R.G., Carballo R., et al., 2002, MNRAS 332, 536
- (18) Ott S., Siebenmorgen R., Schartel N., Võ T., 2003, ESA SP-511, 159
- (19) Rowan-Robinson M., Lari C., et al., 2003, astro-ph/0308283
- (20) Sandage A., Wyndham J.D., 1965, ApJ 141, 328
- (21) Satyapal S., Sambruna R., Dudik R.P., 2004, A&A 414, 825
- (22) Siebenmorgen R., Abergel A., Altieri B., et al., 1996, A&A 315, L169
- (23) Siebenmorgen R., Freudling W., Krügel E. et al. 2004, A&A accepted
- (24) Urry C.M., Padovani P., 1995, PASP 107, 803
- (25) Väisänen P., Morel, Rowan-Robinson, et al., 2002, MNRAS 337, 1043
- (26) Véron-Cetty M.P., Véron P., 2003, A&A 412, 399
- (27) Webster R., Francis P., Peterson B., et al., 1995, Nature 375, L469
- (28) Wilkes B.J., Schmidt G.D., Cutri R.M., et al., 2002, ApJ 564, L65
- (29) Zakamska N.L., Strauss M.A., Krolik J.H., et al., 2003, AJ 126, 2125