11email: belloche@mpifr-bonn.mpg.de 22institutetext: LERMA/LRA, Ecole Normale Supérieure, 24 rue Lhomond, F-75231 Paris Cedex 05, France 33institutetext: Service d’Astrophysique, CEA/DSM/DAPNIA, C.E. Saclay, F-91191, Gif-sur-Yvette Cedex, France
33email: pandre@cea.fr
Disappearance of N2H+ from the Gas Phase
in the Class 0 Protostar IRAM 04191††thanks: Based on observations
carried out with the IRAM Plateau de Bure Interferometer. IRAM is
supported by INSU/CNRS (France), MPG (Germany) and IGN (Spain).
We present a high-resolution millimeter study of the very young Class 0 protostar IRAM 04191+1522 in the Taurus molecular cloud. N2H+(1-0) observations with the IRAM Plateau de Bure Interferometer and 30m telescope demonstrate that the molecular ion N2H+ disappears from the gas phase in the inner part of the protostellar envelope ( AU, cm-3). This result departs from the predictions of current chemical models. It suggests either that N2 is more depleted than the models predict, owing to a higher binding energy on polar ice or an enhanced grain chemistry transforming N2 to less volatile species, or that strong deuterium fractionation enhances N2D+ to the detriment of N2H+.
Key Words.:
Stars: formation – circumstellar matter – Stars: individual: IRAM 04191+1522 – ISM: abundances – Astrochemistry – Stars: rotation1 Introduction
Understanding the onset of gravitational collapse in dense cloud cores requires detailed (sub)millimeter studies of the structure of prestellar condensations and young protostars (e.g. André et al. 2000). However, recent observations have shown that molecules such as CO and CS deplete onto grain surfaces in the inner parts of dense cores (e.g. Bacmann et al. 2002; Tafalla et al. 2002). Since this depletion phenomenon is thought to affect many other species at high densities, studying the kinematics of pre/protostellar cores with future high-resolution instruments such as ALMA may be difficult and requires the identification of the best tracers of dense gas. N2H+ has been put forward as such a good tracer since it is much less sensitive to depletion effects than other species observed with single-dish telescopes (e.g. Tafalla et al. 2002), even though Bergin et al. (2002) reported a slight decrease of its abundance toward the prestellar core B68.
Prime targets for observational studies of protostellar collapse are very young Class 0 objects such as IRAM 04191+1522 – hereafter IRAM 04191 for short – in Taurus (see André et al. 1999 – hereafter AMB99). This protostar features a prominent () envelope and a powerful bipolar outflow, but lacks a sizeable accretion disk. Belloche et al. (2002 – hereafter ) showed that the envelope is undergoing both extended infall motions and fast, differential rotation. They proposed that the rapidly rotating inner envelope ( 3500 AU) corresponds to a magnetically supercritical core decoupling from an environment still supported by magnetic fields and strongly affected by magnetic braking.
Here, we report new observations of IRAM 04191 carried out with the Plateau de Bure interferometer (PdBI) in the N2H+(1-0) line in an effort to probe the inner structure of the envelope. We discuss the results of these high-resolution observations which show that N2H+ disappears from the gas phase in the inner part of the envelope.
2 Observations and data reduction
We observed IRAM 04191 with the PdBI for 34 h between December 2001 and September 2002 with 4 to 6 antennas in the C and D configurations. In the 3mm band, each receiver was tuned to the N2H+(101-012) line at 93.176258 GHz in single side-band mode. The system temperatures were typically 110-200 K. The 39 kHz channel spacing resulted in a velocity resolution of 0.20 km s-1 (see Wiesemeyer 2001). The (naturally-weighted) synthesized half-power beam width was (810 AU 560 AU) and the (FWHM) primary beam . Several nearby phase calibrators were observed to determine the time-dependent complex antenna gains. The correlator bandpass was calibrated on the sources 3C84, 0415+379, 3C273, 3C454.3 or NRAO150, while the absolute flux density scale was derived from MWC349 or 3C84. The absolute calibration uncertainty is estimated to be . The data were calibrated and imaged using the GILDAS software (Jan. 2002 release). The deconvolution was performed with the CLEAN method, down to 0.6 times the rms noise level.
The present study also uses single-dish N2H+(1-0) and 1.3mm continuum on-the-fly maps taken with the IRAM 30m telescope (see BADB02 and Motte & André 2001 – hereafter MA01), as well as 1.3mm continuum interferometric data obtained with PdBI in 1999 (see BADB02). The combination of the PdBI and single-dish data was performed in the uv-plane (see Guilloteau 2001). We used a single-dish calibration factor of 5.9 Jy beam-1 K-1 for N2H+(1-0) (Greve et al. 1998). For the continuum data, we applied a calibration factor of 1.35 to account for the difference in observed frequency (227 GHz at PdBI and GHz for bolometer observations at the 30m).
3 Analysis: A drop in N2H+ abundance
3.1 A central hole of N2H+ emission

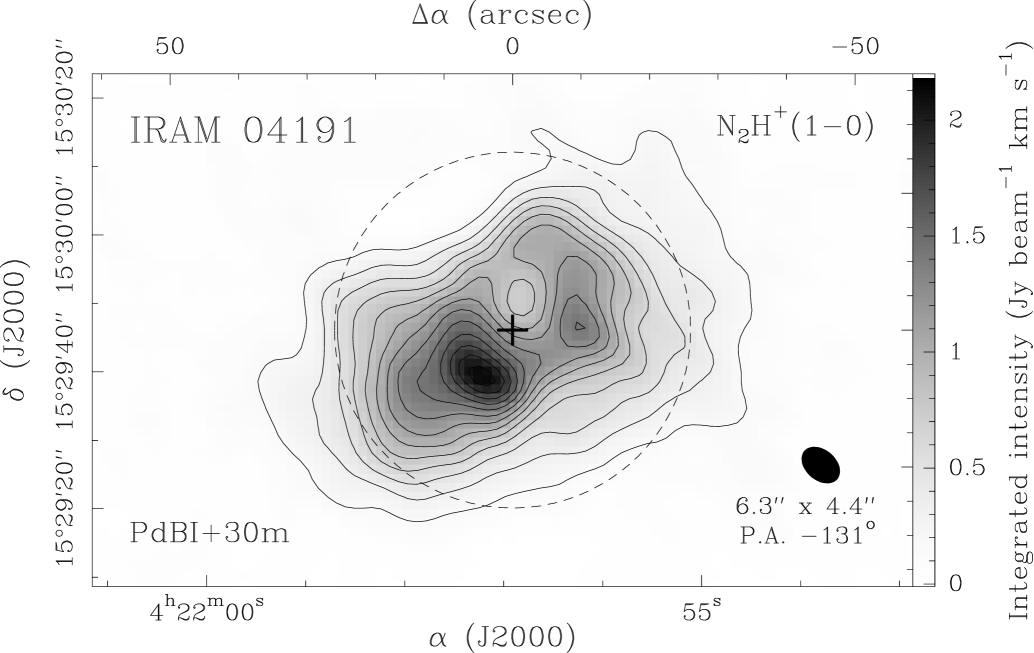
The N2H+(1-0) integrated intensity map obtained with PdBI shows two emission peaks to the South-East and North-West of the central IRAM 04191 position (see Fig. 1). An emission gap with negative contours down to the -15 level is also seen close to the central position, shifted by (i.e., less than one beam width) to the North-West. These three features, which form a structure elongated roughly perpendicular to the outflow axis, have the same relative intensities in each group of hyperfine components of the N2H+(1-0) multiplet. To recover the extended emission filtered out by the interferometer and obtain reliable N2H+ column densities, we combined our PdBI observations with short-spacing data obtained with the 30m telescope (BADB02). The resulting map of N2H+(1-0) integrated intensity reveals a ring-shaped core with two local peaks, surrounding an emission gap near the center (see Fig. 2). This gap is a factor of 3.5 (2.3) weaker than the primary (secondary) emission peak to the South-East (West). The detection of such a gap strongly suggests that the N2H+ abundance decreases toward the center.
3.2 Optical depths and excitation temperatures
We used the hyperfine structure fitting method of the CLASS software to estimate the optical depths and excitation temperatures of N2H+(1-0) in the PdBI-30m combined map. The fits were limited to the spectra with a signal-to-noise ratio larger than 10. We fitted only the 4 () components to avoid convergence problems that occurred for a few positions in the western part of the envelope, and may be related to excitation anomalies (e.g. Turner 2001) and/or low signal-to-noise ratio for the weakest (110-011) component. The 1- optical depth uncertainty given by the fits is typically 15-25 for spectra with opacities larger than 5, and 50-150 for optically-thinner spectra. Except for a few positions at (, ), the total N2H+(1-0) optical depths are lower than 15, and even lower than 10 toward the brightest emission peak and the emission gap, corresponding to optical depths lower than 1.7 and 1.1, respectively, for the isolated (101-012) component. The excitation temperature was found to vary from 4 K to 10 K across the PdBI-30m combined map and to display a maximum toward the brightest emission peak of the integrated intensity map.
3.3 Comparison with the dust emission maps
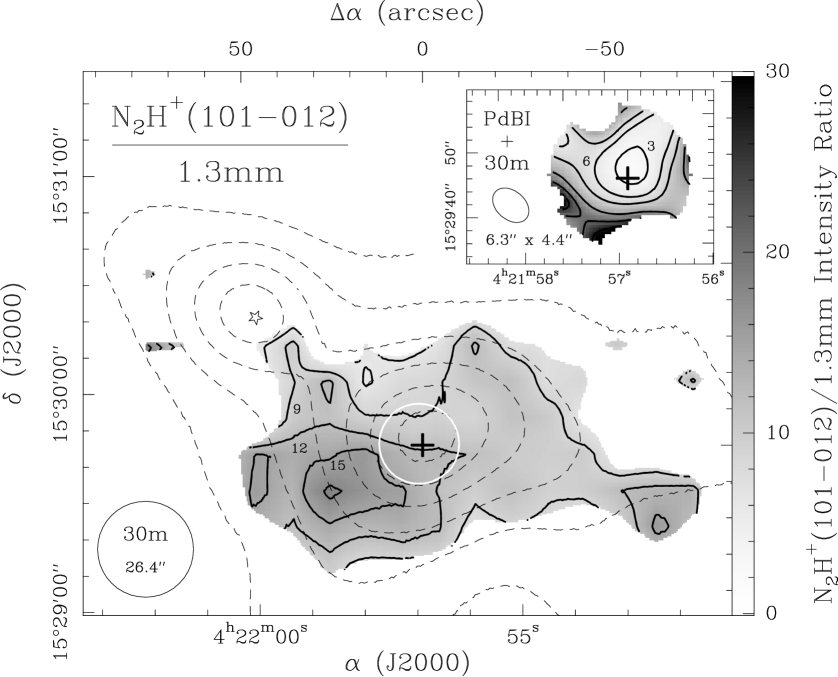
Figure 3 shows the ratio of N2H+(101-012) integrated intensity to 1.3mm continuum intensity across the IRAM 04191 envelope. The large greyscale map was obtained using the single-dish 1.3mm data of MA01 smoothed to the (FWHM) resolution of the 30m telescope at the N2H+(1-0) frequency. The ratio was computed only at positions where both the 1.3mm and N2H+(101-012) intensities were stronger than 4 times the rms noise. The higher-resolution, smaller greyscale map in the insert of Fig. 3 displays the same N2H+(101-012) to dust continuum ratio derived from the PdBI-30m combined data for both the N2H+(101-012) and 1.3mm continuum emission. The PdBI continuum data were recalibrated to the frequency of the 30m continuum data prior to combination (see Sect. 2), and the 1.3mm combined map was smoothed to the resolution of the N2H+(1-0) combined map. The ratio of the two sets of combined data was computed after correction for the respective PdBI primary beam attenuations at 3mm and 1.3mm.
The N2H+(1-0) integrated intensity is expected to primarily track the variations of N2H+ column density (see Fig. 4a). Indeed, N2H+(1-0) is thermalized for cm-3, and the gas/dust temperatures (which are well coupled above this density – Doty & Neufeld 1997) are in the range 6.5–10 K (cf. Fig. 7d of BADB02), i.e., in a regime where the LTE line intensities depend only weakly on temperature. The 1.3mm continuum intensity, on the other hand, should scale as the H2 column density times the dust temperature times the dust opacity (see, e.g., Eq. 1 of Motte et al. 1998). The bolometric luminosity of IRAM 04191 is so low ( – see AMB99) that the dust temperature is expected to vary by less than in the range of radii 400–2800 AU (see BADB02). The variations of the intensity ratio in the central AU () region around IRAM 04191 should thus reflect the variations of the N2H+ abundance, to within a factor of if we account for a possible slight saturation of N2H+(101-012) (, see Sect. 3.2) and possible changes in the dust opacity.
The intensity ratio has an average value of Jy beam-1 km s-1/(Jy beam-1) in the central () region of the single-dish map, and drops to a minimum of 2.7 Jy beam-1 km s-1/(Jy beam-1) near the center of the high-resolution map. We conclude that the N2H+ abundance averaged along the line of sight decreases by a factor of from to .
3.4 Disappearance of N2H+ from the gas phase

The map of N2H+ column density shown in Fig. 4a was computed using a LTE partition function at the N2H+(1-0) excitation temperature derived from the hfs fits, assumed to be uniform along each line of sight. We also applied an optical depth correction of using the hfs fit results. Figure 4b compares the circularly-averaged radial profile of N2H+ column density with the H2 column density profile derived from the dust emission (MA01). The former clearly departs from the latter for . A good model fit is obtained when one assumes a hole of N2H+ material in the central part of the envelope ( 1350-1850 AU, see dashed curves). This comparison strongly suggests that the N2H+ ion disappears from the gas phase above a density of cm-3 in the IRAM 04191 envelope, according to the density profile derived by MA01 (see Fig. 7a of BADB02). We derive a mean N2H+ abundance of at AU.
3.5 Fast, differential rotation
We measure a large velocity difference of km s-1 between the two N2H+(1-0) emission peaks of the PdBI map shown in Fig.1, largely exceeding the FWHM linewidths measured toward the peaks themselves ( km s-1). A least-square linear fit to the LSR-velocity map of the PdBI-30m combined data yields a mean velocity gradient of km s-1pc-1 with a position angle of P.A. . This small-scale gradient has a direction consistent with the direction of the mean velocity gradient measured on larger scale with the 30m telescope by BADB02, but is 5 times larger. The PdBI results thus confirm and strengthen the presence of fast, differential rotation identified by BADB02. The detailed form of the rotation velocity profile, which is confirmed to have a break at AU (see Fig. 12 of BADB02), will be discussed in a forthcoming paper based on radiative transfer simulations taking the N2H+ depletion into account.
4 Implications
We showed in Sect. 3.4 that the molecular ion N2H+ disappears from the gas phase above a density of cm-3 in the envelope of the Class 0 protostar IRAM 04191. This conclusion is at variance with the results of recent chemical models (e.g. Shematovich et al. 2003; Aikawa et al. 2003). In particular, the models calculated by Aikawa et al. (2003) including gas-phase reactions, gas-dust interactions, and diffusive grain-surface reactions predict an increase in the N2H+ abundance during the prestellar collapse phase up to a density of cm-3 or more. IRAM 04191 is so young, probably less than yr since the formation of the central object (AMB99), that it is difficult to invoke a large decrease in the N2H+ abundance on such a short timescale at the beginning of the main accretion phase.
Since CO is one of the main destroyers of N2H+ in the gas phase (e.g. Aikawa et al. 2001), its potential desorption from grain mantles due to heating by the central protostar could be a mechanism responsible for the disappearance of N2H+ from the gas phase. However, the luminosity of IRAM 04191 is so low (see Sect. 3.3) that it is insufficient to raise the dust temperature above 11 K for AU (J. Bouwman 2003, private communication). Comparing the C18O(2-1) data of BADB02 with the 1.3mm continuum map of MA01, we measure a reduction of the C18O abundance (averaged along the line of sight) by a factor of toward the center of the envelope, assuming an optically thin C18O line111Using our C17(1-0), C18(1-0) and C18(2-1) data, we estimate the C18(2-1) optical depth to be 0.7-1 toward IRAM 04191.. There is thus no evidence for any C18O (and thus CO) desorption from the dust grains in the inner envelope at the 30m resolution (800 AU in radius). This indicates that potential CO desorption due to shocks produced by the outflow does not dominate in the central beam. Although the overall morphology seen in Figs. 2 and 4a suggests that the N2H+ abundance may reach a minimum along the outflow path, the outflow is sufficiently well collimated (cf. Fig. 1 of AMB99) that its effect should be negligible in the equatorial plane of the envelope.
We suggest two other possible explanations for the disappearance of
N2H+ in the IRAM 04191 envelope:
1) N2 may condense onto the grain surfaces. This could be either
due to a higher N2 binding energy on polar ice mantles than the value of
750 K usually adopted (see Model C of Aikawa et al. 2001; Bergin et al. 2002), or to an
enhanced grain chemistry transforming N2 into less volatile species
(Y. Aikawa 2003, private communication).
Such a strong N2 depletion was suggested by
Caselli et al. (2003) to account for the high H2D+ abundance measured in
L1544.
2) Deuterium fractionation may enhance N2D+ over N2H+. A
high-degree of deuterium fractionation has indeed been observed in dense
cores (e.g. Turner 2001; Bacmann et al. 2003), and Roberts et al. (2003) predict
that the N2D+/N2H+ abundance ratio should even exceed 1
at densities of cm-3 when they include HD and D
in their chemical model. N2D+ may thus be a better tracer
of dense gas than N2H+.
The disappearance of N2H+ from the gas phase suggests that all species bearing heavy elements also vanish at high density in prestellar cores. However, Walmsley et al. (2004) find that, under such conditions, the ionization degree of the gas is not significantly changed owing to the enhanced abundances of H+, H, and D. Moreover, they argue that the ambipolar diffusion timescale is dominated by the coupling of the neutrals to the charged grains at these densities. The dynamics of protostellar collapse may thus be essentially unaffected by the strong molecular depletion in prestellar cores.
Acknowledgements.
We would like to thank Y. Aikawa, M. Gerin, G. Pineau des Forêts and M. Walmsley for enlightening discussions about the chemistry. We are grateful to F. Gueth, J. Pety and R. Neri (IRAM) for their help with the Plateau de Bure observations. We would also like to thank F. Motte for her advice about the continuum data.References
- Aikawa et al. (2001) Aikawa, Y., Ohashi, N., Inutsuka, S.I., Herbst, E., & Takakuwa, S. 2001, ApJ, 552, 639
- Aikawa, Ohashi & Herbst (2003) Aikawa, Y., Ohashi, N., & Herbst, E. 2003, ApJ, 593, 906
- André et al. (1999) André, P., Motte, F., & Bacmann, A. 1999, ApJ, 513, L57 (AMB99)
- André, Ward-Thompson & Barsony (2000) André, P., Ward-Thompson, D., & Barsony, M. 2000, in Protostars and Planets IV, ed. V. Mannings, A.P. Boss, & S.S. Russell (Univ. of Arizona Press, Tucson), p. 59
- Bacmann et al. (2002) Bacmann, A., Lefloch, B., Ceccarelli, C., Castets, A., Steinacker, J., & Loinard, L. 2002, A&A, 389, L6
- Bacmann et al. (2003) Bacmann, A., Lefloch, B., Ceccarelli, C., Steinacker, J., Castets, A., & Loinard, L. 2003, ApJ, 585, L55
- Belloche et al. (2002) Belloche, A., André, P., Despois, D., & Blinder, S. 2002, A&A, 393, 927 (BADB02)
- Bergin et al. (2002) Bergin, E.A., Alves, J., Huard, T., & Lada, C.J. 2002, ApJ, 570, L101
- Caselli et al. (2003) Caselli, P., van der Tak, F.F.S., Ceccarelli, C., & Bacmann, A. 2003, A&A, 403, L37
- Doty & Neufeld (1997) Doty, S.D., & Neufeld, D.A. 1997, ApJ, 489, 122
- Greve, Kramer & Wild (1998) Greve, A., Kramer, C., & Wild, W. 1998, A&AS, 133, 271
- Guilloteau (2001) Guilloteau, S., 2001, in Proceedings from the IRAM Millimeter Summer School 2, ed. A. Dutrey, p. 219
- Motte & André (2001) Motte, F., & André, P. 2001, A&A, 365, 440 (MA01)
- Motte, André & Neri (1998) Motte, F., André, P., & Neri, R. 1998, A&A, 336, 150
- Roberts et al. (2003) Roberts, H., Herbst, E., & Millar, T.J. 2003, ApJ, 591, L41
- Shematovich et al. (2003) Shematovich, V.I., Wiebe, D.S., Shustov, B.M., & Li, Z.Y. 2003, ApJ, 588, 894
- Tafalla et al. (2002) Tafalla, M., Myers, P.C., Caselli, P., Walmsley, C.M., & Comito, C. 2002, ApJ, 569, 815
- Turner (2001) Turner, B.E. 2001, ApJS, 136, 579
- Walmsley, Flower & Pineau des Forêts (2004) Walmsley, C.M., Flower, D.R., & Pineau des Forêts, G. 2004, A&A, in press [astro-ph/0402493]
- Wiesemeyer (2001) Wiesemeyer, H. 2001, in Proceedings from the IRAM Millimeter Summer School 2, ed. A. Dutrey, p. 71