Accretion stream mapping with genetically modified ‘fire-flies’
Abstract
We apply an eclipse mapping technique using ‘genetically modified fire-flies’ to the eclipse light curves of HU Aqr and EP Dra. The technique makes as few assumptions as possible about the location of accretion stream material, allowing the emission to be located anywhere within the Roche lobe of the white dwarf. We model two consecutive eclipses in the -band for HU Aqr, and four consecutive ‘white’-light eclipses for EP Dra, to determine the changing brightness distribution of stream material. We find fire-fly distributions which are consistent with accretion through a curtain of material in both HU Aqr and EP Dra, and show that the previously assumed two part ballistic and magnetic trajectory is a good approximation for polars. Model fits to the colour band data of HU Aqr indicate that the material confined to the magnetic field lines is brightest, and most of the emission originates from close to the white dwarf. There is evidence for emission from close to a calculated ballistic stream in both HU Aqr and EP Dra.We propose that a change in the stream density causes a change in the location of the bright material in the accretion stream in EP Dra.
keywords:
accretion, – binaries: eclipsing – stars: individual: HU Aqr – stars: individual: EP Dra1 Introduction
AM Hers, or polars, are a sub-class of the magnetic cataclysmic variable (CV) interacting binaries. A main sequence secondary transfers material to a white dwarf primary through an accretion stream, from mass overflow at the inner Lagrangian point (). The primary has a magnetic field of order 10200 MG, which prevents the formation of an accretion disk (as found in other types of cataclysmic variables), and instead, at some threading radius from the primary, the material is confined to follow the magnetic field lines to accrete directly onto the white dwarf surface (see Cropper 1990 for a review). A number of these systems have inclinations to the line of sight such that the system is eclipsed by the secondary, and this can be used as a means of isolating the emission from discrete parts of the system. In particular the brightness distribution of material along the accretion stream can be inferred as successive sections of the accretion stream material are eclipsed.
Attempts to determine the brightness distribution of the accretion stream material has evolved in complexity from initially one-dimensional streams confined to the orbital plane (Hakala 1995), to three dimensional tubes carrying material far out of the orbital plane (Kube, Gänsicke & Beuermann 2000; Vrielmann & Schwope 2001). These methods have been applied to both emission line (Kube, Gänsicke & Beuermann 2000; Vrielmann & Schwope 2001) and continuum observations (Hakala 1995; Harrop-Allin et al. 1999b, 2001; Bridge et al. 2002). The assumption common to all previous model techniques is that of a stream trajectory determined prior to the modelling process, and fixed for the duration of the model. In an attempt to remove as many of the assumptions about the stream location as possible, a technique has been developed by Hakala, Cropper & Ramsay (2002), which makes fewer assumptions about the location of bright stream material. In principle, stream material can be located anywhere within the Roche lobe of the primary.
The application of the technique to synthetic data sets was demonstrated in Hakala et al. (2002), and here we apply the method to optical light curves of two eclipsing polars: EP Dra and HU Aqr. The two systems show variations in the brightness and trajectory of the accretion stream over the timescale of the orbital period (Bridge et al. 2002, 2003), with EP Dra also showing a variation in brightness over a longer phase range. This variation appears to be related to the brightness of the accretion stream, and is attributed to a combination of cyclotron beaming and absorption in an extended accretion curtain (Bridge et al. 2002, 2003).
The eclipse mapping technique based on the model of Harrop-Allin et al. (1999a) was found (by Bridge et al. 2002) to be particularly sensitive to the input parameters and the signal-to-noise ratio of the data used, when applied to the selected light curves of HU Aqr, and hence restricted the interpretation of the results. We therefore apply this new model technique to the EP Dra and HU Aqr light curves in an attempt to circumvent these limitations.
2 Data sets
| Cycle | Eclipse centre | Observation | |
|---|---|---|---|
| number | (TDB) | length (s) | |
| (2450000.0+) | |||
| EP Dra | 56962 | 1820.37575 | 1496 |
| 56976 | 1821.39294 | 2400 | |
| 56977 | 1821.46559 | 2111 | |
| 56978 | 1821.53825 | 1393 | |
| HU Aqr | 29994 | 1821.43744 | 2400 |
| 29995 | 1821.52426 | 1216 |
Light curves of EP Dra and HU Aqr were obtained on the nights of 2000 October 2/3 and 2000 October 3/4. The observations were taken using the superconducting tunnel junction instrument S-Cam 2 (see Perryman et al. 2001 and reference therein). S-Cam 2 provides spectral information through the ability to record the energy of each incident photon, as well as the time of arrival and position on the detector array. The HU Aqr light curves presented in Bridge et al. (2002) have now been split into energy ranges that more closely resemble those of the Johnson-Cousins UBVRc-bands (Bessell 1990, and references therein), as for EP Dra and detailed in Bridge et al. (2003). The -band represents the range 340400 nm, the -band is 390490 nm, the -band is 500600 nm and the -band is 590680 nm. Table 1 gives the cycle number, start time (TDB) and total observation length for those light curves used in the modelling presented here. EP Dra was too faint to provide high enough signal-to-noise ratio light curves when divided into -band energy ranges (V17 for EP Dra compared to V15 for HU Aqr), therefore we use the ‘white’-light curves (340680 nm).
The effect of low signal-to-noise ratio data on the fits is that the fire-fly swarm is broadened. In light of these considerations, we have chosen cycles 29994 and 29995 of HU Aqr as having the best signal-to-noise ratio and sufficient phase range, and cycles 56962, 56976, 56977 and 56878 from EP Dra. The choice of consecutive orbits of light curves means that we can compare the changing brightness and eclipse profile of the accretion stream in consecutive eclipses. The observed light curves were binned into 4 s time bins. This is to reduce the computational time required for the model. The EP Dra light curves have been truncated compared to those presented in Bridge et al. (2003), to cover the eclipse phases only, and hence the ‘trough’ feature identified in the longer phase coverage light curves is not evident.
3 The Model
3.1 Overview
The model is described in detail in Hakala et al. (2002), so we provide only a brief description here. The model uses a number of bright emission points, dubbed ‘fire-flies’, that are free to move within the Roche lobe of the primary. Each fire-fly has an angle-dependent emission, given by , where is the minimum brightness of a fire-fly, is the amplitude of angular dependence and is the angle between the primary, the fire-fly and the observer. This angular dependence was included for two reasons: firstly to account for the effect of X-ray heating of the side of the accretion stream facing the primary, and secondly to mimic the effect of the optical thickness of the stream near the eclipse phases. The model evolves a best fit light curve and hence fire-fly distribution, by summing the brightness of the fire-flies visible at each phase of the light curve.
The model creates a number of initially random fire-fly ‘swarms’, and each of these swarms is used to create a model light curve. The swarms are then evolved towards a final solution using a genetic algorithm (GA; see Charbonneau 1995 for a review) which evaluates the goodness of fit of each model light curve, and uses the swarms of fire-flies corresponding to the best fitting light curves to create the next generation of fire-fly swarms. This process is repeated until the model converges, or a pre-set number of generations has passed.
The location of the fire-flies defines an emission volume, and so the precise location of an individual fire-fly within that volume is not necessarily important or unique. The bright sections of stream are seen as a larger number of fire-flies concentrated in a smaller volume.
3.2 Evaluation of the fit
The goodness-of-fit of a particular model light curve is a combination of the -fit of the fire-fly generated model light curve to the observed light curve, plus an optional regularisation term derived from a self-organising map (SOM; Kohonen 1990). The SOM places a curve through a given swarm, with ends located near the primary and . The fire-flies are constrained to prefer to lie at minimal distance from this curve, and hence those swarms that follow the shape of the curve more closely have correspondingly better fitness functions. The details of the application of a SOM to the fire-fly model are given in Hakala et al. (2002). They did not specifically explore the effects of two important parameters in the regularisation, that of the neighbourhood kernel width and the number of nodes (or sections) in the curve. As we now apply this technique to ‘real’ data for the first time, we briefly explore the effects of varying these two parameters.

For a test dataset, we have chosen the ‘white’-light curve of HU Aqr cycle 29995 (Bridge et al. 2002), and apply the same input parameters to the model, varying either the kernel width or the number of nodes. Fig. 1 shows the resulting regularisation curves. To create a best-fit curve through a particular fire-fly swarm, the model selects a random fire-fly and finds the nearest node, this node is then moved towards the fire-fly. Each adjacent node in the curve is also moved; however the amplitude of the movement is reduced for each subsequent node. The amount by which the movement is reduced is set by the kernel width. For each swarm this process of moving the nodes is repeated for around 1020 times the number of fire-flies in the swarm. The use of a large kernel width will propagate larger amplitude movements further along the curve, leading to a smoother, or ‘stiffer’, curve. The number of nodes has a similar effect: a large number of nodes leads to localised turns in the curve as the amplitude of the node movement decreases in a relatively short distance along the stream. In general, the ratio of the number of nodes to the kernel width affects the strength of the regularisation by altering the stiffness of the regularisation curve.
The regularisation curve is a constraint on the fire-fly distribution, and the form of the curve is important as it can impose preconceived ideas of a stream trajectory on to the fire-fly swarms. The choice of the most appropriate values for the kernel width and the number of nodes is set by the need to allow the model to create a stream that is sufficiently stiff as to reproduce a ‘physically realistic’ accretion stream, but not too stiff as to overly constrain the evolution of the fire-fly distributions. The effect of the regularisation can be significant in shaping the fire-fly swarm, as can be seen from Fig. 1. This will influence the model results and their interpretation. However, we can make progress towards an optimal means of regularisation by excluding the more extreme regularisation parameters, such as that found for small kernel widths or large numbers of nodes. With this in mind, we have chosen to use 20 for the number of nodes and 5.0 for the neighbourhood kernel width, as in the middle plots of Fig. 1. These are the same as those used by Hakala et al. (2002) for their fits to synthetic data. When interpreting the results in Section 4 the choice of kernel width and node number, and the possible influence on the interpretation of the resulting fire-fly distributions, must be borne in mind.
3.3 Fixed parameters
A number of fixed parameters are used in the model. These include parameters describing the binary system, such as the mass ratio and binary inclination, and parameters such as the number of swarms, number of fire-flies per swarm and the brightness dependence of the fire-flies. The number of fire-flies and swarms chosen must reflect the need to introduce enough diversity into the population to explore the whole parameter space and reach a unique solution, while the number of iterations must be sufficient to reach convergence. In practice, the number of iterations is also constrained by the computational time required for a model fit.
Several of the parameters can potentially be determined using the model fitting itself. The inclination and the brightness dependence of the fire-flies, which affects , can be varied to determine the best value from the fitness function. This was demonstrated in Hakala et al. (2002) for synthetic data sets, and here we apply it to observed light curves (see Section 4.1). The brightness dependence is varied through the user input value of the emissivity ratio . This defines the brightness of the directly opposing faces of the fire-fly – i.e. the brightness of the fire-fly in the direction facing the primary, compared to that facing directly away from the primary. A third parameter is used to mimic the effects of the accretion region on the primary: the value for the brightness of the accretion region is fixed at the ingress, and then, using a ‘pole trend’ parameter, the angular dependence of the emission from this region is accounted for by increasing this value linearly with phase to match the egress brightness. In those observations covering a small phase range this was found to have little effect, as the model effectively uses fire-flies to compensate for an inappropriate brightness at the accretion region. However it is important for HU Aqr cycle 29994 which has a longer egress phase range (see Section 4.2). The pole trend cannot, of course, account for flaring seen in the longer egress light curves.
4 Results


4.1 Constraining system parameters
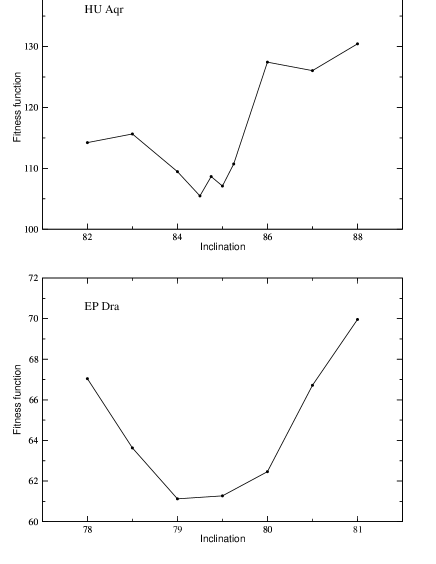
We can constrain the binary inclination using the fire-fly model fits. Fig. 2 shows the fitness function for a range of values of for EP Dra cycle 56976 and the -band of HU Aqr cycle 29995. Fig. 2 indicates a value of for EP Dra and we use for subsequent modelling. This value is in good agreement with the value of derived by Remillard et al. (1991) from their observed eclipse duration. For HU Aqr we used a value of which is in good agreement with the value from Schwope et al. (2001) of .
Constraints can be placed on the values of also, and we find here that the values are constrained within approximately of the optimal value. The value of is also linked to the value of the pole trend. A decrease in the value of means that the fire-flies are brighter on the side facing the white dwarf, seen after eclipse on accretion stream egress. This is also when the model is providing the most contribution to the cyclotron emission through the pole trend parameter. The phase dependence of the emission from the fire-flies therefore implies that this parameter will most likely play a more important role in long phase range light curves, as suggested by Hakala et al. (2002).
4.2 HU Aqr
The results of the fire-fly modelling for cycles 29994 and 29995 of HU Aqr are shown in Figs. 3 and 4 respectively. The left-hand panel shows the distribution of fire-flies, and the right-hand panel the corresponding model fits to the observed light curves. The white dwarf is located at the origin. A large concentration of fire-flies indicates a bright region. The dotted straight lines in the left-most panels of Figs. 3 and 4 define the regions of the system seen from the first to last phases in the light curves. The shaded area is therefore never seen, and thus any fire-flies in this region make no contribution to the model fits and are excluded from the plot. Those fire-flies that are seen on both ingress and egress are shown as filled circles, while those seen either on ingress or egress alone are represented as hollow circles. The high value of means that the fit is constrained mainly in the orbital (x-y) plane and less so in the x-z plane. We do not include a plot of the x-z plane fire-fly distribution for this reason.
The phase range of the observed light curve for cycle 29994 is longer on egress than that for cycle 29995, which means that the pole trend is more important for this cycle. The -band fit of cycle 29995 does require a higher value of the pole trend than the -band fits. The shorter egress in cycle 29995 means that changing the value of has no effect, and the same value of is therefore used for all four bands. (This means that the fire-flies are 5 times brighter facing the primary, than when facing away.) For cycle 29994 the value is different in the different bands because of the greater influence of the cyclotron emission on the model fits after the egress of the accretion region. The values for the -bands were 0.25, 0.2, 0.3 and 0.2 respectively.
In Fig. 3 there is a concentration of fire-flies close to the white dwarf, and there are also a number of fire-flies defining the trajectory of material from to the white dwarf. However, most of the fire-flies are located in the region where we expect the material to be channeled by the magnetic field lines of the white dwarf. The increased number of fire-flies along the indicated ballistic trajectory in the -band and -band compared to the -band and the -band appears to be a result of the increase in the model light curve around . This increase coincides with the large increase in the observed light curve centred on . Fig 4 indicates that for cycle 29995, most of the emission comes from the region close to the primary and nearly all the fire-flies are located where we expect the material to be threaded onto the magnetic field lines of the primary.
The differences between the bands for HU Aqr cycle 29994 are noticeable in the ballistic stream. There are more fire-flies closer to in the -band and -band, and more in the region where we expect material to be coupled to the magnetic field lines in the -band and -band. There is little emission from a ballistic trajectory in all the bands of cycle 29995, and there are few -band and -band fire-flies close to the calculated ballistic trajectory in cycle 29995. Instead the fire-flies are located in the region where we expect material to be coupled to the magnetic field lines. Further to this, in the case of the -band and -band, the fire-flies are even closer to the primary and would be expected to have been lifted further out of the orbital plane along the magnetic field lines.
A lack of material near the indicated ballistic trajectory in cycle 29995 is either because there is a lack of material actually located in this region, or that it is significantly fainter compared to the material located near the white dwarf. In this case the model will preferentially place the fire-flies in the brighter region. The fact that a constant is used for the different bands means also, that any small variations in the cyclotron emission will be compensated for by the model using fire-flies at the white dwarf to mimic the smaller variations.
Model fits to synthetic data created from a given fire-fly distribution have been shown in Hakala et al. (2002) to reproduce the original breadth of the accretion material well. We therefore expect the broad accretion stream indicated in the fire-fly distributions to reflect the true location of stream material. That this broad width of material is located where we expect it to be confined to the magnetic field lines implies that the material is threaded on to many different field lines towards the calculated ballistic trajectory (indicated by a solid line in the figures). The distributions in the different bands are similar for both cycles; however there are more fire-flies defining the early sections of the stream trajectory in cycle 29994. The fire-flies in the -band of cycle 29995 trace a swarm that appears to originate from the calculated ballistic trajectory.
4.3 EP Dra
The fits for EP Dra are shown in Fig. 5. We show four eclipses, one from the first night and three consecutive eclipses from the second night. The fire-fly distributions in Fig. 5 show emission located close to a calculated ballistic trajectory, in cycles 56962 and 56976 with the consequence that there is a larger relative decrease in the light curve prior to the accretion region and white dwarf ingress than cycles 56976 and 56977. This is seen in the fire-fly distributions as a larger number of fire-flies located close to the calculated ballistic trajectory. In cycle 56978 the rapid decrease in flux prior to the rapid eclipse of the accretion region and white dwarf indicates that material is located towards the ends of the trajectory, that is close to the white dwarf and . As the model reaches total eclipse earlier in phase compared to the preceding two cycles, there is evidently no material located far from the line-of-centres towards the calculated ballistic trajectory, the model places the fire-flies along the line joining to the white dwarf. The possibility exists that the accretion stream material is threaded at and the cycle 56978 fire-fly distribution indicates that this may be the case, however it is considered unlikely.
The fire-fly distribution in cycle 56978 is expected to be very different from that of the preceding two cycles as the light curves are very different. The fire-flies indicate that the brightest region is close to the white dwarf, with material along the line-of-centres. This is seen in the light curves as a gradual decrease in emission prior to the eclipse of the accretion region, and a relatively faint stream after this eclipse, when compared to the previous cycles. The increased brightness near the white dwarf in this cycle may also be compensation for a larger difference in the brightness between the ingress and egress levels of the light curve, due to a change in the cyclotron emission.
The distribution of fire-flies for cycles 56976 and 56977 show that there is material located in a relatively large region towards the end of the calculated ballistic accretion stream. This region is located closer to the primary than for the HU Aqr fire-flies, which is indicative of either a weaker magnetic field or a higher mass transfer rate. A weaker magnetic field explanation is consistent with the derived field strengths for HU Aqr of MG (Glenn et al. 1994) and EP Dra of MG (Schwope & Mengel 1997).
The distribution of fire-flies in the z-direction is better constrained for EP Dra than HU Aqr, because of the lower inclination of . However, the appearance of fire-flies below the orbital plane may be indicative of a lack of constraint in the z-direction. The extent of the fly distribution in the z-direction towards the white dwarf in all cycles possibly indicates accretion at locations nearer the equator on the primary (larger colatitude ) as the material does not have far to travel along the magnetic field lines.
5 Discussion
Our results show that the previously assumed two part ballistic plus magnetic trajectory is a good approximation to the flows delineated by the fire-fly distributions.
5.1 Changing stream brightness
Together, the three EP Dra eclipses from the second night (56976, 56977 and 56978) show a change in the location of bright material, which is related to a change in the observed eclipse profile, and thus a change in the brightness of the accretion stream material. This change is not necessarily directly indicative of a change in the temperature of this material as the brightness of stream material is directly dependent upon both the density and temperature structure of the stream.
The change in brightness of the ballistic section of the accretion stream between cycle 56976 and 56977 can be explained if material is stripped from the ballistic stream in many places along the ballistic trajectory. This material is channeled onto the magnetic field lines of the white dwarf, resulting in a decrease in the amount of material in, and hence brightness of, the ballistic stream. We do not necessarily see this material defined by the fire-flies because it is fainter than the region where most of the material is coupled to the magnetic field lines. As this coupled material reaches the white dwarf there is an increase in the emission from this region of the system, as in cycle 56978. Alternatively, the change in brightness may be caused by a change in the rate of loss of material from the secondary resulting in a change in the amount of material along the ballistic section of the stream. The time-scale for material to travel from to the white dwarf is 50 minutes, half the orbital period. Therefore, changes in the amount of material along the accretion stream are possible between consecutive cycles.
5.2 Stream heating
The distribution of fire-flies in the different bands for HU Aqr is indicative of stream heating processes in both a coupling region and near the white dwarf. This was found in Bridge et al. (2002) for HU Aqr, and is predicted by the theoretical models of Ferrario & Wehrse (1999). The location of the bluer fire-flies further from the primary in the -band of cycle 29995 is indicative of irradiated stream material. The accretion stream will be strongly irradiated by X-ray emission as it reaches the threading region and rises from the orbital plane along the magnetic field lines. This material is located further away from the white dwarf by the model, where the observed emission is brightest. Alternatively, the bright -band emission may indicate that the material is heated by processes in the magnetic coupling region.
5.3 Comparison with previous results
The HU Aqr fire-fly distributions are consistent with the location of the bright regions in the modelling of Bridge et al. (2002) and Harrop-Allin (1999), which show variations in the brightness of the threading region and regions near the white dwarf. The one-pole accretion models of Harrop-Allin (1999) show that the magnetically confined regions of the accretion stream are the brightest, with the -band and -band emission being greatest towards the threading region. In particular the brightness distribution resembles the fire-fly distributions of cycle 29994 with emission from the ballistic part of the stream.
The threading region has been observed to move significantly between cycles (Glenn et al. 1994; Bridge et al. 2002). The fire-flies will not necessarily indicate a movement unless it is significantly larger than the width of the fire-fly swarm. Bridge et al. (2002) found a change in the threading radius between the two cycles modelled there, however the HU Aqr cycle 29994 modelled here was not included and in fact represents the intermediate cycle. Figure 5 of Bridge et al. (2002) shows the superimposed eclipse profiles of the HU Aqr cycles observed on the same nights. The figure indicates that the two cycles 29994 and 29995 have different eclipse profiles and hence different threading radii.
Bridge et al. (2003) suggested the presence of an extended curtain of material as being the cause of absorption over an extended phase range, and being at least partially responsible for the trough feature seen in the light curves. The fire-fly distribution in Figure 5 supports the idea that accretion material is threaded by many field lines. Schwope & Mengel (1997) suggested the presence of an accretion curtain, and their evidence for an extended accretion arc on the surface of the white dwarf further supports the idea that material is threaded onto many field lines.
6 Conclusions
We have applied the technique of eclipse mapping using genetically modified fire-flies to the eclipse lights curves of EP Dra and HU Aqr. The modelling shows that the technique is applicable to relatively good signal-to-noise ratio light curves of adequate phase range. These distributions of fire-flies show that the previously assumed ballistic free-fall plus magnetically confined streams are a good approximation for the accretion streams in polars.
We applied the model to -band light curves of HU Aqr cycles 29994 and 29995, and ‘white’-light curves of EP Dra cycle 56962, 56976, 56977 and 56978. We have demonstrated that the technique will distinguish regions of brightness in the different colour bands. This may indicate different temperatures or densities, and hence heating and/or cooling processes in the accretion stream or the location of photoionised material.
The fire-flies distributions in both HU Aqr and EP Dra show the accretion stream to be brightest near to the white dwarf. A possible threading region is present at which the fire-fly distributions appear to deviate from a calculated purely ballistic trajectory, and this region is seen to be broad, implying accretion along many field lines.
Differences in the location and concentration of fire-flies between the three cycles, 56976, 56977 and 56978, of EP Dra indicate a changing brightness distribution between the cycles. This could be the result of a change in the temperature of the accretion stream material, or a change in the amount of material stripped from the ballistic trajectory and coupled to the magnetic field lines of the primary.
ACKNOWLEDGMENTS
We wish to thank members of the Research and Scientific Support Department of the European Space Agency at ESTEC for the use of the S-Cam 2 instrument.
References
- [1] Bessell M. S., 1990, PASP, 102, 1181
- [2] Bridge C. M., Cropper M., Ramsay G., Perryman M. A. C., de Bruijne J. H. J., Favata F., Peacock A., Rando N., Reynolds A. P., 2002, MNRAS, 336, 1129
- [3] Bridge C. M., Cropper M., Ramsay G., de Bruijne J. H. J., Reynolds A. P., Perryman M. A. C., 2003, MNRAS, 341, 863
- [4] Charbonneau P., 1995, ApJS, 101, 309
- [5] Cropper M., 1990, Space Sci. Rev., 54, 195
- [6] Ferrario L. & Wehrse R., 1999, MNRAS, 310, 189
- [7] Glenn J., Howell, S. B., Gary D. S., Liebert J., Grauer A. D., Wagner R. M., 1994, ApJ, 424, 967
- [8] Hakala P. J., 1995, A&A, 296, 164
- [9] Hakala P., Cropper M., Ramsay G., 2002, MNRAS, 334, 990
- [10] Harrop-Allin, M. K., 1999, PhD thesis, Univ. London
- [11] Harrop-Allin M. K., Hakala P. J., Cropper M., 1999a, MNRAS, 302, 362
- [12] Harrop-Allin M. K., Cropper M., Hakala P. J., Hellier C., Ramseyer T., 1999b, MNRAS, 308, 807
- [13] Harrop-Allin M. K., Potter S. B., Cropper M., 2001, MNRAS, 326, 788
- [14] Kohonen T., 1990, Proc. of the IEEE, 78(9), 1464
- [15] Kube J., Gänsicke B.T. & Beuermann K. 2000, A&A, 356, 490
- [16] Perryman M. A. C., Cropper M., Ramsay G., Favata F., Peacock A., Rando N., Reynolds A. P., 2001, MNRAS, 324, 899
- [17] Remillard R. A., Stroozas B. A., Tapia S., Silber A., 1991, ApJ, 379, 715
- [18] Schwope A. D. & Mengel S., 1997, AN, 318, 25
- [19] Schwope A. D., Schwarz R., Sirk M., Howell S. B., 2001, A&A, 375, 419
- [20] Vrielmann S. & Schwope A.D. 2001, MNRAS, 322, 269