Stellar dynamics of blue compact galaxies††thanks: Based on observations collected at the European Southern Observatory, Paranal, Chile, under observing programme 71.B-0602.
In this letter we present the first results from a program aimed at measuring the stellar kinematics of blue compact galaxies by observing the near-infrared Calcium triplet. We show the first results for ESO 400-G43 based on deep VLT/FORS2 spectroscopy. The instabilities found in the central gaseous velocity field are not seen in the solid body stellar rotation curve, indicating that stars and gas are kinematically decoupled in this galaxy. Even if this galaxy has a perturbed gaseous velocity field, the stellar velocity dispersion on average agrees well with that derived from the nebular lines.
Key Words.:
galaxies: compact – galaxies: kinematics and dynamics – galaxies: individual: ESO400-G43 – galaxies: starburst1 Introduction
There has been strong interest in Blue Compact Galaxies (BCGs) ever since the pioneering study of Searle & Sargent (1972). The hypothesis that BCGs represent genuinely young galaxies, presently forming their first generation of stars, has now been disproved for all but a few extreme cases (see, e.g., Kunth & Östlin 2000 for a review). However, the evolutionary history of BCGs, their connection to other kinds of galaxies, and the mechanism that triggers the active star formation are still elusive.
Most studies of the nature of BCGs have been based on surface photometry (e.g. Papaderos et al. papaderos (1996)) or spectroscopic analysis of nebular abundances (e.g. Izotov and Thuan it (1999)), and relatively little is known about their dynamics, though Hi velocity fields have been obtained for some galaxies (e.g. van Zee et al. 1998). The stellar component has been much less analysed than the gaseous one because the spectra are dominated by hot stars and ionised gas emission, diluting stellar absorption features in the optical domain and making kinematical and chemical analysis difficult.
In Östlin et al. (ostlin99 (1999), ostlin01 (2001)) we investigated the velocity fields of the ionised gas in BCGs, using the CIGALE Fabry-Perot interferometer (Amram et al. amram91 (1991)) and targeting the H line. These results show that many luminous BCGs (LBCGs) have peculiar H velocity fields and irregular morphology, suggesting that their starbursts have been triggered by dwarf galaxy mergers. Many LBCGs also rotate too slowly to support the stellar mass inferred from deep optical and near-IR photometry (Östlin et al. ostlin01 (2001)). This mass discrepancy can be resolved if it is assumed that the width of the H line traces virial motions (see Melnick et al. melnick87 (1987)), indicating that these systems may be supported by velocity dispersion, i.e. random motions. This is rather unexpected for such gas-rich galaxies, but in line with the merger interpretation. Moreover, a few galaxies show peculiar rotation curves that initially rise rapidly, followed by a Keplerian (or even faster) decline, strengthening the interpretation that these galaxies are not in dynamical equilibrium (Östlin et al. ostlin01 (2001)).
It is, however, well known that the ISM may be subject to other types of motions than purely gravitational. Winds and outflows, for example, are expected to be present in actively star forming galaxies like these. Possibly, the H velocity field traces feedback rather than the gravitational potential. Even if gravitational motions are likely to dominate bulk motions on the scale of a whole galaxy, this possibility underlines the need for information on the kinematical properties of the stellar component.
The near-IR [Caii]λλ8498,8542,8662 triplet (hereafter Ca triplet) is well-suited for dynamical studies in galaxies dominated by young stellar populations (Dressler dressler84 (1984)). Even in a pure starburst, red supergiants will in most places contribute to an observable Ca triplet strength, and its use in probing complex galaxy kinematics has been demonstrated in many papers (e.g. Prada et al. prada96 (1996); Garcia-Lorenzo et al. garcia97 (1997); Kormendy and Bender kormendy&bender (1999); Márquez et al. marquez (2003)). We have therefore initiated a programme aimed at studying the stellar kinematics of BCGs, in particular those with peculiar H kinematics, by using the Ca triplet. Here, we are interested in studying the stellar kinematics as a function of radius, meaning that levels fainter than the night sky background need to be reached. This is a challenging task due to the many sky lines and strong fringing of most CCDs in this wavelength region. However, the red-optimised FORS2 spectrograph at the ESO VLT is ideally suited for this work.
Kobulnicky and Gebhardt (kobulnicky&gebhardt (1997)) studied the integrated dynamics of late type galaxies, among them a few BCGs, by looking at the [Oii]λ3727 and Caii H and K lines. They found that stars and gas tend to have similar global profiles, but their results for low mass galaxies were inconclusive. Moreover, no LBCG was included in their study. The Ca H and K lines are not useful in our case due to strong emission lines in the blue spectral region.
Galaxies with masses and properties similar to local LBCGs are common at higher redshift and make a significant contribution to the cosmic star formation rate (e.g. Guzmán et al. 1997, 2003). Hence, local LBCGs may give insights into the early evolution of galaxies, and have luminosities high enough to be observable even at high redshift. However, the study of absorption lines relies on a strong continuum, and at high redshifts it will be challenging to observe anything but emission lines. As these are sensitive to dynamical feedback from star formation, it is an important task to investigate how well-coupled gaseous and stellar kinematics are in local galaxies of the same kind.
In this letter we report on the first results of our study: The first determination of the stellar kinematics of a BCG through the Ca triplet. In future papers we shall make a more detailed analysis and present the results for other galaxies in our sample.
1.1 ESO 400-G43
ESO 400-G43 is a luminous (, H km s) BCG. It was once proposed as a young galaxy candidate (Bergvall & Jörsäter bergvall&jorsater (1988)), but deep surface photometry has revealed a rather massive underlying population (Bergvall & Östlin bergvall&ostlin (2002)). It has a companion galaxy at a projected distance of 70 kpc, too far for tidal forces to explain the strong starburst seen in ESO 400-G43 (Östlin et al. ostlin01 (2001)).
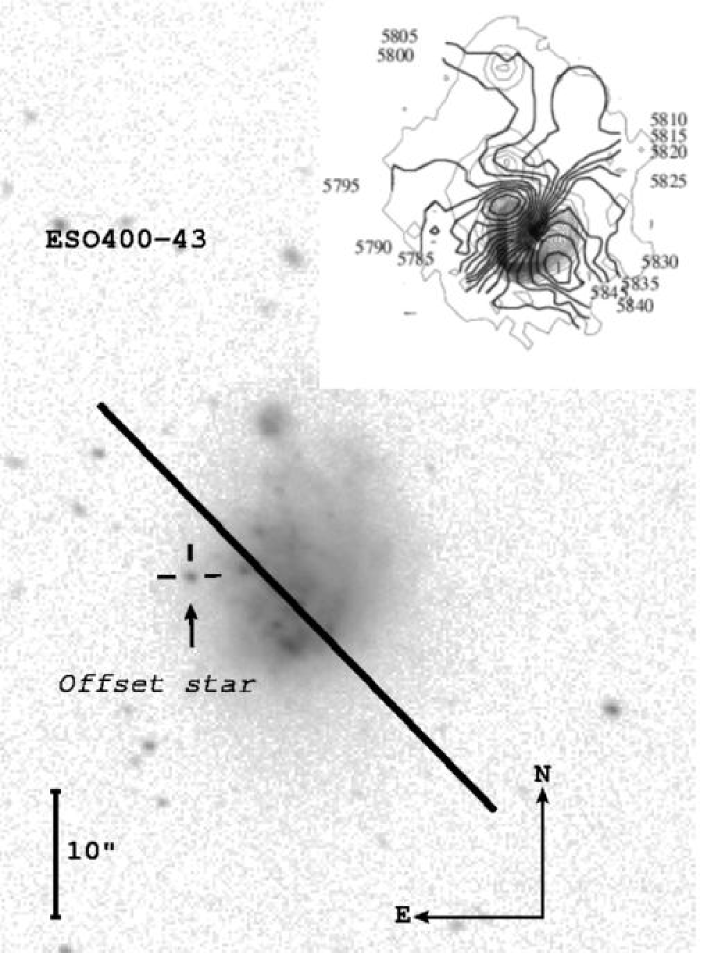
The H velocity field is (upper right inset in Fig. 1), at first sight rather regular, but after an initial rise to 60 km sat a radius of 1 kpc, the rotation curve falls off rapidly, in contrast to the photometric mass profile (Östlin et al. 2001). The fall is in fact faster than the Keplerian case, suggesting dynamical disequilibrium. The apparent rotational energy falls short of the photometric stellar mass by an order of magnitude. At much larger radii, kpc, the Hi velocity is again close to the central 60 km s(Bergvall & Jörsäter bergvall&jorsater (1988)) suggesting that a dynamical instability is responsible for the rapid decline of the optical rotation curve.
We identify three possible explanations for the apparent discrepancy between dynamical and photometrical mass. Gas–star decoupling may be important, i.e. a stellar velocity field different from the gaseous one, arising perhaps from outflows triggered by supernova winds or infall in a merging process. Alternatively, global gravitational instabilities might mean that neither stellar nor gaseous motions trace the potential. Finally, the low rotational velocities (but not the shape of the rotation curve) could be explained if velocity dispersion dominates the gravitational support.
The H velocity field has a well-defined kinematical centre and position angle, and was therefore suitable for a study with a single slit position. Our objective was to derive the stellar rotation curve and velocity dispersion out to a radius 2 kpc, making it necessary to reach surface brightness levels of mag/arcsec2.
2 Observations and reductions
The observations of ESO 400-G43 were obtained between June and August 2003 using the spectrograph FORS2 at the VLT. We observed one single slit position with a position angle of (see Fig. 1), chosen to coincide with the kinematical major axis derived from the H velocity field (see Fig. 1, and Östlin et al. 1999). We used the 1028z grism (covering to nm) and a slit width of 0.7″, resulting in a spectral resolution of near the Ca triplet. The spectra were acquired as a series of 600s exposures. In between each exposure, the telescope was offset along the slit. Using the same setup, six late-type reference stars were observed, to serve as templates for the cross correlation.
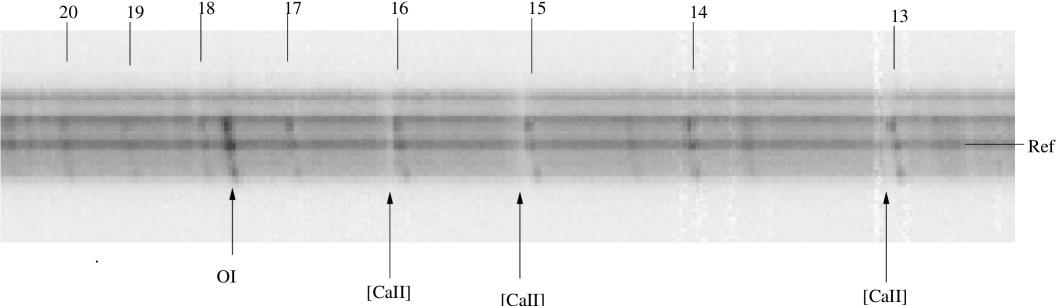
We used a somewhat non-standard reduction technique, in order to ensure effective subtraction of the strong atmospheric background emission at these wavelengths: Adjacent pairs of exposures were subtracted from each other, each time scaling the subtracted frame so that residuals from the OH and O2 lines were minimised. Only those frames resulting a in a good sky subtraction were retained for production of the final spectrum. Wavelength calibration was carried out in two dimensions using the OH sky lines on the unsubtracted frames. Each pairwise-subtracted frame was divided by a dome flatfield. The two-dimensional spectra were shifted to a common origin and coadded. Since the offset step along the slit was different in each case, negative residuals from objects incidentally falling in the slit cancelled when averaging the final frame. The resulting two dimensional spectrum (Figure 2) was based on 14 frames with a total exposure time of 8400 seconds, which was used for the subsequent analysis. From this final two-dimensional spectrum, one-dimensional extractions were made, and flux-calibrated using spectra of the standard stars LTT 7379 and LTT 7987.
Our aim was to cross-correlate the extracted spectra with reference stars of different types, mainly late-type giants and supergiants. The galaxy spectra contain also narrow emission lines, most of which belong to the Hi Paschen series. For each of the Ca triplet lines, there is a Paschen line (line number 13, 15 and 16 in the series) with only 3–4.5 Å higher rest wavelength. As the Ca absorption features have intrinsic widths of this order, the Paschen lines had to be removed before the Ca lines could be used to probe the stellar velocities.
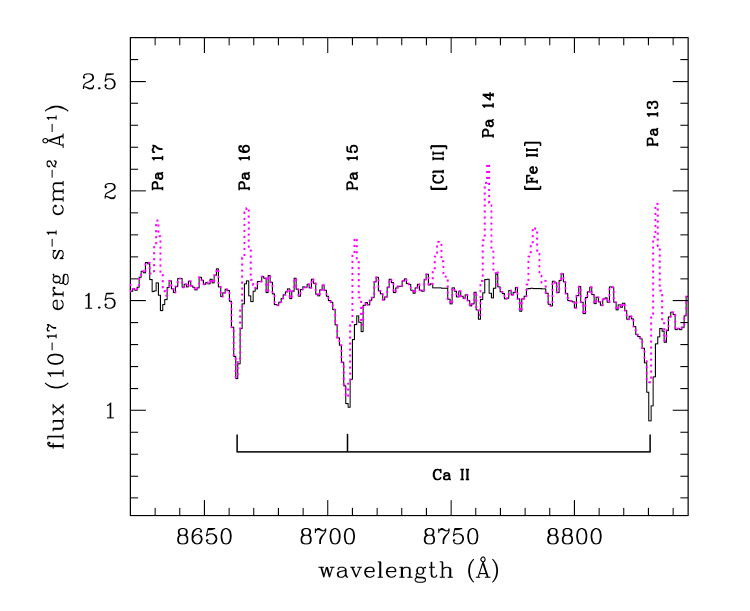
To achieve this, we first measured the fluxes and velocities of the strongest unblended Paschen lines from our spectra, and compared with the predicted strengths for Case B recombination at a temperature of 104 K and density 100 cm-3 (Osterbrock 1989, Hummer & Storey hummer (1987)). Within the observational uncertainties, the lines follow the predicted values for zero reddening, consistent with the low extinction reported by Bergvall & Östlin (bergvall&ostlin (2002)). We then modelled the Paschen series from Pa 9 to Pa 20 for each extracted spectrum, scaled to match the strongest clean Paschen lines and subtracted the modelled emission spectrum (Figure 3). The redshifts and widths of the modelled lines were determined from the strongest Paschen lines in the spectrum.
Finally, we corrected for remaining strong emission lines like O i 8446, [Cl ii] 8579 and [Fe ii] 8617, bad pixels and areas of poor sky subtraction by linearly interpolating across them. The spectra, now free of emission lines, were cross-correlated with the reference stars, using the iraf task fxcor (see Tonry & Davis TD (1979)). In addition to the Ca triplet, these spectra also contain other weak stellar absorption features which we also included in the cross correlation.
We calibrated the determination of , the line of sight stellar velocity dispersion, by broadening the reference star spectra with Gaussians of various widths, then measuring the resulting FWHM of the cross-correlation peak.
3 Results and discussion
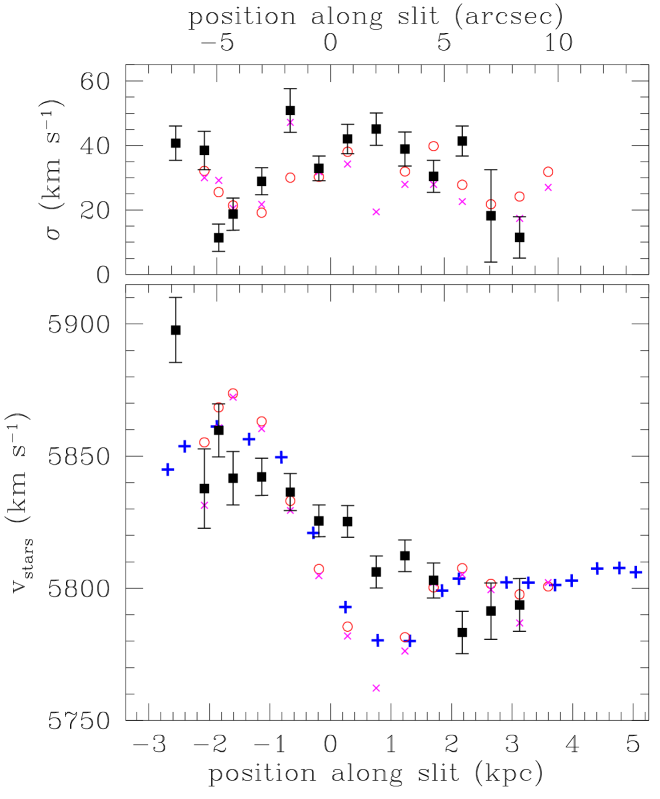
In Figure 4 we show (filled squares) the stellar velocities and velocity dispersions along the slit, and the corresponding data for ionised gas from the Pa10 line (crosses) and [Siii]λ9069 (circles). The gas velocity dispersions have been corrected for the instrumental width. In addition the H velocities extracted from the Fabry-Perot interferometric data (Östlin et al. ostlin99 (1999)) are shown (plus signs). For clarity, no error bars are plotted for the gas, but uncertainties are in general much smaller than for the stellar component.
The velocities for the ionised gas agree well with the previous investigations by Bergvall and Jörsäter (bergvall&jorsater (1988)), and Östlin et al. (ostlin99 (1999)). The differences between the Pa lines and the H can be attributed to the poorer spatial resolution of the latter data. The velocities rise to km s(uncorrected for inclination) over a linear scale of kpc. Outside these radii the velocities decline faster than the Keplerian case. On the approaching side the gas velocities level out at radii kpc. However, the difference with respect to the maximum velocity is still less than the Keplerian prediction. Hence, the ionised gas is not in dynamical equilibrium.
The stellar velocities behave differently. Firstly, the velocity gradient is much flatter than for the ionised gas. At kpc there is a drop in the rotational velocity (Fig. 4), but at kpc the rotation speed is again high. These two outer points are though the most uncertain ones, and there is no strong indication of a decline similar to what is seen in the gas. On the approaching side, the outer points suggest a modest velocity decrease at kpc (Fig. 4), where a twist is seen in the H velocity field (see Fig. 1, and Östlin et al. ostlin99 (1999)) as if a spiral arm were present. Taken together, the stellar velocity field is consistent with solid body rotation over the central 12″ (5 kpc) of our spectrum, where the S/N is good.
The difference between the minimum and maximum stellar velocity is km s, but this is biased by the uncertain point at . A straight line fit to the stellar velocities produces a velocity of km son a scale of 4.5 kpc (12″). With an assumed inclination of (Östlin et al. ostlin99 (1999)) this implies a rotational amplitude of km s. Using the same simple formula as in Eq. 1 of Östlin et al. (ostlin99 (1999), see also Lequeux 1983) with gives a mass of , somewhat lower than the photometric mass inside this radius of . The photometric mass profile indicates that the rotation curve should continue to rise out to a radius of 4 kpc (see Fig. 5 in Östlin et al. ostlin01 (2001)). At kpc the predicted circular speed for rotational support is km s, whereas we measure km s.
This rotational measure assumes that the kinematical position angle for the stars coincides with that for the gas (45°). However, the major-axis position angle from the broad band isophotes and Hi data is closer to 20°. Moreover, the broad-band data suggest a smaller inclination than 55°, while the Hi kinematics imply °(Bergvall and Jörsäter bergvall&jorsater (1988)). H/H mapping (Östlin & Bergvall ostlin&bergvall (1994)) show that the southeastern side of the disk is least affected by extinction and thus is probably nearest to us. With this orientation of the disk, an outflow would have the effect, which we also observe, that the kinematical position angle of the gas would be rotated anti-clockwise with respect to the stellar component. Consequently the mass from the stellar rotation curve may be underestimated, and should be increased by a factor of 1.9 (for ), or 2.3 if the true inclination is as low as 40°. In both cases, the mass inferred from the stellar rotation would be in fair agreement with the photometric mass.
The velocity dispersion measured from the ionised gas agrees well with that derived for the stars. Both are however lower than the 49 km sderived from Fabry-Perot interferometry (Östlin et al. 2001). The widths we present in Fig. 4 are, however, close to the instrumental width and may be underestimated. The agreement between stars and gas suggests that the widths of the hydrogen recombination lines reflect motions in response to the gravitational potential (see Melnick et al. 1987). Under this assumption, Östlin et al. (2001) derived a mass of . Taking km swe estimate the mass supported by stellar velocity dispersion to be .
It is clear that the gaseous velocity field does not reflect dynamical equilibrium. A model that can reproduce the main features in both the stellar rotation curve and the H velocity field reasonably well is one with solid body rotation with a position angle of 20°and an outflow with a 30 km sexpansion velocity out to a radius of kpc, where the expansion is halted in a shock. However, this model is not well constrained. A two-dimensional stellar velocity field would be required in order to construct a physical model for the kinematics and distinguish between the possible explanations given in Sect. 1.1.
4 Conclusions
The gaseous rotation curve of ESO 400-G43 increases steeply within 1 kpc from the kinematical centre, then drops faster than the Keplerian prediction. This is not seen in the stellar rotation curve which presents a solid body shape out to kpc. Hence, stars and gas are dynamically decoupled in this galaxy. The reasons for this could be outflows due to feedback from star formation or dynamical instabilities in a merging process, and will be discussed in future papers.
The stellar and gaseous velocity dispersions agree, but the amount of stellar velocity dispersion is somewhat smaller than implied by the photometric mass of (Östlin et al. 2001). Nevertheless, even allowing for uncertainties in the inclination, the stellar velocity dispersion makes a larger contribution than rotation to the gravitational support. This is consistent with the picture that the starburst host galaxy could be of, or will evolve into, elliptical type (see Bergvall & Östlin 2002).
Even though the stellar and gaseous kinematics appear decoupled in this galaxy, the mass inferred from the line widths of nebular lines and stellar absorption features agree. It remains to be seen if this is a general feature of luminous BCGs, but if so, it would lend credibility to mass estimates of high redshift galaxies that are based on the widths of narrow nebular lines.
Acknowledgements.
We thank our colleagues R. Guzmán and T. Marquart for stimulating discussions and useful suggestions. This work was supported by the Swedish Research Council.References
- (1) Amram P., Boulesteix J., Georgelin Y.P., Georgelin Y.M., Laval A., Le Coarer E., Marcelin M., 1991, Msgr 64, 44
- (2) Bergvall N., Jörsäter S., 1988, Nature 331, 589
- (3) Bergvall N., Östlin G. 2002, A&A 390, 891
- (4) Dressler A., 1984, ApJ 286, 97
- (5) Garcia-Lorenzo B., Mediavilla E., Arribas S., del Burgo C., 1997, ApJ 483, L99
- (6) Guzmán R., Gallego J., Koo D.C., et al., 1997, ApJ 489, 559
- (7) Guzmán R, Östlin G., Kunth D., et al., 2003, ApJ 586, L45
- (8) Hummer D.G., Storey P.J., 1987, MNRAS 224, 801
- (9) Izotov Y.I., Thuan T.X., 1999, ApJ 511, 639
- (10) Kobulnicky H., Gebhardt K., 2000, AJ 119, 1608
- (11) Kormendy J., Bender R., 1999, ApJ 522, 772
- (12) Kunth D., Östlin G., 2000, A&ARv 10, 1
- (13) Lequeux J., 1983, A&A 125, 394
- (14) Márquez I., Masegosa J., Durret F., et al., 2003 A&A 409, 459
- (15) Melnick J., Moles M., Terlevich R., Garcia-Pelayo J.M., 1987, MNRAS 226, 849
- (16) Osterbrock D., 1989, Astrophysics of gaseous nebulae and active galactic nuclei, University Science Books, Mill Valley
- (17) Östlin G., Bergvall N., in “ESO/OHP workshop on dwarf galaxies”, Eds. G. Meylan and P. Prugniel, 1994, ESO conference and workshop proceedings No. 49, p. 451
- (18) Östlin G., Amram P., Masegosa J., Bergvall N., Boulesteix J., 1999, A&AS 137, 419
- (19) Östlin G., Amram P., Bergvall N., Masegosa J., Boulesteix J., Márquez I., 2001, A&A 374, 800
- (20) Papaderos P., Loose H.-H., Fricke K.J., Thuan T.X., 1996, A&A 314, 59
- (21) Prada F., Gutierrez C.M., Peletier R.F., McKeith C.D., 1996, ApJ 463, L9
- (22) Searle L., Sargent W., 1972, ApJ 173, 25
- (23) Tonry J., Davis M., 1979, AJ, 84, 1511
- (24) van Zee L., Skillman E.D., Salzer J.J, 1998 AJ 116, 1186