The density and masses of obscured Black Holes
Abstract
Recent Chandra and XMM–Newton surveys have uncovered a large fraction of the obscured AGN responsible of the hard X–ray background. One of the most intriguing results of extensive programs of follow–up observations concerns the optical and near–infrared properties of the hard X–ray sources counterparts. More specifically, for a significant fraction of hard X–ray obscured sources the AGN responsible of the high X–ray luminosity remains elusive over a wide range of wavelengths from soft X–rays to near–infrared. This very observational result opens the possibility to investigate the host of bright obscured quasars in some detail. Here we briefly report on some preliminar results obtained for a small sample of elusive AGN in the HELLAS2XMM survey.
keywords:
X–ray surveys – AGN – Black HolesguessConjecture
1 Introduction
Hard X-ray surveys represent an efficient probe to unveil the super-massive black hole (SMBH) accretion activity, which is recorded in the cosmic X-ray background (XRB) spectral intensity. The advent of hard X-ray (i.e., 2–10 keV) imaging instruments, from ASCA to BeppoSAX and, more recently, Chandra and XMM-Newton, has provided a dramatic advance in the field of X–ray surveys.
The combination of deep/ultra-deep X–ray surveys with Chandra (Alexander et al. 2003; Giacconi et al. 2002) and the shallower surveys with XMM-Newton (Baldi et al. 2002) has allowed to resolve 80% of the XRB in the 2–10 keV band and to unveil classes of cosmic sources which were previously unknown or marginally represented by a few ambiguous and sparse cases.
Within this context, the HELLAS2XMM survey plays an important role. Using suitable XMM-Newton archival observations, this project aims at covering 4 square degrees of sky down to X–ray fluxes of the order of , sampling the bright tail of the X–ray luminosity function. The key scientific issue is a solid estimate of the luminosity function and evolution of the obscured AGN responsible for a large fraction of the XRB. In order to fulfill the goals of such an ambitious objective, the spectroscopic identification of a large number of hard X–ray selected sources is mandatory. Unfortunately the identification of a sizable fraction of optically faint obscured AGN is already challenging the capabilities of the 8–10 m class telescopes calling for alternative approaches based on multiband optical photometry, detection of redshifted iron K lines, or statistical methods. Some of the results obtained by our group in these regards, based on the multiwavelength observations of the HELLAS2XMM 1 degree field, will be briefly reported.
2 Optically obscured AGN
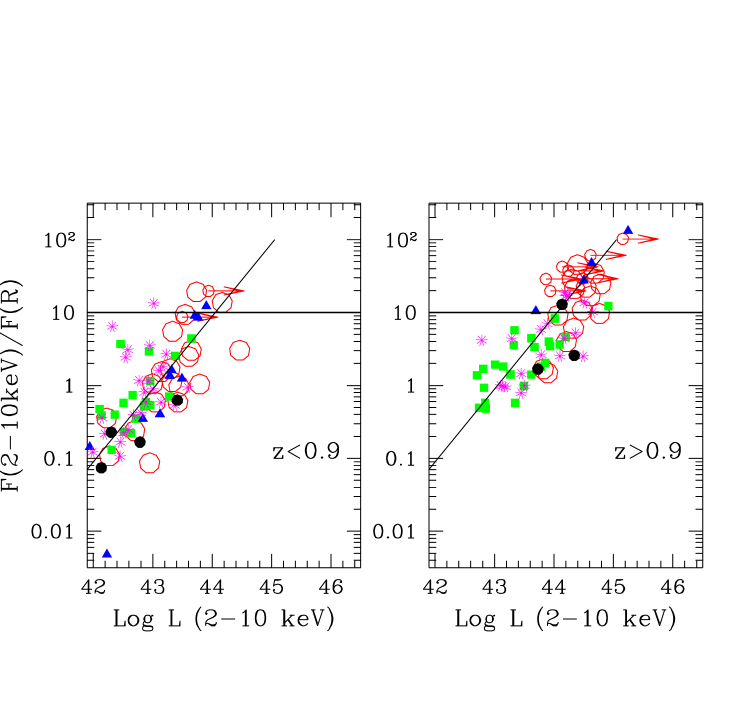
About 20% of the sources detected in recent hard X-ray surveys have a large X-ray (2–10 keV) to optical (-band) flux ratio (X/O ), i.e., ten times or more higher than typically observed in optically selected AGNs (Fiore et al. 2003; Alexander et al. 2001) The fraction of these sources seems to remain constant over 3 decades of X-ray flux. Fiore et al. (2003) discovered a striking correlation between X/O and the 2–10 keV luminosity for the sources having strongly obscured nuclei in the optical band, i.e. not showing broad emission lines. The optical R band light of these objects is dominated by the host galaxy light, which spans a luminosity range much smaller (about one fourth) than the X-ray luminosity, giving rise to the above correlation. Figure 1 shows X/O as a function of the 2–10 keV luminosity for a sample of optically obscured AGN in two redshift bins, below and above =0.9. The correlation between X/O and the 2–10 keV luminosity, though characterized by a not negligible scatter, is very strong in both redshift bins. At redshifts higher than 0.9 most of the point with L(2–10 keV) 1044 erg s-1, corresponding to high luminosity, highly obscured type 2 QSO, are from the HELLAS2XMM sample (Figure 1 right panel). The reason is that at the flux limit of the HELLAS2XMM sample several sources with X/O have optical magnitudes up to R 24–25, bright enough to obtain reliable spectroscopic redshifts, while in the much deeper but smaller area surveys of the CDFN, CDFS and Lockman Hole, sources with X/O have fainter (up to R 29) optical magnitudes, unaccessible to spectroscopy even with 10m class telescopes. Indeed, we were able to obtain spectroscopic redshifts and classification of 13 out of the 28 HELLAS2XMM 1dF sources with X/O; 8 of them are type 2 QSO at =0.7–1.8, to be compared with the similar number obtained from the combination of the CDFN and CDFS, at the expenses of a huge investment of VLT and Keck observing time. For other 8 HELLAS2XMM sources with X/O a lower limit on their redshifts was obtained from their observed R–K color (Mignoli et al. 2004) and they nicely agree with the X/O–logL(2–10 keV) correlation (see the small open circles with arrows in figure 1). We conclude that the majority of the sources with X/O are type 2 QSO at z, postulated in the simplest versions of XRB models based on AGN unification schemes (Comastri et al. 1995). Although only 20% of the X-ray sources have such high X/O, they may carry the largest fraction of accretion power from that shell of Universe. Large area (of the order of several square degrees), medium–deep surveys like HELLAS2XMM may be the most efficent tool to fully uncover this still rather poorly known component of the AGN population.
3 X-ray obscured AGN
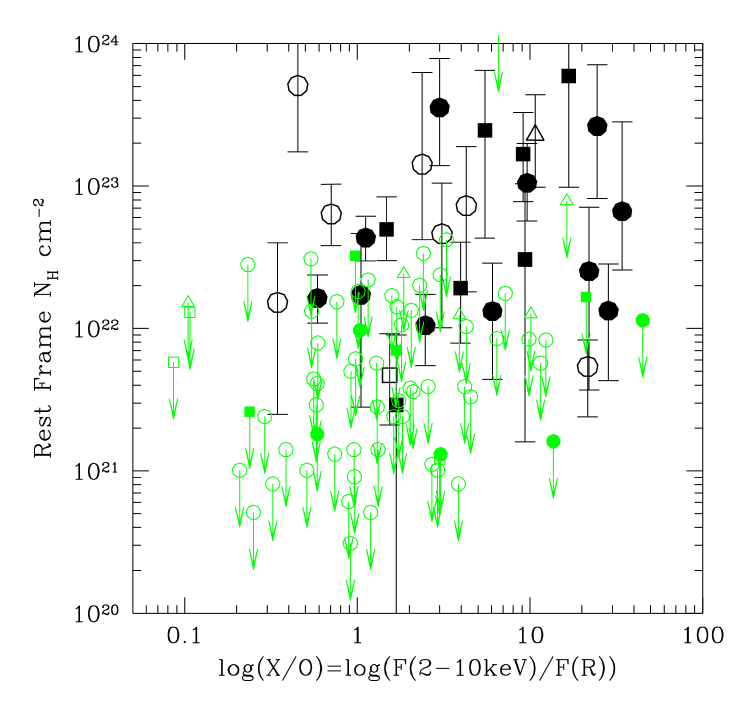
The X-ray absorption properties of the HELLAS2XMM 1df sample have been studied in detail by Perola et al. (2004). Figure 2 shows X/O as a function of the best fit, rest frame absorbing column for these sources. A strong correlation is clearly present between X/O and , i.e. optically obscured sources tend to be, on average, obscured also in X–rays, in agreement with Unification Schemes, although exceptions to this trend do exist. For istance X–ray absorption with column densities 1022-23.5 in broad line type 1 AGN has been reported (see Brusa et al (2003) and Perola et al (2004) for more details).
The distribution of the HELLAS2XMM 1df sources as a function of the 2–10 keV luminosity is shown in Figure 3 for three logarithimic bins of the absorbing column density: , and . The fraction of obscured sources in this sample is roughly constant with the luminosity. This is likely to be due to the rather narrow flux range (about one decade) covered by the HELLAS2XMM sample. Going to fainter fluxes both lower luminosities and higher redshifts are sampled. As a consequence, the correlations between the fraction of obscured sources with the luminosity and/or the redshift start to emerge (Ueda et al. 2003, Hasinger 2003, La Franca et al. in preparation).
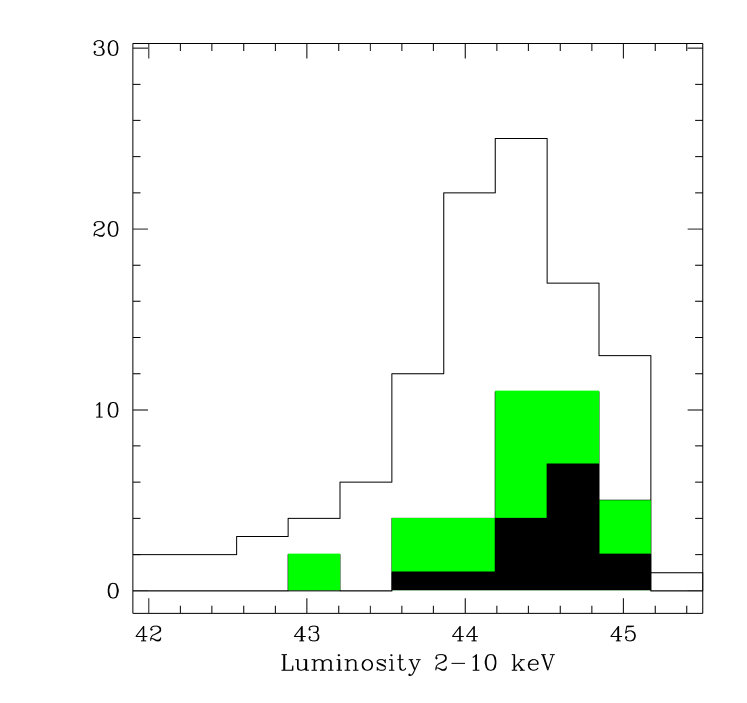
Figure 3 also shows that the fraction of high luminosity, highly obscured X-ray obscured objects can be as high as 40% (see Perola et al. 2004 for details), which means deg-2 at the flux limit of the HELLAS2XMM survey.
4 The masses of obscured black holes
To study the sources with high or extreme X/O in the HELLAS2XMM sample, and faint (R) optical counterparts in more detail, we have started a pilot program of deep near-infrared photometry () using ISAAC@VLT. Ten of the 11 sources with X/O 10 observed in the band were detected ( 18.4; Mignoli et al. 2004). Their optical-to-near-infrared colors are significantly redder than those of the field galaxy population, all of them being Extremely Red Objects (EROs; ).
The results of the analysis of the image profiles indicate that a pointlike nuclear source is present in a few objects only, the majority of the sources (7 out of 10) being well represented by a de Vaucoulers profile. A redshift estimate has been obtained from the measured optical and near–infrared magnitudes (see Mignoli et al. 2004 for a detailed description). Briefly, the observed distribution of R–K colors of our sources is compared with that of the sub–sample of spectroscopically identified early–type galaxies in the K20 redshift survey (Cimatti et al. 2002). A simple stellar population model which provides the reddest colors at each redshift has been then employed to assign a “minimum” redshift to each source. Not surprisingly, given their EROs color and K–band morphology, the 7 objects lie in the range 0.9 1.5.

The masses of the obscured SMBH powering the X–ray source and hidden by the host galaxy starlight can be estimated from the relation between the black hole mass and the K–band luminosity of the bulge component as discussed by Marconi & Hunt (2003). This approach returns an upper limit to the SMBH mass, since it has been assumed that the measured K band light is completely dominated by the bulge component. The presence of a disk or a residual point–source contribution escaping detection in the azimuthally–averaged brightness profile would lower the bulge luminosity and in turn the mass determination.
The mass upper limits coupled with the unabsorbed 2–10 keV luminosities derived by Perola et al. (2004) and with a prescription for the bolometric correction () allow a straightforward calculation of the lower limits on the Eddington ratio (). The correction factor needed to estimate the bolometric luminosity from the 2–10 keV band is subject to significant uncertainties and a robust estimate ( 30) is available only for bright unobscured quasars (Elvis et al. 1994). Lower values 10–20 are more appropriate for lower luminosities Seyfert–like objects (Fabian 2003) and also appears to better reproduce the observed Spectral Energy Distribution of a few heavily obscured sources (Comastri 2004). Given that we are dealing with lower limits of the Eddington ratio a conservative value of =10 has been assumed. The distribution of the SMBH masses and L/LEdd for the 7 galaxies are shown in Figure 4. The present estimates obtained through a chain of assumptions and neglecting the uncertainties associated to each of them should be considered as indicative.
A more detailed bi–dimensional fit of the galaxy images is under way, to disentangle the different morphological component and to better constrain the different components and therefore the SMBH mass (Donnarumma et al. in preparation; Mignoli et al. in preparation).
Acknowledgements.
The original matter presented in this paper is the result of the effort of a large number of people, in particular of the HELLAS2XMM team, which we warmely thank. This work was partially supported by the Italian Space Agency (ASI) under grant I/R/057/02, by INAF under grant # 270/2003 and MIUR grant Cofin–03–02–23.References
- [1] Alexander D.M. et al., AJ 122, 2156 (2001).
- [2] Alexander D.M. et al., AJ 126, 539 (2003).
- [3] Baldi A., Molendi S., Comastri A., Fiore F., Matt G. Vignali C., ApJ 564, 190 (2002).
- [4] Brusa M., Comastri A., Mignoli M., et al., A&A 409, 65 (2003).
- [5] Cimatti A., et al., A&A 381, L68 (2002).
- [6] Comastri A., Setti G. Zamorani G., Hasinger G., A&A 296, 1 (1995).
- [7] Comastri A., in ”Supermassive Black Holes in the Distant Universe”, Ed. A. J. Barger. Kluwer Academic Publishers, Chapter 8, in press, astro–ph/0403693 (2004).
- [8] Elvis M. et al., ApJS 95, 1 (1994).
- [9] Fabian, A.C., in ”Carnegie Observatories Astrophysics Series, Vol. 1: Coevolution of Black Holes and Galaxies,” ed. L. C. Ho (Cambridge: Cambridge Univ. Press) astro–ph/0304122 (2003).
- [10] Fiore, F., Brusa M., Cocchia F., et al., A&A 409, 79 (2003).
- [11] Giacconi, R. et al., ApJS 139, 369 (2002).
- [12] Hasinger G., in Proceedings of the conference: ”The restless high energy universe”, held in Amsterdam, May 2003. To be published in: Nucl. Physics B. Suppl. Ser., E.P.J. van den Heuvel, J.J.M. in ’t Zand, and R.A.M.J. Wijers (eds.). astro–ph/0310804 (2003).
- [13] Marconi A., Hunt L.K., ApJ 589, L21 (2003).
- [14] Mignoli, M., Pozzetti L., Comastri A., et al., A&A, in press, astro-ph/0401298 (2004).
- [15] Perola, G.C., Puccetti S., Fiore F. et al., A&A, in press, astro–ph/0404044 (2004).
- [16] Ueda Y., Akiyama M., Ohta K., Miyaji T. ApJ 598, 886 (2003).