ISOCAM survey and dust models of 3CR radio galaxies and quasars††thanks: Based on observations with ISO, an ESA project with instruments funded by ESA Member States (especially the PI countries: France, Germany, the Netherlands and the United Kingdom) with the participation of ISAS and NASA.
We present a survey of all 3CR sources imaged with ISOCAM onboard the Infrared Space Observatory (ISO). The sample consists mostly of radio–loud active galactic nuclei (AGN). For each source, we present spatially integrated mid–infrared (MIR, m) fluxes measured from newly calibrated ISOCAM images. In total, we detected 68 objects of the 3CR catalogue, at redshifts , and obtained upper limits for 17 objects. In addition, we detected 10 galaxies not listed in the 3CR catalogue. The one with the highest redshift is 4C72.26 at . ISOCAM data are combined with other photometric measurements to construct the spectral energy distribution (SED) from optical to radio wavelengths. The MIR emission may include synchrotron radiation of the AGN, stars of the host galaxy or dust. Extrapolation of radio core fluxes to the MIR show that the synchrotron contribution is in most cases negligible. In order to describe dust emission we apply new radiative transfer models. In the models the dust is heated by a central source which emits photons up to energies of 1keV. By varying three parameters, luminosity, effective size and extinction, we obtain a fit to the SED for our objects. Our models contain also dust at large (several kpc) distance from the AGN. Such a cold dust component was neglected in previous computations which therefore underestimated the AGN contribution to the far infrared (FIR). In 53 cases ( % of our detected 3CR sources), the MIR emission can be attributed to dust. The hot dust component is mainly due to small grains and PAHs. The modelling demonstrates that an AGN heating suffices to explain the ISO broad band data, starburst activity is not necessary. In the models, a type 1 AGN is represented by a compact dust distribution, the dust is therefore very warm and emission of PAHs is weak because of photo–destruction. In AGNs of type 2, the dust is relatively colder but PAH bands are strong.
Key Words.:
Infrared: galaxies – Galaxies: ISM – Galaxies: dust1 Introduction
More than 20 years ago Kotanyi & Ekers (1979) pointed out that for radio–loud elliptical galaxies, the orientation of the (optical) dust lane appears preferentially perpendicular to the radio axis. In unification theories dust plays an important role. In all of them, a supermassive blackhole accretes gas from a disk and, in radio–loud objects, a jet is ejected parallel to the rotation axis. The blackhole and the disk are surrounded by a torus of interstellar gas and dust which may block light from the central region on the way to the observer. The diversity in the appearance of activity types is then explained foremost as a result of different viewing angles (Barthel 1989).
The obscuring dust torus is at the heart of unification theories. It reaches towards the blackhole as close as dust can survive ( K). As the torus is not directly seen on optical images, its dimensions are at most a few hundred parsec. Because of the immense bolometric luminosity emitted from the AGN, the dust in the torus, even at a distance of 100 pc, must be very warm ( K), and further in even hot. Such hot dust will emit preferentially in the mid infrared (MIR), at wavelengths covered by the ISOCAM filters.
Dust in radio galaxies is not restricted to the nuclear region, but is ubiquitous in the host galaxy. It absorbs and scatters the light, but also radiates thermally as it is heated either by the nucleus or by stars. Of course, the diffuse and spatially extended dust is much colder than the dust near the AGN. Rapid star formation is also a potential heating source, besides the AGN. A detailed search for dust in the nuclear regions of 120 radio sources of the 3CR catalogue was carried out by de Koff et al. (2000) using optical HST images at 0.7m center wavelength and of resolution. In one out of three galaxies, they found evidence for dust obscuration, with a large variety of morphologies such as disks, lanes or filaments. Dust distributed smoothly on a large scale of several kpc is difficult to detect in absorption maps but reveals itself by infrared emission.
The dust shroud of an AGN is often not transparent and to model the emission spectrum one has to compute the radiative transfer. Models for optically thick dusty nuclei and galaxies have been carried out in various approximations (Pier & Krolik 1993, Laor & Draine 1993 Krügel & Siebenmorgen 1994, Granato & Danese 1994, Efstathiou & Rowan–Robinson 1995, Siebenmorgen et al. 1997, Nenkova et al. 2002, Popescu et al. 2004). Previous AGN dust models underestimated the FIR as they did not include dust located at large distances from the center and thus missed the cold component. To overcome the deficit emission in the FIR, these authors add an additional component to the models and attribute it to starburst activity (e.g. Rowan–Robinson 2000). In Section 4, we present AGN dust models where large scale dust emission is incorporated and where the geometry is radically simplified so that they can be described by only three parameters.
A cold dust component was discovered in 18 sources of the 3CR catalogue already by IRAS (Heckman et al. 1994) and more recently, in more objects, by ISOPHOT (Fanti et al. 2000, Meisenheimer et al. 2001, Van Bemmel et al. 2001, Andreani et al. 2002, Spinoglio et al. 2002, Haas et al. 2004). These authors detected also a few sources in the MIR. The hot dust responsible for it must be close to the nucleus and its detection serves as a further test for the unified model hypothesis. This motivated us to survey the 3CR galaxies in the MIR by means of ISOCAM images available from the ISO archive. The sensitivity of ISOCAM is orders of magnitude greater than IRAS at 12m.
In Section 2 and 3, we present the images, pertaining photometric measurements as well as results. The spectral energy distributions (SED) are displayed in Section 4. To interprete them, we apply radiative transfer models. A discussion of generic SED properties in the infrared for different AGN types is given in Section 5. The conclusions are given in Section 6. In Appendix A we remark on individual galaxies (previous indications of dust, X-ray properties, jets, presence of high excitation lines, source morphology, companions). In Appendix B, we make for each galaxy a note on the radiative transfer models of Section 4. Details of the ISOCAM observational set up is summarised in Tab. 5. The fully reduced and astrometrically corrected ISOCAM images are shown as overlays on optical images in Fig. 10.
2 Survey data
We present the data of our survey, describe which ISOCAM fields were extracted from the ISO archive, briefly overview the ISOCAM observing modes, and outline data reduction, source identification and photometric procedures.
2.1 Source selection
The parent catalogue for our sample is the third update of the revised third Cambridge catalogue (3CR) by Spinrad et al. (1985). It contains 298 sources of which 195 are classified as radio galaxies and 53 as radio quasars. Most of the objects in the 3CR catalogue are well observed at optical and near infrared wavelengths. We searched in the ISO archive for ISOCAM (Cesarsky et al. 1996) observations made with the long wavelength array (LW). All ISOCAM images containing, potentially, at least, one 3CR source have been extracted. Altogether, we found 146 such ISOCAM observations. Often the same source was observed in multiple filter band passes. On the fully reduced ISOCAM images, we determined and improved the astrometric pointing by identifying objects with accurate coordinates listed in the SIMBAD Astronomical Database or the NASA/IPAC Extragalactic Database (NED). The images are presented in Fig. 10. We also made 10 serendipitous detections of galaxies which are not members of the 3CR catalogue. They are eye-ball detections at the position of NED coordinates.
2.2 Observations
Most of the observations were done in the so called mini-raster mode where different ISOCAM detector pixels saw the same part of the sky (see ISO Handbook for a description of observing modes, Leech & Pollock, 2001). In addition, there are nine staring and one beam switch observation. Three observations were performed in the circular variable filter (CVF) scan mode and one in the polarimetric mode.
Depending on the lens used in the experiment, the pixel scale of the 32 32 element detector was 1.5′′, 3′′ and 6′′ and the total field of view , and arcsec2, respectively. The most frequently applied broad band filter was LW10 with a bandwidth from 8–15m and central wavelength at 12m. In addition there are observations with filter: LW1 (4–5, 4.5m), LW2 (5–8.5, 6.7m), LW3 (12–18, 14.3m), LW7 (8.5–11, 9.6m) and CVF scans (5–17m) at spectral resolution of . In a single observing template often more than one filter was selected.
| Name | TDT | Band | Flux | RMS |
|---|---|---|---|---|
| m | mJy | mJy | ||
| 1 | 2 | 3 | 4 | 5 |
| 3C006.1 | 70101081 | 12.0 | 0.9 | 0.2 |
| 3C013 | 80801283 | 12.0 | 0.7 | 0.2 |
| 3C017 | 57502102 | 12.0 | 4.0 | 0.4 |
| 3C018 | 61901003 | 12.0 | 9.1 | 0.6 |
| 3C020 | 59702305 | 12.0 | 5.3 | 0.4 |
| 3C022 | 78500882 | 12.0 | 7.1 | 0.4 |
| 3C031 | 58703801 | 4.5 | 30 | 2 |
| 40201422 | 6.7 | 36 | 2 | |
| 58703793 | 12.0 | 25 | 1 | |
| 58703801 | 14.3 | 30 | 2 | |
| 3C033.1 | 59702607 | 12.0 | 18 | 1 |
| 3C048 | 43901804 | 14.3 | 59 | 4 |
| 3C061.1 | 56201411 | 12.0 | 4.3 | 0.3 |
| 3C66B | 45304902 | 4.5 | 14 | 1 |
| 43502724 | 6.7 | 13 | 1 | |
| 45304902 | 14.3 | 3.8 | 1.6 | |
| 3C071 | 63301602 | 4.5 | 6860 | 340 |
| (NGC1068) | 63301902 | 6.8 | 14030 | 700 |
| 63302202 | 14.9 | 50830 | 2540 | |
| 3C076.1 | 46601603 | 4.5 | 5.1 | 1.0 |
| 46601603 | 6.7 | 3.0 | 0.8 | |
| 46601603 | 14.3 | 1.0 | 1.5 | |
| 3C079 | 61503807 | 12.0 | 21 | 2 |
| 3C083.1 | 65901304 | 4.5 | 31 | 2 |
| 65901032 | 6.7 | 47 | 3 | |
| 65901304 | 14.3 | 9.7 | 1.5 | |
| 3C084 | 61503617 | 6.7 | 230 | 20 |
| 9.6 | 400 | 70 | ||
| 14.3 | 1000 | 100 | ||
| 3C098 | 63302405 | 4.5 | 6.5 | 1.0 |
| 63302405 | 6.7 | 7.7 | 0.9 | |
| 63302405 | 14.3 | 24 | 2 | |
| 3C231 | 12300106 | 6.7 | 25000 | 1250 |
| (M82) | 12300106 | 12.0 | 63000 | 3150 |
| 12300106 | 14.9 | 68000 | 3400 | |
| 3C249.1 | 21305001 | 12.0 | 19 | 1 |
| 3C265 | 22400201 | 4.5 | 1.3 | 0.5 |
| 22201802 | 6.7 | 2.4 | 0.2 | |
| 22400303 | 12.0 | 6.0 | 1.6 | |
| 3C270 | 22801205 | 4.5 | 160 | 8 |
| 22801205 | 6.7 | 95 | 5 | |
| 22801205 | 14.3 | 38 | 3 | |
| 3C272.1 | 23502406 | 4.5 | 900 | 46 |
| 23100414 | 6.7 | 240 | 12 | |
| 23100414 | 9.6 | 150 | 8 | |
| 23100414 | 14.3 | 53 | 3 | |
| 3C273 | 24100504 | 14.3 | 290 | 15 |
| 24100504 | 6.7 | 190 | 10 | |
| 3C274 | 23800308 | 4.5 | 740 | 38 |
| (M87) | 23800308 | 6.7 | 260 | 13 |
| 23901834 | 12.0 | 51 | 3 | |
| 3C277.3 | 24500106 | 6.7 | 3.6 | 0.3 |
| 24500106 | 14.3 | 8.5 | 0.5 |
| Name | TDT | Band | Flux | RMS |
|---|---|---|---|---|
| m | mJy | mJy | ||
| 1 | 2 | 3 | 4 | 5 |
| 3C286 | 38800808 | 12.0 | 3.6 | 0.3 |
| 3C288.1 | 24407233 | 12.0 | 2.3 | 0.6 |
| 3C293 | 61701307 | 4.5 | 16 | 1 |
| 61701307 | 6.7 | 14 | 1 | |
| 61701413 | 12.0 | 19 | 2 | |
| 61701307 | 14.3 | 23 | 1 | |
| 3C295 | 18001405 | 6.7 | 1.4 | 0.3 |
| 3C296 | 27000606 | 4.5 | 30 | 2 |
| 27000606 | 6.7 | 16 | 1 | |
| 27000606 | 14.3 | 13 | 1 | |
| 3C303.1 | 52900115 | 12.0 | 1.9 | 0.2 |
| 3C305 | 46300408 | 4.5 | 12 | 1 |
| 12300205 | 6.7 | 7.1 | 2.7 | |
| 51400760 | 12.0 | 21 | 1 | |
| 12300205 | 14.3 | 27 | 5 | |
| 3C305.1 | 71702771 | 12.0 | 1.5 | 0.2 |
| 3C309.1 | 60001472 | 12.0 | 8.2 | 0.5 |
| 60092200 | 6.7 | 4.4 | 0.5 | |
| 3C319 | 54100619 | 12.0 | 1.3 | 0.2 |
| 3C321 | 65800208 | 6.7 | 12 | 1 |
| 65800208 | 12.0 | 27 | 1 | |
| 65800208 | 14.4 | 51 | 3 | |
| 3C324 | 30300612 | 6.7 | 0.1 | 0.2 |
| 30300413 | 12.0 | 1.7 | 0.2 | |
| 3C330 | 33600323 | 6.7 | 1.3 | 0.2 |
| 60001373 | 12.0 | 1.7 | 0.2 | |
| 33600323 | 14.3 | 2.6 | 0.5 | |
| 3C332 | 60201725 | 12.0 | 9.2 | 0.5 |
| 3C336 | 30400442 | 12.0 | 2.4 | 0.5 |
| 30492200 | 6.7 | 0.9 | 0.2 | |
| 3C338 | 10601408 | 4.5 | 16 | 1 |
| 10601408 | 6.7 | 9.4 | 0.8 | |
| 51100561 | 12.0 | 8.8 | 0.5 | |
| 10601408 | 14.3 | 7.3 | 1.4 | |
| 3C341 | 60201626 | 12.0 | 8.0 | 0.5 |
| 3C343 | 61900565 | 12.0 | 1.4 | 0.2 |
| 3C345 | 51100679 | 12.0 | 22 | 1 |
| 3C346 | 64001327 | 12.0 | 4.2 | 0.3 |
| 3C349 | 52500429 | 12.0 | 3.4 | 0.3 |
| 3C351 | 52500130 | 12.0 | 32 | 2 |
| 3C356 | 52100668 | 12.0 | 0.6 | 0.2 |
| 3C371 | 52901232 | 12.0 | 66 | 4 |
| 55500476 | 14.3 | 91 | 5 | |
| 3C379.1 | 52901433 | 12.0 | 3.6 | 0.3 |
| 3C380 | 54100969 | 12.0 | 14 | 1 |
| 3C381 | 50304334 | 12.0 | 19 | 1 |
| 3C382 | 52500562 | 12.0 | 85 | 5 |
| 3C386 | 47100710 | 4.5 | 13 | 1 |
| 47100710 | 6.7 | 6.3 | 0.8 | |
| 51301035 | 12.0 | 5.6 | 0.3 | |
| 47100710 | 14.3 | 3.3 | 1.4 | |
| 3C388 | 54100836 | 12.0 | 1.2 | 0.2 |
| 3C390.3 | 52901537 | 12.0 | 94 | 5 |
| Name | TDT | Band | Flux | RMS |
|---|---|---|---|---|
| m | mJy | mJy | ||
| 1 | 2 | 3 | 4 | 5 |
| 3C402 | 49604639 | 12.0 | 3.4 | 0.5 |
| 3C410 | 53503041 | 12.0 | 22 | 1 |
| 3C418 | 54101870 | 12.0 | 3.6 | 0.3 |
| 3C430 | 54301344 | 12.0 | 1.7 | 0.3 |
| 3C433 | 52201845 | 12.0 | 32.0 | 2 |
| 3C445 | 54500518 | 6.7 | 93 | 5 |
| 54500518 | 14.3 | 210 | 11 | |
| 3C449 | 54801112 | 4.5 | 16 | 1 |
| 36701710 | 6.7 | 10 | 1 | |
| 37403041 | 12.0 | 7.6 | 0.9 | |
| 54801252 | 12.0 | 8.7 | 0.5 | |
| 36701710 | 14.3 | 11 | 2 | |
| 3C452 | 54801053 | 12.0 | 23 | 1 |
| 3C456 | 54700854 | 12.0 | 9.1 | 0.6 |
| 3C459 | 37500303 | 4.5 | 0.1 | 0.5 |
| 6.0 | 5.5 | 0.9 | ||
| 7.7 | 6.8 | 1.1 | ||
| 14.9 | 29.5 | 4.0 | ||
| 3C465 | 39501112 | 4.5 | 22 | 1 |
| 39501112 | 6.7 | 8.1 | 0.8 | |
| 3C469.1 | 56201064 | 12.0 | 1.8 | 0.2 |
| Name | TDT | Band | Flux |
|---|---|---|---|
| m | mJy | ||
| 1 | 2 | 3 | 4 |
| 3C002 | 41907203 | 12.0 | 1.7 |
| 3C313 | 08800387 | 12.0 | 6.2 |
| 3C314.1 | 52900417 | 12.0 | 0.6 |
| 3C320 | 59501620 | 12.0 | 0.5 |
| 3C343.1 | 39901248 | 12.0 | 3.3 |
| 3C352 | 51800667 | 12.0 | 0.6 |
| 3C357 | 51800831 | 12.0 | 0.6 |
| 3C368 | 71200283 | 6.7 | 1.5 |
| 10200421 | 6.7 | 8.1 | |
| 71200283 | 14.3 | 2.1 | |
| 3C401 | 53200838 | 12.0 | 0.6 |
| 3C427.1 | 52902663 | 12.0 | 0.6 |
| 3C434 | 53503146 | 12.0 | 1.0 |
| 3C436 | 52201948 | 12.0 | 1.0 |
| 3C437 | 53503288 | 12.0 | 1.4 |
| 3C438 | 54000949 | 12.0 | 0.5 |
| 3C442 | 53702911 | 14.3 | 4.5 |
| 3C454.1 | 56001074 | 12.0 | 0.6 |
| 3C460 | 56501357 | 12.0 | 0.4 |
Parameters of the observing templates are detailed in Tab. 5: target dedicated time (TDT) by which the observations are identified (column 1), celestial coordinate of the map center (column 2 and 3), observing date (column 4), band pass filter (column 5), lens (column 6), number of raster points (column 7) and raster lines (column 8), step between raster points (column 9) and raster lines (column 10), both in arcsec, and the median number of exposures taken on each raster position (column 11) together with the integration time per read–out (column 12).
2.3 Data reduction
The data were reduced with the ISOCAM Interactive Analysis (CIA, Ott et al. 1996). We used the default data reduction steps of CIA: dark current subtraction, initial removal of cosmic ray hits (glitches), detector transient fitting, exposure coaddition, flat fielding and flux conversion to astronomical units. Except for staring modes, the coadded images at each raster position were sky projected and corrected for field distortion.
The dark current depends on the orbital position of the ISO space-craft and the temperature of the ISOCAM detector. The applied correction is based on a model described by Roman & Ott (1998). The deglitching is done by following the temporal signal variation of a pixel using a multi–resolution wavelet transform algorithm (Starck et al. 1997). The response of the detector pixels depends on the previous observations and there may be long term hysteresis effects for each detector element after changes of the photon flux level. We applied the detector flux transient fitting method for ISOCAM data (Coulais & Abergel 2000). After application of the default deglitcher some residuals of cosmic ray impacts were still visible in the data. Therefore we applied after the detector flux transient correction a second cosmic ray rejection method which is basically a multi-sigma clipping of the temporal signal (Ott et al. 2000). For raster observations, flat field estimation can be improved by an iterative method exploiting the fact that the same sky area is seen by different detector pixels (Starck et al. 1999). The method works best for highly redundant data where a large number of pixels see the same sky. In case of low redundancy rasters and for staring observations, we flat–fielded according to the standard calibration library.
2.4 Source photometry
To determine the source flux, we perform a multi–aperture photometry. For each aperture centered on the brightest pixel of the source we determine the background as the mean flux derived in a 4 pixel wide annulus which is put 2 pixels away from the greatest () aperture. In this way, we obtain aperture fluxes that flatten with increasing aperture radius and approach an asymptotic value. For point sources the same procedure is repeated on a theoretical and normalised point source image (Okumura 1998) to find the correction factor of the multi–aperture analysis. The correction factor is typically 5%. The determination if a source is a point source or not is done by eye. The procedure will introduce an error of less than the correction factor for slightly extended sources misjudged to be a point source. In order to derive the statistical flux uncertainty, for the source aperture we quadratically add the RMS image and the 1 uncertainty of the background estimate. The systematic error of ISOCAM photometry is typically and color corrections of order 10% (see ISOCAM Handbook, Blommaert et al. 2001).
3 Results
We find from the detection statistics of the ISOCAM survey of 3CR sources that in our sample there is no bias against AGN type. We present SEDs from optical to radio wavelengths for individual sources and discuss potential contributions to the ISOCAM fluxes (synchrotron, photospheric and dust emission).
| Name | TDT | Band | Flux | RMS |
|---|---|---|---|---|
| m | mJy | mJy | ||
| 1 | 2 | 3 | 4 | 5 |
| 4C+72.26 | 74101506 | 12.0 | 0.7 | 0.08 |
| NGC0382 | 58703801 | 4.5 | 7.0 | 1.2 |
| 40201422 | 6.7 | 12 | 2 | |
| 58703793 | 12.0 | 7.3 | 0.5 | |
| 58703801 | 14.3 | 10 | 2 | |
| NGC7236 | 53702911 | 6.7 | 3.8 | 0.8 |
| 53702750 | 12.0 | 2.8 | 0.3 | |
| 53702911 | 14.3 | 5.5 | 1.5 | |
| NGC7237 | 53702911 | 6.7 | 3.6 | 0.8 |
| 53702750 | 12.0 | 1.8 | 0.2 | |
| NGC5532NED02 | 27000606 | 4.5 | 4.5 | 1.0 |
| 27000606 | 6.7 | 1.0 | 0.8 | |
| F17130+5021 | 52100804 | 12.0 | 14 | 1 |
| J1728201+314603 | 51800831 | 12.0 | 2.8 | 0.2 |
| PMNJ021411582 | 59601514 | 12.0 | 1.8 | 0.3 |
| PGC012293 | 65901032 | 6.7 | 1.3 | 0.2 |
| 65901304 | 14.3 | 3.0 | 1.4 | |
| PCd91212130.83 | 35701635 | 6.7 | 31 | 2 |
| 245139.2 |
3.1 Bias and detection statistics
The primary goal of our survey is to compile a sample of radio-loud AGNs which is not subjects to biases related to the type and therefore viewing angle of the AGN torus. While this seems to be the case for the parent 3CR catalog (e.g. Urry and Pdovani 1995), the selection of objects from the ISOCAM survey was beyond our control. We shall therefore compare the flux and redshift distribution of the galaxies detected by ISOCAM with those of the 3CR catalogue.


In total, we detected 68 sources from the 3CR catalogue and determined 17 upper limits up to redshifts . Furthermore, there are 10 serendipitous detections of galaxies in the ISOCAM images which are not listed in the 3CR catalogue. One example is the radio source 4C72.26 at redshift . The ISOCAM fluxes of detected 3CR sources are listed in Tab. 1 and upper limits of non-detected 3CR sources in Tab. 2. We also give the ISOCAM flux for galaxies which are not members of the 3CR catalogue in Tab. 3. Notations in Tab. 1 and Tab. 3 are: catalogue name (column 1), the TDT number used as an identifier of the observation is listed in column 2, followed by the central wavelength (m) of the filter band pass (column 3), aperture flux (column 4) and 1 RMS flux error (mJy) of the aperture photometry (column 5). Tab. 2 has the same structure except that we specify as flux the 3 upper limit. Notes to 3CR galaxies detected by ISOCAM are given in Appendix A.
In Fig. 1 we compare the radio flux and redshift distribution of 3CR sources detected with ISOCAM to galaxies of the parent catalogue. From the top panel of Fig. 1 it becomes evident that the fraction of 3CR galaxies detected in our survey is a strong function of radio flux, which spans two orders of magnitude. For example of the sources with an 178 MHz flux Jy we detect only 15%, whereas for sources with an 178 MHz flux stronger than 30 Jy of all 3CR sources are detected. Furthermore, the galaxies detected with ISOCAM follow, by and large, the redshift–flux distribution of the parent catalogue (lower box of Fig. 1), at least, for redshifts larger than about 0.2. However, at , our subsample seems to show a preponderance of radio bright objects.
The fact that low redshift objects are preferentially included raises the question whether this is due to flux limits of our survey, i.e. whether the ISOCAM detection rate strongly drops as a function of redshift. This is investigated in Fig. 2, where we present the detection rate of our survey as a function of redshift. From Fig. 2 one can see that the detection rate of local objects () is close to 100%. For , and then almost independent of redshift up to , the detection rate is 75%. Therefore our survey is in this redshift range not limited by the sensitivity of ISOCAM. We conclude that the AGNs of our survey present a fair subsample of the 3CR catalogue for redshifts larger than 0.2.
3.2 Spectral energy distributions
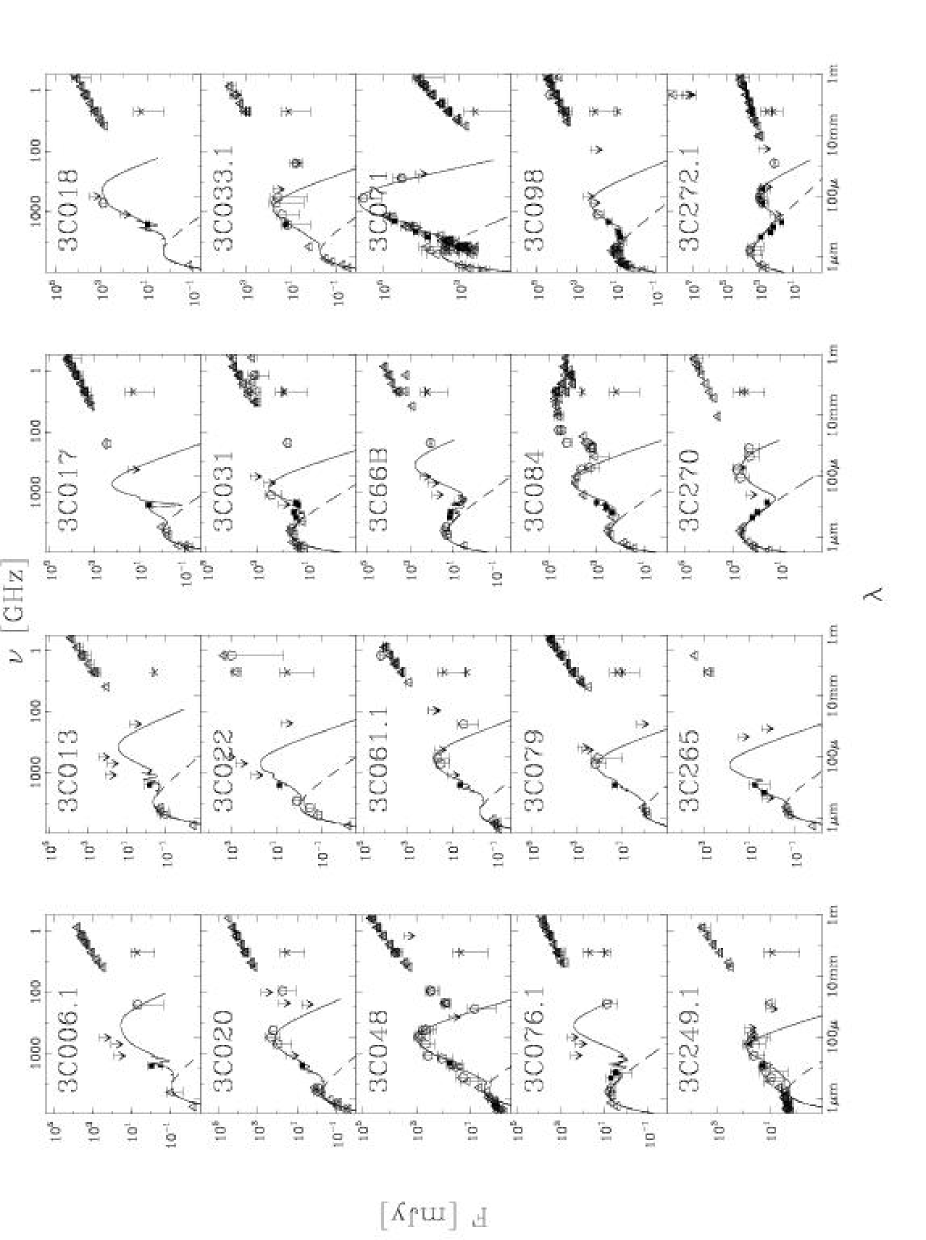
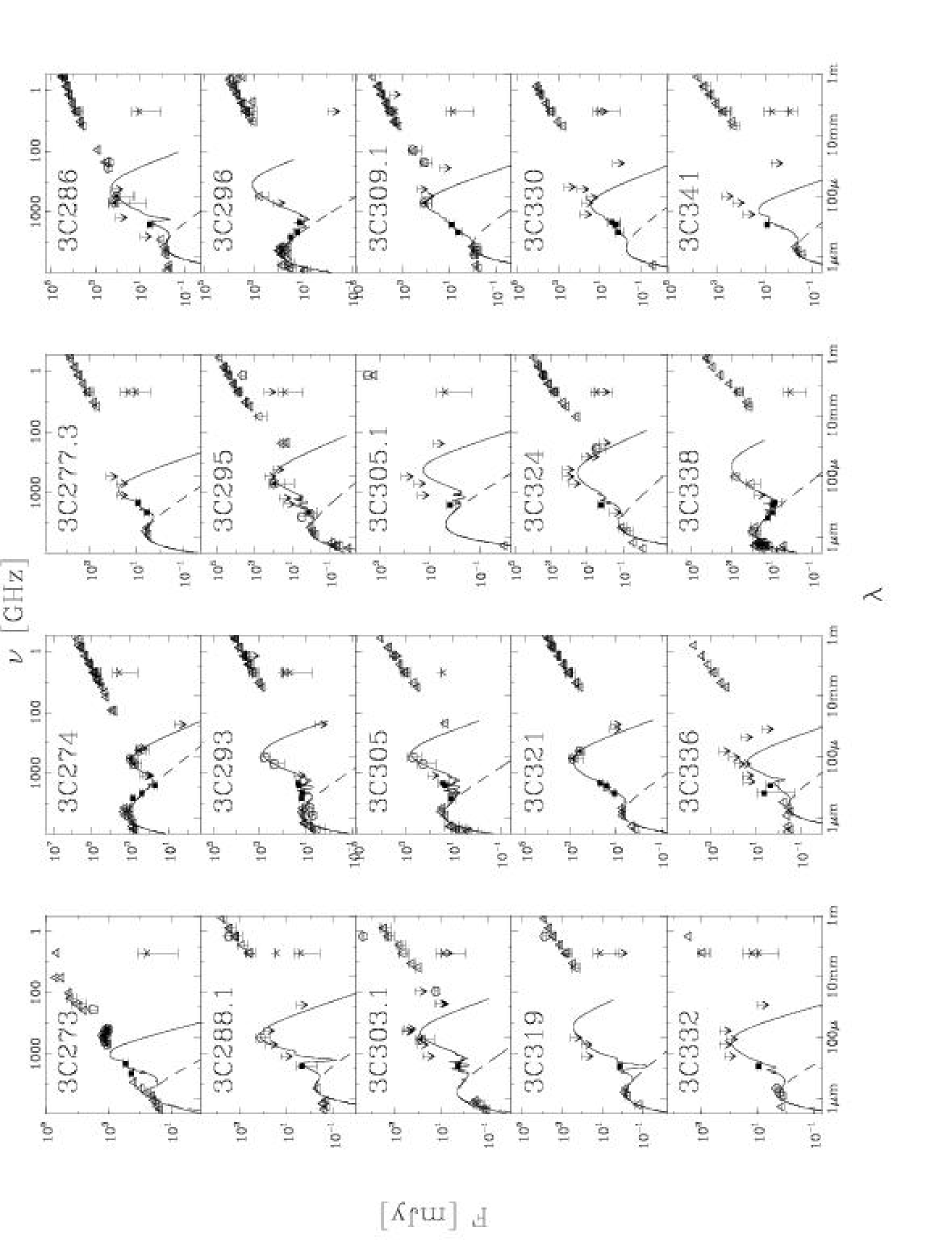
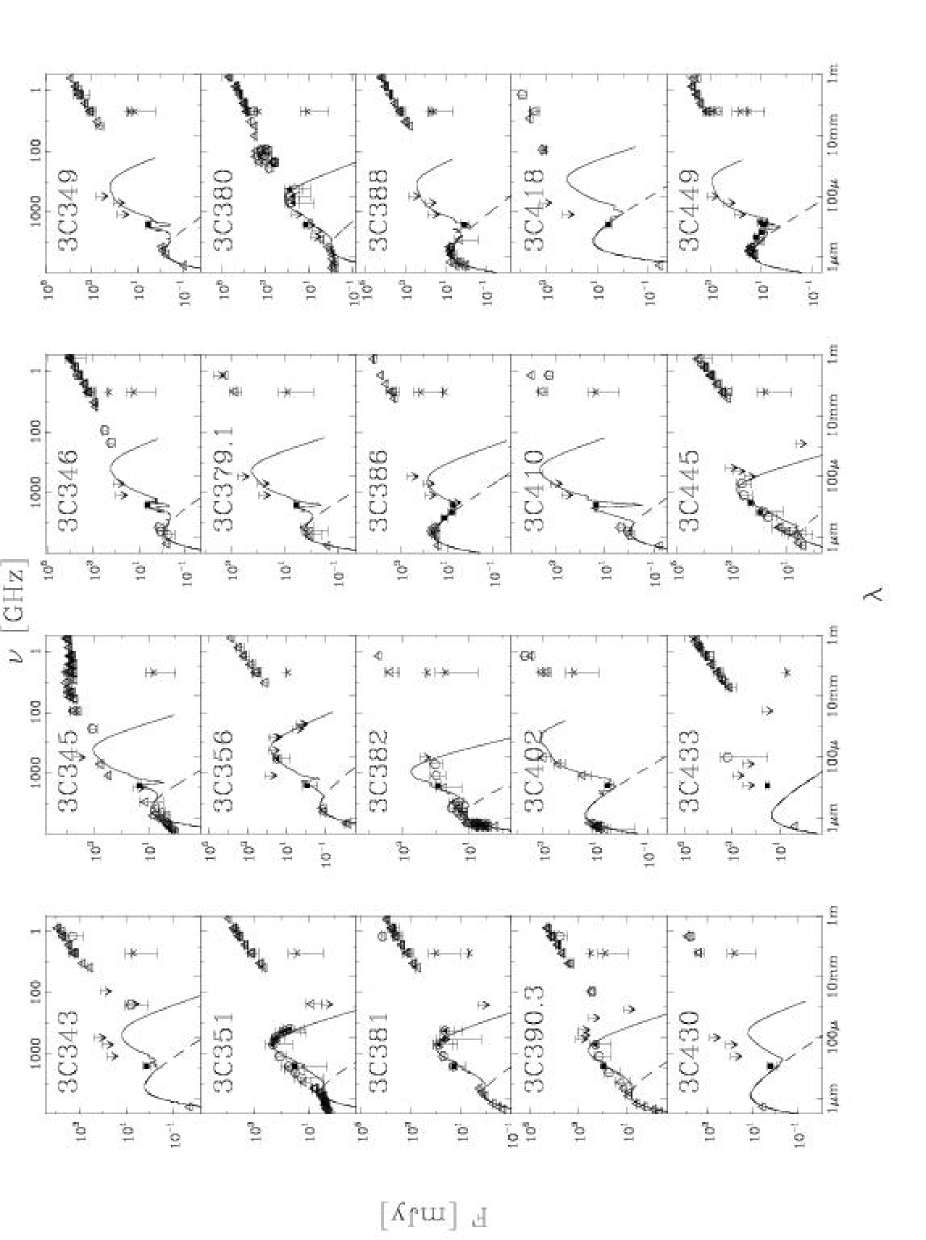
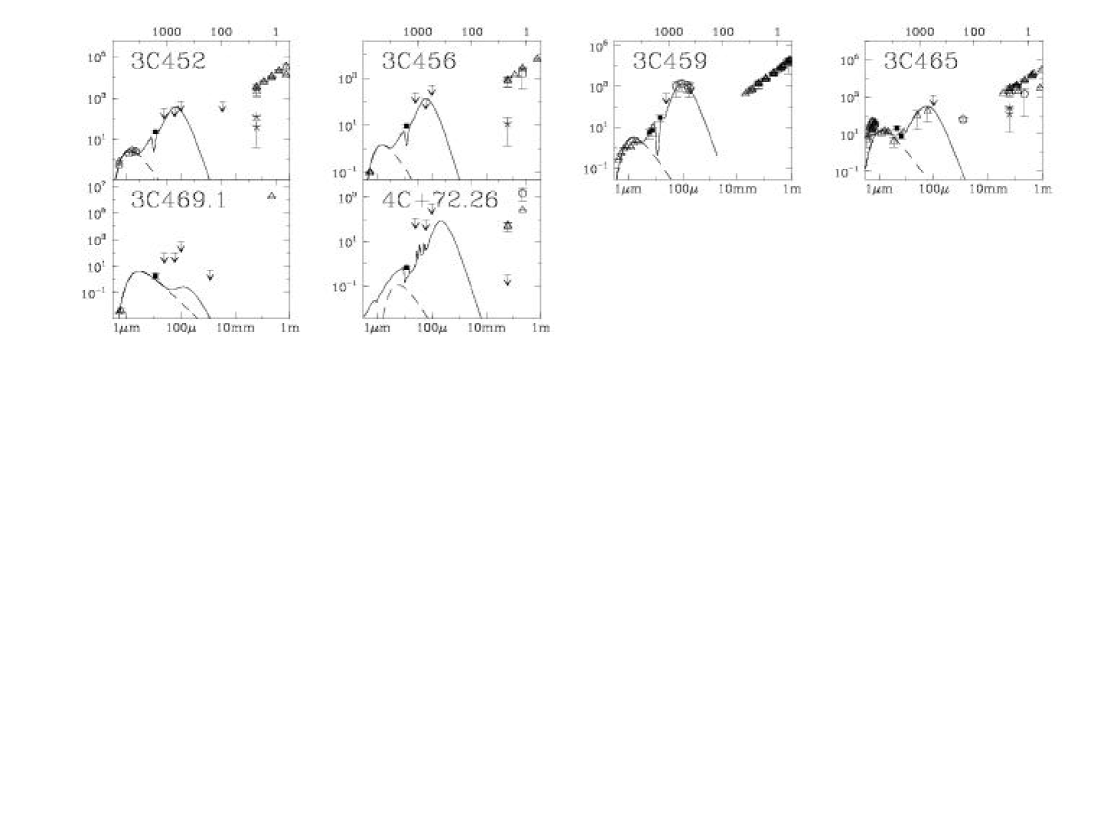
For each detected 3CR source we compiled photometric measurements from optical to radio wavelengths. Our primary source of information was the NASA/IPAC Extragalactic Database (NED). In addition, we availed ourselves of the IRAS fluxes (re-processing raw data with XSCANPI, see NASA/IPAC home page), the ISOPHOT fluxes (Fanti et al. 2000, Meisenheimer et al. 2001, Van Bemmel et al. 2001, Andreani et al. 2002, Spinoglio et al. 2002, Haas et al. 2004), mm/submm continuum data (Krügel et al. 1990, Gear et al. 1994, Steppe et al. 1988, Steppe et al. 1995, Best et al. 1998, Cimatti et al. 1998, Robson et al. 2001, Haas et al. 2004) and 1.4 GHz fluxes from the NRAO VLA Sky Survey (Condon et al. 1998). The resulting observed SEDs are shown in Fig. 3, together with additional information discussed below.
The MIR emission of our radio galaxies may come from synchrotron radiation of the AGNs, stars within the galaxies and dust emission. We assume that bremsstrahlung can be neglected. To identify a synchrotron component at ISOCAM wavelengths, we extrapolated radio core fluxes of the 3CR sources with a power law or, if that was not possible, we assumed a spectral slope as derived from global radio properties. The latter include the core emission (a few arcsecs in size) and the radio lobes which may extend several arcmin. The ISOCAM observations have a resolution of and are centered on the AGNs. Consequently, one has to use radio core fluxes (Giovannini et al. 1988; Hardcastle & Worrall 1999) to avoid an overestimate of the synchrotron component. When such core fluxes were not available, we adopted the core–to–total radio power correlation by Giovannini et al. (2001) to derive some estimate. As can be seen from Fig. 3, the synchrotron contribution to the MIR emission is generally small. One exception is the BL Lac 3C371, which will be neglected in the following.
We assess the significance of the stars by fitting a redshifted K blackbody to the optical and near infrared data and extrapolate it to the MIR. The effective temperature was chosen deliberately low to maximise the effect of the stars at MIR wavelengths. The further interpretation of this curve depends on the size of the optical relative to the ISOCAM image. When they are comparable, we directly subtracted from the ISOCAM flux the extrapolated stellar flux. When the optical observation comprised a much larger region, the stellar component was considered as the upper limit of a stellar component within the ISOCAM aperture. The stellar component is simply added to the emission of the galaxy without any radiative transfer calculations. Indeed, for some of our sources the ISOCAM flux is dominated by stars from the host galaxy (see, for instance, the SED of 3C270 in Fig. 3). To quantify the likely contribution of the dust emission to the ISOCAM fluxes, we present below radiative transfer models of dust enshrouded AGNs.
4 Radiative transfer in dusty AGN
Here we outline an AGN dust model which is based on three free parameters. This simple model seems sufficient to fit the dust emission of the observed SED. After some motivation we present the model of the central engine and of the dust, the parameters and a library of reference SEDs. Then we discuss model properties and the fit to the data. The computation of the dust emission together with the procedure to consider photospheric and synchrotron components provides a tool to specify a likelihood of the detection of dust in radio – loud AGN. Notes on fits of individual sources are given in Appendix B.
4.1 Motivation
In most 3CR objects, the mid and far IR flux cannot arise from stars nor from the radio core because an extrapolation of either component to the infrared fails by orders of magnitude. This confirms the widely held view that the MIR/FIR emission of 3CR sources is often dominated by the dust (Meisenheimer et al. 2001, Van Bemmel et al. 2001, Andreani et al. 2002, Freudling et al. 2003, Haas et al. 2004). As the sources are not optically thin, one has to somehow compute the radiative transfer. In our procedure we self–consistently solve the radiative transfer in spherical symmetry with a ray–tracing method. The heating source of the dust is the central engine, scattering by dust is taken into account. Absorption and scattering efficiencies as well as asymmetry factors of the grains are calculated from Mie theory. The size distribution which the dust grains display is approximated by 8 different grain sizes for carbon and silicate material, respectively. Collisional heating (Contini & Contini 2003) is disregarded. The dust model includes a component of tiny and transiently heated particles. Further details can be found in Siebenmorgen et al. (1992). Observations pertaining to the distribution of dust in 3CR galaxies were performed by Martel et al. (1999) using the HST. Most galaxies could be resolved and dust was found close to the central heating source as well as far (few kpc) from it. Their images imply a complex morphology of the dust obscuration which defies any simple mathematical description. To be computational tractable, a radical simplification of the geometry is needed. As there are only few observational infrared data points for each galaxy, a sophisticated source structure that would require for its specification more parameters than available data points is not warranted. We therefore consider spherical symmetry.
This is, of course, not in agreement with the unified scheme where the AGN is surrounded by an accreting disk or a torus and the phenomenological type is determined by the viewing angle of the observer. Such a configuration is intrinsically, at least, axisymmetric. However, the strongest effect brought about by the torus on the emerging spectrum occurs, of course, at visual and ultraviolet wavelengths. In the infrared, which we try to reproduce, the distance of the dust to the source and its mass are more important. Therefore, when barring the short wavelengths, a sphere can still conserve key elements of a multi–dimensional object. We note also that the angular (not the radial) distribution of the dust is in radiative transfer calculations only of importance when the source is opaque.
The dust distribution in the model is a spherical average over the true distribution. When applied to fitting an observed SED, such a model will tend to overestimate the near infrared emission of a type 2 AGN (edge–on viewed disk), and underestimate it for a type 1 (pole–on oriented disk). Nevertheless, as viewing angles cover a continuous range, in a statistical analysis, one should get about the right amount of cold and hot dust as well as an estimate of their distances from the central heating source.
Another reason to apply here spherically symmetric models stems from the well known difficulty which disks have in explaining the 10m–silicate band. This resonance lies in a spectral region covered by ISOCAM. When viewed face–on, disks should show the feature in emission, contrary to what is observed. Spherical models, on the other hand, are not heavily plagued by this problem as there is always some extinction towards the center. As a third argument we point out that for one of the best known AGNs, in the Circinus galaxy, a spherical model proves as efficient in reproducing the observed infrared SED and the wavelength dependence of the infrared sizes (Siebenmorgen et al. 1997) as do two–dimensional models (Ruiz et al. 2001). The reason lies in the fact that most infrared data are of low spatial resolution.
Previous AGN torus models (e.g. Pier & Krolik 1993, Efstathiou & Rowan–Robinson 1995) do not include the dust in the host galaxy. Such models therefore miss the cold dust altogether. As the apertures of FIR observations are large one has to artifically include in these models a cold component (Farrah et al. 2003), whereas we incorporate it energetically self–consistent. Finally, the dust distribution as derived from HST images (de Koff et al. 2000) has so far never revealed a perfect torus like structure.
4.2 The central engine
The central engine is approximated by a (small) sphere with a power law monochromatic luminosity in the range from 10Å to 2m. The exact lower limit, , should not be important as the dust becomes transparent (Dwek & Smith 1996). The upper limit, , is equally uncertain and represents a synchrotron break. Fortunately, the choice of and has little influence on the final IR spectrum.
4.3 The dust model
The dust consists of large carbon and silicate grains with radii, , between 300 and 2400Å and a size distribution ; very small graphites (Å); and two kinds of PAHs (30 C and 20 H atoms; 252 C and 48 H atoms) which are responsible for various infrared emission bands (see Siebenmorgen et al. (2001) and Siebenmorgen et al. (2004) for details of the dust model).
The contribution of the different dust populations to the AGN spectrum is studied in Fig. 4. For fixed intrinsic luminosity of the AGN L⊙, radius kpc and dust extinction mag we show the SED for three dust models: i) large grains only; ii) large grains and small graphites; iii) all dust components are included (large grains, small graphites and PAHs). Of particular interest for the interpretation of our ISOCAM observations is the MIR. Here dust emission below 6m is due to small graphites which become very hot ( K) after absorption of a single UV photon. The emission between 6 and 9m and near 11.3 and 12.8m is dominated by the PAH bands. Large grains with temperatures K contribute to the emission at wavelengths m. At FIR/submm wavelengths, the emission is entirely due to cold large grains ( K). In summary the entire MIR is dominated by the emission of hot dust which may be either large grains heated to high temperatures, small graphites or PAH.
4.4 Model library
In the spectra displayed in Fig. 3, one can usually make out three components: optical and near infrared emission, probably of stellar origin (m), the mid and far infrared (m m), and the radio regime (m). Our fits concern only the second component which we assume to be due to dust and to originate in the central, few kpc region of galactic nucleus. The optical and radio emission come from totally separated areas and may thus simply be added to the mid and far IR spectrum.
To keep the models and their subsequent interpretation as simple as possible, we consider only three basic parameters: the luminosity, the effective linear size of the galaxy, and the dust (or gas) mass. Furthermore, we adopt a constant dust density. We may then alternatively use as parameters: luminosity , radius , and visual extinction .
We build a set of reference models111The full set of models
is available at:
http://eso.org/~rsiebenm/agn_models by varying ,
and in discrete steps over a wide range. In particular, we change
the luminosity from 108.5 to 1015.25 L⊙, the visual
extinction from 1 to 128 mag and the outer radius of the interstellar
cloud that surrounds the AGN from 0.125 to 16 kpc; the inner radius
of the dust shell is chosen to be close to the evaporation radius of
the grains; a typically number is 1 pc.


4.5 Model properties
In our models, the central engine of the AGN is the sole source for heating the dust. Alternatively, the dust could, at least partially, be heated by a starburst activity. The influence on the spectrum is investigated in Fig. 5 where we compare an AGN with a starburst model. In either model, the visual extinction mag, the luminosity L⊙ and the cloud radius is kpc. In the starburst, all stars have a uniform luminosity and temperature (L⊙, K) and are surrounded by a local dust shell of constant density 104 H-atoms/cm3 (for details of the radiative transfer in a starburst, see Krügel & Siebenmorgen 1994). We see in Fig. 5 that in the SED of a starburst the PAH features and the submillimeter emission are considerably stronger. As our simple AGN model already fit observed spectra of radio–loud quasars (Freudling et al. 2003) we simplify our procedure and ignore in the following any starburst component.
Once we have chosen to use AGN models, there are three basic parameters in our modelling. The AGN luminosity of the models is in most cases well constrained by the data and corresponds to the integrated flux. The total extinction determines absorption features within the spectrum whereas the outer radius of the dust can be used to balance the relative amount of hot and cold dust for a given extinction.
The influence of the extinction, , on the SED is shown in Fig. 6 for three different luminosities and for a fixed radius of 1 kpc. For the same luminosity and radius a high extinction implies strong submillimeter emission, a deep silicate absorption feature at 10m and highly reddened radiation at shorter wavelengths. When the extinction is low, on the other hand, the AGN becomes optically visible, the silicate feature disappears and the submillimeter flux is weak. The SED peak may be used as a measure of the average dust temperature of the bulk material. For the same and value a lower implies a SED peak at shorter wavelengths as compared to models with high . On average, the dust is then much warmer. The bulk material becomes, of course, also warmer when the AGN luminosity increases: models with same extinction and radius show a SED peak shifted to shorter wavelengths at higher luminosities (Fig. 6).


| Name | z | Type | log(Ldust) | Dust ? | ||
|---|---|---|---|---|---|---|
| [L⊙] | [pc] | [mag] | ||||
| 3C006.1 | 0.840 | NLRG/FRII | 11.75 | 16000 | 32 | certain |
| 3C013 | 1.351 | NLRG/FRII | 12.25 | 16000 | 2 | likely |
| 3C017 | 0.220 | BLRG | 11.5 | 125 | 128 | likely |
| 3C018 | 0.188 | BLRG | 12 | 16000 | 32 | certain |
| 3C020 | 0.174 | NLRG/FRII | 11.25 | 2000 | 16 | certain |
| 3C022 | 0.937 | BLRG/FRII | 12.5 | 500 | 8 | possible |
| 3C031 | 0.017 | LERG/FRI | 10 | 125 | 2 | certain |
| 3C033.1 | 0.181 | BLRG/FRII | 11.25 | 125 | 16 | certain |
| 3C048 | 0.367 | QSO | 12.75 | 4000 | 32 | certain |
| 3C061.1 | 0.186 | NLRG/FRII | 11 | 1000 | 16 | certain |
| 3C66B | 0.212 | LERG/FRI | 9.75 | 16000 | 2 | certain |
| 3C071 | 0.004 | NLRG | 11.5 | 2000 | 16 | certain |
| 3C076.1 | 0.032 | LERG/FRI | 9.75 | 16000 | 2 | no evidence |
| 3C079 | 0.256 | NLRG/FRII | 11.75 | 500 | 16 | certain |
| 3C084 | 0.018 | NLRG/FRI | 11.25 | 2000 | 4 | certain |
| 3C098 | 0.031 | NLRG/FRII | 10 | 125 | 32 | certain |
| 3C231 | 0.007 | LERG/FRI | 10.5 | 1000 | 16 | certain |
| 3C249.1 | 0.312 | QSO | 11.75 | 125 | 32 | certain |
| 3C265 | 0.811 | NLRG/FRII | 12.5 | 125 | 64 | certain |
| 3C270 | 0.007 | NLRG/FRI | 8.75 | 2000 | 32 | no evidence |
| 3C272.1 | 0.003 | LERG/FRI | 9 | 500 | 2 | certain |
| 3C273 | 0.158 | QSO | 12.75 | 500 | 1 | possible |
| 3C274 | 0.001 | NLRG/FRI | 9 | 250 | 2 | no evidence |
| 3C277.3 | 0.086 | BLRG | 10.5 | 250 | 1 | certain |
| 3C286 | 0.849 | QSO/ | 12.5 | 8000 | 64 | certain |
| 3C288.1 | 0.961 | QSO | 12.5 | 1000 | 128 | likely |
| 3C293 | 0.045 | LERG/FRI | 10.75 | 8000 | 2 | certain |
| 3C295 | 0.461 | NLRG/FRII | 12.25 | 8000 | 1 | certain |
| 3C296 | 0.461 | LERG/FRI | 10 | 16000 | 8 | likely |
| 3C303.1 | 0.267 | NLRG/FRII | 11.5 | 16000 | 1 | certain |
| 3C305 | 0.041 | NLRG/FRI | 10.75 | 8000 | 1 | certain |
| 3C305.1 | 1.132 | NLRG | 12 | 8000 | 2 | no evidence |
| 3C309.1 | 0.905 | QSO | 12.75 | 250 | 32 | certain |
| 3C319 | 0.192 | LERG/FRII | 11.25 | 8000 | 128 | likely |
| 3C321 | 0.096 | NLRG/FRII | 11.5 | 2000 | 16 | certain |
| 3C324 | 1.206 | NLRG/FRII | 12.25 | 4000 | 8 | certain |
| 3C330 | 0.550 | NLRG/FRII | 11.75 | 125 | 32 | certain |
| 3C332 | 0.152 | BLRG/FRII | 11.25 | 16000 | 2 | certain |
| 3C336 | 0.927 | QSO | 12 | 250 | 4 | certain |
| 3C338 | 0.029 | NLRG/FRI | 10.25 | 16000 | 16 | certain |
| 3C341 | 0.448 | NLRG/FRII | 11.75 | 125 | 2 | certain |
| 3C343 | 0.988 | QSO | 11.75 | 2000 | 16 | possible |
| 3C345 | 0.593 | QSO | 13 | 16000 | 64 | certain |
| 3C346 | 0.161 | NLRG/FRII | 11 | 16000 | 16 | likely |
| 3C349 | 0.205 | NLRG/FRII | 11.25 | 16000 | 32 | certain |
| 3C351 | 0.372 | QSO | 12.25 | 500 | 32 | certain |
| 3C356 | 1.079 | NLRG/FRII | 12.25 | 4000 | 64 | certain |
| 3C371 | 0.051 | BL Lac | 11.5 | 16000 | 32 | no evidence |
| 3C379.1 | 0.256 | RG | 11.5 | 4000 | 64 | certain |
| 3C380 | 0.691 | QSO | 12.5 | 1000 | 32 | certain |
| 3C381 | 0.159 | BLRG/FRII | 11.25 | 250 | 32 | certain |
| 3C382 | 0.058 | BLRG/FRII | 11 | 125 | 2 | certain |
| Name | z | Type | log(Ldust) | Dust ? | ||
|---|---|---|---|---|---|---|
| [L⊙] | [pc] | [mag] | ||||
| 3C386 | 0.017 | LERG/FRI | 9 | 125 | 16 | possible |
| 3C388 | 0.090 | LERG/FRII | 10.75 | 8000 | 64 | no evidence |
| 3C390.3 | 0.056 | BLRG/FRII | 11 | 125 | 4 | certain |
| 3C402 | 0.023 | NLRG | 10 | 16000 | 128 | certain |
| 3C410 | 0.249 | RG | 12.75 | 16000 | 128 | certain |
| 3C418 | 1.686 | QSO | 8.5 | 16000 | 128 | no evidence |
| 3C430 | 0.054 | NLRG | 9 | 250 | 128 | no evidence |
| 3C442 | 0.026 | LERG/FRI | 8.5 | 16000 | 128 | no evidence |
| 3C445 | 0.056 | BLRG/FRII | 11.5 | 125 | 16 | certain |
| 3C449 | 0.017 | BLRG | 9.75 | 8000 | 64 | possible |
| 3C452 | 0.081 | NLRG/FRII | 11 | 250 | 64 | certain |
| 3C456 | 0.233 | LERG | 11.5 | 250 | 64 | certain |
| 3C459 | 0.200 | NLRG/FRII | 12.25 | 2000 | 128 | certain |
| 3C465 | 0.030 | LERG/FRI | 10.25 | 125 | 32 | certain |
| 3C469.1 | 1.336 | LERG/FRII | 8.5 | 16000 | 128 | no evidence |
| 4C+72.26 | 3.532 | RG | 13.5 | 250 | 64 | no evidence |
In Fig. 7 extinction and luminosity are held constant and the influence of the radius, , on the SED is illustrated. We present models with high extinction mag and luminosity L⊙ as well as moderate extinction mag and luminosity L⊙, respectively. When the radius is large, most of the dust is farther away from the AGN and therefore on average much cooler when compared to models with small . When the radius of the model is increased while the extinction is kept fixed more dust is needed for the same submillimeter flux. As the luminosity is constant the MIR emission becomes fainter for models with large and the SED peak is shifted to longer wavelengths.
Another important feature of the SED is the strength of the PAH emission. In Fig. 7 (bottom) one notices that PAH band emission increases for models with increasing cold dust, respectively large radii. If is small the models predict more hot dust and relatively weak or fully absent PAH bands. This is because most of the dust emission originates nearby the central source and only few PAH survive the harsh AGN environment.
To constrain the models one needs MIR and FIR data. The FIR observations shall give a measure of the SED peak emission. We have studied the degeneration of our AGN models. As may be obvious, for sources where the FIR peak is reasonably well known but there is only a single data point in the MIR it is still possible to fit the SED by a combination of low extinction and large radius or vice versa. However, when more MIR data are available the degeneration almost disappears. In particular for galaxies where the ISOCAM data are suited to indicate the depth of the silicate band the models are quite unique. This is because the depth of the silicate absorption is directly related to the visual extinction.
4.6 Fit to Data
We selected models from the AGN library (see Sect. 4.4) which are consistent with the data. First we require that the models smoothed to the ISOCAM bandwidths predict the measured ISOCAM fluxes to within 10% accuracy. Second, we rejected models which violate any upper limit. Of the remaining models, we choose the ones which best fit the optical to FIR/submillimeter data in a least square sense. The optical data can be reasonably approximated by a blackbody of a few thousand K. We therefore assume that they are due to (weakly reddened) stars and this stellar component is fit separately. As a result one obtains the stellar luminosity (see Fig. 8). In 16 out of 69 cases the of the model is mag and then the AGN may also contribute at optical wavelengths. The model flux (AGN) is then subtracted from the measured flux and only the rest is used to evaluate the luminosity of the stars. The models are shown as solid lines in Fig. 3. They fit generally well, exceptions are: 3C273, or 3C382 (see Appendix B for notes on individual fits).
The results of our modelling procedure are summarised in Tab. 4. We specify the name, redshift (as available in NED), type (Veron-Cetty & Veron 2000, Spinrad et al. 1985), infrared dust luminosity (Sect. 4) and specify a likelihood of dust detection. We distinguish four cases:
-
•
No evidence for dust emission is found. ISOCAM and other flux measurements are consistent with a photospheric or synchrotron component.
-
•
Detection of dust emission is possible. ISOCAM photometry is only slightly above the photospheric component and there are only far infrared data close to their detection or confusion limit.
-
•
Detection of dust emission is likely. Here ISOCAM data are well above the predicted photospheric component but there is a possible synchrotron contribution. There are no firm far infrared detections.
-
•
Detection of dust emission is certain. There are reliable infrared detections well above the predicted photospheric component and the contribution by synchrotron or free–free emission can be ruled out.
5 Discussion
5.1 Energy budget: nucleus versus host
First, we compare how the AGN and the stars of the host galaxy contribute to the dust heating. The influence of a central starburst is not considered. One of the three basic parameters of each SED model is the AGN luminosity. In our spherical models, which are all optically thick (), the AGN luminosity is entirely re-radiated by dust in the infrared and it is denoted . The upper panel of Fig. 8 shows the AGN luminosity of all galaxies detected by ISOCAM as a function of redshift. In the lower panel, we divided by the luminosity of all the stars, , in the galaxy. The latter was estimated from the black–body fits of the photospheric component displayed in Fig. 3 and are not de-reddened.
One notes a trend of with which is typical for flux limited samples. As demonstrated in the lower panel of Fig. 8, the AGN luminosity is much higher than the stellar luminosity, , which is concentrated in the near infrared and optical region. The powerful AGN heats the dust not only in its vicinity but throughout the galaxy and acceptable model fits to the observed SEDs were possible only when dust at large (several kpc) distances was included.


5.2 Dust emission and AGN unification
For 27 AGNs of our sample, marked bold face in Tab. 4, there exist enough photometric data to constrain the spectral shape of the dust emission. For a more detailed comparison, we distinguish between galaxies of optical spectral type 1 and 2 and between objects of high ( L⊙) and low ( L⊙) luminosity . Altogether we thus have four classes: 6 BLRGs (type 1), 5 QSOs (type 1), 6 low and 10 high NLRGs (both of type 2). According to the unification scheme, type 1 AGNs are viewed nearly pole–on and have visible broad line region, whereas type 2 AGNs are viewed edge–on, so that the large extinction from the AGN torus obscures the broad-line region.
In Fig.9, we plot for the 27 objects the best fit parameters: radius and visual extinction. AGNs of type 1 occupy the left and those of type 2 the right part of the frame, so the models for them differ foremost by the size parameter or radius . This was already evident from the infrared SEDs in Fig. 7 (bottom) where small model radii correspond to BLRGs and large radii to low luminosity NLRGs. For low luminosities, both NLRGs and BLRGs are fit by moderate extinction ( mag). For high luminosity NLRGs and QSOs, we find higher values of , the averages are and 30 mag, respectively. This trend is reflected for QSOs and high luminosity NLRGs in the top panel of Fig. 7, where SEDs with a radius close to the mean value of both AGN types can be compared.
In summary, the model spectra of BLRGs and QSOs (Fig. 7, bottom) peak at m, whereas high and low luminosity NLRGs attain their maxima much longer wavelengths, around 150 m. Therefore, the dust in AGNs of type 1 is warmer than in those of type 2. This difference is qualitatively consistent with the unification schemes. For type 1 AGNs, which are viewed close to pole–on, the broad–line region is visible and unobscured hot dust dominates the SED. By contrast, towards NLRG, which are viewed face–on, large extinction from the torus obscures the broad–line region and pre-dominantly cooler dust is detected. The type 1 AGNs also show much less PAH emission than type 2. The weakness of the band emission in type 1, compared to type 2, is probably due to PAH destruction. Averages of observed SED are presented by Freudling et al. (2003) confirming the trends indicated in the models presented here.
6 Conclusions
ISOCAM detected 80% (71 out of 88) 3CR sources. We find evidence of hot dust in 53 radio galaxies or 75% of the sources detected in our survey. For each detected source, we compiled photometry from optical to radio wavelengths.
The extrapolation of radio core fluxes to ISOCAM wavelengths shows that synchrotron emission from the core is usually negligible in the MIR, exceptions being flat spectrum radio sources. The contribution of the host galaxy to the MIR is also generally small, here exceptions are a few sources of type FRI. Thus for most objects the origin of the MIR can be attributed mainly to dust. This dust is hot and heated by the central engine. The emission comes from large grains with temperatures of a few hundred Kelvin and small grains and PAHs undergoing temperature fluctuations. This picture is supported by simple radiative transfer calculations. Most SEDs can be successfully fit between 1 and 1000m by a three parameter model where AGN luminosity, size of the galaxy and extinction are varied. Our modelling shows that the broad band data are consistent with AGN only heating of the dust.
For similar luminosities, we compare AGNs of type 1 and 2. We find that the model parameters depend strongly on the AGN type and a dichotomy of the infrared SEDs is derived. The IR fluxes of BLRGs and QSOs peak around 40m while the maximum of the dust emission for NLRGs is reached at m. Therefore, the dust in type 1 AGNs is warmer than in type 2. The models also predict much weaker PAH emission in type 1 AGNs than in type 2, as a result of evaporation. Unfortunately, PAH bands cannot be resolved by the broad–band ISOCAM observations.
AGNs and starbursts are accompanied by tremendous IR luminosities. Although the possible coexistence of both energy sources and their relative contributions to the dust heating is difficult to assess, starbursts tend to favour PAH emission and this may serve as a possible discriminator of activity.
Acknowledgements.
We thank the referee, Cristina Popescu, for constructive and detailed suggestions. Rosario Lorente at the ISO Data Centre for archiving support. Martin Haas thanks for grants from the Nordrhein-Westfälische Akademie der Wissenschaften, funded by the Federal State Nordrhein-Westfalen and the Federal Republic of Germany. This research has made use of the SIMBAD database, operated at CDS, Strasbourg, France and the NASA/IPAC Infrared Science Archive and Extragalactic Database (NED) which is operated by the Jet Propulsion Laboratory, California Institute of Technology, under contract with the National Aeronautics and Space Administration. This publication makes use of data products from the Two Micron All Sky Survey, which is a joint project of the University of Massachusetts and the Infrared Processing and Analysis Center/California Institute of Technology, funded by the National Aeronautics and Space Administration and the National Science Foundation. CIA is a joint development by the ESA Astrophysics Division and the ISOCAM Consortium. The ISOCAM Consortium is led by the ISOCAM PI, C. Cesarsky.References
- (1) Andreani P., Fosbury R. A. E., van Bemmel I., Freudling, W., 2002, A&A 381, 389
- (2) Akujor C.E., Ludke E., Browne I.W.A., Leahy J.P., Garrington S.T., et al., 1994, A&A 105,247
- (3) Akujor C.E., Garrington S. T., 1995, A&AS 112, 235
- (4) Axon D.J., Capetti A., Fanti R., Morganti R., 2000, AJ 120, 2284
- (5) Barthel P.D., 1999, ApJ 336, 606
- (6) Baum S.A., O’Dea C.P., Giovannini G., Biretta J., Cotton, W.B., et al. , 1997, ApJ 483, 178
- (7) Best P.N., Röttgering H.J.A., Bremer M.N., et al., 1998, MNRAS 301, L15
- (8) Best P.N., Longair M.S., Röttgering H.J.A., 1998, MNRAS 295, 549
- (9) Blommaert J., Siebenmorgen R., Coulais A., et al., 2001, “ISO Handbook Volume III (CAM)”, SAI-99-057/Dc, http://www.iso.vilspa.esa.es
- (10) Boisse P., Le Brun V., Bergeron J., Deharveng J.-M., 1998, A&A 333, 841
- (11) Brunetti G., Setti G., Comastri A, 1997, A&A 325, 898
- (12) Canalizo G., Stockton A., 2000, ApJ 528, 201
- (13) Capetti A., De Ruitter H.R., Fanti R., et al., 2000, A&A 362, 871
- (14) Cesarsky C., Abergel A., Agnèse P. et al., 1996, A&A 315, L32
- (15) Cimatti A., Freudling W., Rottgering H.J.A., Ivison R.J., Mazzei P., 1998, A&A 329, 399
- (16) Chambers K.C., Miley G.K., van Breugel W.J.M., Huang J.-S., Trentham A., 1996, ApJS 106, 247
- (17) Colbert J.W., Mulchaey J.S., Zabludoff A.I., 2001, AJ 121, 808
- (18) Condon, W. D., Greisen E.W., Yin Q.F., Perley R.A., et al., 1998, AJ 115, 1693
- (19) Contini M., Contini T., 2003, MNRAS 342, 299
- (20) Coulais A., Abergel A., 2000, A&AAS 141, 533
- (21) Crawford C.S., Fabian A.C., 1996, MNRAS 281, 5
- (22) de Koff S., Baum S.A., Sparks W.B., Golombek D., Biretta J., et al., 1996, ApJS 107, 621
- (23) de Koff S., Best P., Baum S.A., Sparks W., Rottgering H., et al., 2000, ApJS 129, 33
- (24) de Juan L., Colina L., Golombek D., 1996, A&A 305, 776
- (25) de Vaucouleurs G., de Vaucouleurs A. , Corwin H.G., 1976, Second reference catalogue of bright galaxies, Austin University of Texas, Press.
- (26) de Vries W.H., O’Dea C.P., Baum S.A., Sparks W.B., Biretta J., 1997, ApJS 110, 191
- (27) Djorgovski S., Spinrad H., McCarthy P., Dickinson M., van Breugel W., et al., 1988, AJ 96, 836
- (28) Draper P.W., Scarrott S.M., Tadhunter C.N., 1993, MNRAS 262, 1029
- (29) Dwek E., Smith R.K., 1996, ApJ 459, 686
- (30) Efstathiou A., Rowan–Robinson, 1995, MNRAS 273, 649
- (31) Eracleous M., Halpern J.P., 1994, ApJS 90, 1
- (32) Fanti C., Pozzi F, Fanti R., et al., 2000, A&A 358, 499
- (33) Farrah D., Afonso J., Efstathiou, A., et al., 2003, MNRAS 343, 585
- (34) Fernini I, Burns J.O., Bridle A.H., Perley R.A., 1993, AJ 105, 1690
- (35) Ford H. C., Tsvetanov Z. I., Kriss G. A., Harms R., Dressel L., 1994, A&AS 184, 6402
- (36) Freudling W., Siebenmorgen R., Haas M., 2003, ApJL 599, 13
- (37) Gear W.K., Stevens J.A., Hughes D.H., et al. 1994, MNRAS 267, 167
- (38) Giovannini G., Feretti L., Gregorini L., Parma P., 1998, A&A 199, 73
- (39) Giovannini G., Cotton W.D., Feretti L., Lara L., Venturi T., 2001, ApJ 552, 508
- (40) Granato G.L., Danese L., 1994, MNRAS 268, 235
- (41) Hardcastle M.J., Worrall D.M., 1999, MNRAS 309, 969
- (42) Haas M., Müller S. A. H., Bertoldi F., et al., 2004, A&A submitted
- (43) Harms R., Ford H., Tsvetanov Z. I., et al., 1994, ApJ 435, 35
- (44) Harvanek M., Hardcastle M.J., 1998, ApJS 119, 25
- (45) Heckman T.M., O’Dea C.P., Baum S.A., and Laurikainen E. 1994, ApJ 428, 65
- (46) Jackson N., Rawlings S. 1997, MNRAS 286, 241
- (47) Jackson N., Beswick R.J., Pedlar A., et al., 2003, MNRAS 338, 643
- (48) Jaffe W., Ford H., Ferrarese L., van den Bosch F., O’Connell R. W., 1996, ApJ 460, 214
- (49) Katajainen S., Takalo L. O., Sillanp”a”a A., 2000 A&AS, 143, 357
- (50) Kotanyi C.G., Ekers R.D., 1979, A&A 73, L1
- (51) Krügel E., Chini R., Klein U., et al., 1990, A&A 240, 232
- (52) Krügel E., Siebenmorgen R., 1994, A&A 288, 929
- (53) Laing R.A., Jenkins C.R., Wall J.V., Unger S.W., 1994, The First Stromlo Symposium: The Physics of Active Galaxies. ASP Conference Series, Vol. 54, 1994, G.V., 201
- (54) Leahy J.P., Perley R.A., 1991, AJ 102, 537
- (55) Leech K., Pollock A.M.T. , 2001, “ISO Handbok Vol. II”, SAI-99-082/Dc, http://www.iso.vilspa.esa.es
- (56) Lehnert M.D., Miley G.K., Sparks W.B., Baum S.A., Biretta J., 1999, ApJS 123, 351
- (57) Leon S., Lim J., Combes F., Van-Trung D., 2001, astroph/0107498
- (58) Laor A., Draine B.T., 1993, ApJ 402, 441
- (59) Ludke E., Garrington S.T., Spencer R.E., Akujor C.E., Muxlow T. W. B., 1998, MNRAS 299, 467
- (60) Martel A.R., Braun. S.A., Sparks W.B., Wyckoff E., Biretta J.A., et al., 1999, ApJS 122, 81
- (61) McCarthy P. J., Spinrad H., van Breugel, W, 1995, ApJS 99, 27
- (62) McCarthy P. J., Baum S.A., Spinrad H., 1996, ApJS 106, 281
- (63) McCarthy P. J., Miley G.K., de Koff, et al., 1997, ApJS 112, 415
- (64) Meisenheimer K., Haas M., Müller S. A. H., et al., 2001, A&A 372, 719
- (65) Miller J.S., 1981, PASP 93, 681
- (66) Morabito D.D., Preston R.A., Slade M.A., Jauncey D.L., 1982, AJ 87, 1639
- (67) Nenkova M., Ivezic Z., Elitzur M., 2002, ApJ 355, 456
- (68) Neugebauer G., Green R. F., Matthews K., Schmidt M., Soifer B. T., et al., 1987, ApJS 63, 615
- (69) O’Dea P., de Vries W., Biretta J.A., Baum S.A., 1999, AJ 117, 1143
- (70) Okumura K., ISOCAM PSF Report, 1998. http://www.iso.vilspa.esa.es/users/expl_lib/CAM_list.html
- (71) Ott S., Abergel A., Altieri B., et al., 1996, ASAP Conference series, Vol. 125, 1997
- (72) Ott S., Pollock A., Siebenmorgen R., 2000, “The ISOCAM Parallel Mode”, Proc. of a Ringberg Workshop, ISO Surveys of a Dusty Universe, eds: D. Lemke, W. Stickel, K. Wilke, Lecture Notes in Physics, Springer (ISBN 3-540-67479-9), p. 289
- (73) Peng B., Kraus A., Kirchbaum T.P., Witzel A., 2000, A&AS, 145, 1
- (74) Penston M.V., Cannon R.O., 1970, R. Obs. Bull. 159, 85
- (75) Pier A. P., Krolik J.H., 1993, ApJ 418, 673
- (76) Popescu C.C., Tuffs R.J., Kylafis N.D., Madore B.F., 2004, A&A 414, 45
- (77) Rantakyroe F.T., Baath L.B., Backer D.C., et al., 1998, A&AS 131,
- (78) Ridgway S.E., Stockton A., 1997, AJ 114, 511.
- (79) Robson E.I., Stevens J.A., Jenness T., 2001, MNRAS 327, 751
- (80) Roche N., Eales S.A., 1999, MNRAS 317, 120
- (81) Roettgering H.J.A., Lacy M., Miley G. K., Chambers K. C., Saunders R.R, 1994, A&AS 108, 79
- (82) Roman P., Ott S., 1999, Report on the behaviour of ISOCAM LW darks, ESA Technical Report, http://www.iso.vilspa.esa.es/users/expl_lib/CAM_list.html.
- (83) Rowan–Robinson M., 2000, MNRAS 316, 885
- (84) Schmidt M., 1963, Nature 197, 1040
- (85) Siebenmorgen R., Krügel E., Mathis J.S., 1992, A&A 266, 501
- (86) Siebenmorgen R., Moorwood A., Freudling W., Käufl H.U., 1997, A&A 325, 450.
- (87) Siebenmorgen R., Krügel E., Laureijs R., 2001, A&A 377, 735
- (88) Siebenmorgen R., Krügel E., Spoon H.W.W., 2004, A&A 414, 123
- (89) Siebert J., Matsuoka M., Brinkmann W., Cappi M., Mihara T., et al., 1996, A&A 307, 8
- (90) Simpson C., Rawlings S., Lacy M., 1999, MNRAS 306, 828
- (91) Spinoglio L., Andreani P., Malkan M. A., 2002, ApJ 572, 105
- (92) Spinrad H., Djorgovski S., Marr J., Aguilar L., 1985, PASP 97, 932
- (93) Starck, J.L., Siebenmorgen, R. & Gredel, R., 1997, ApJ 482, 1011-1020.
- (94) Starck J.L, Abergel A., Aussel H., Sauvage M., Gastaud R., et al., 1999, A&AAS 134, 135-148.
- (95) Steppe H., Salter C. J., Chini R., et al., 1988, A&AS 75, 317
- (96) Steppe H., Jeyakumar S., Saikia D. J., Salter C. J., 1995, A&AS 113, 409
- (97) Sudou H.,Iguchi S., Murata Y., Taniguchi Y., 2003, Science 300, 1263
- (98) Worrall D. M., Birkinshaw M., 2000, ApJ 530, 719
- (99) Tadhunter C.N, Morganti R., di Serego Alighieri S., Fosbury R. A. E., Danziger I.J., 1993, MNRAS 263, 999
- (100) Taylor G. L., Dunlop J. S., Hughes D. H., Robson E. I., 1996, MNRAS 283, 930
- (101) Urry, C. M., Padovani P., 1995, PASP 107, 803
- (102) Van Bemmel I.M., Barthel P.D., de Graauw T., 2001, A&A 368, 414
- (103) Veron-Cetty M.-P., Veron, P., 2000, A Catalogue of quasars and active nuclei, 9th edition, published by ESO, http://www.iso.vilspa.esa.es/users/expl_lib/CAM_list.html.
- (104) Xu C., Baum S.A., O’Dea C., Wrobel J.M., Condon J.J., 2000, AJ 120, 2950
- (105) Yee H.K.C., Oke J.B., 1978, ApJ 226, 753
- (106) Zirbel E.L., Baum S. A., 1998, ApJS 114, 177
Appendix A Notes on individual galaxies
Our remarks below concern the following points: (1) previous indications of dust, (2) X-ray emission, (3) jets, (4) high excitation line emission, (5) morphology, (6) companions.
3C002 (): Fuzzy optical structure similar to radio morphology (Ridgway & Stockton 1997).
3C006.1 (): There is an optical extension with position angle roughly equal to that of the radio axis (McCarthy et al. 1997).
3C013 (): There are two faint tail-like structures to the south and east of the nucleus. The core radio source is a double with a size of 28′′.
3C017 (): X-ray source (Siebert et al. 1996) with a strong and broad H line (Eracleous & Halpern 1994).
3C018 (): Shows a rich emission line spectrum with extremely high ionization states (Tadhunter et al. 1993).
3C020 (): Two cones of emission and a possibly dust disk are detected by de Koff et al. (2000). The large–scale FR II class radio structure is aligned roughly perpendicular to the proposed dust lane.
3C022 (): From JKL’ images. Simpson et al. (1999) conclude that 80% of the light in a 3′′ aperture is from a weakly reddened (mag) quasar; extended near IR light is presumably photospheric.
3C031 (): Associated with NGC383. HST images show a face–on dust disk with a diameter of 7′′ and an unresolved core (Xu et al. 2000). Martel et al. (1999) confirm an optical synchrotron jet. The molecular gas content is 109 M⊙ (Leon et al. 2001).
3C33.1 (): Broad line radio galaxy in a region of high foreground stellar density (McCarthy et al. 1995). A star is superimposed southeast of the nucleus.
3C048 (): Significant part of the OIII line emission is confined to the 0.5′′ central region (Axon et al. 2000).
3C61.1 (): Narrow-line galaxy.
3C66B (): HST observations confirm an optical synchrotron jet (Martel et al. 1999). Orbital motion in this radio galaxy provides evidence for a supermassive black hole binary (Sudou et al 2003).
3C071 (NGC1068, ): Famous Seyfert 2; MIR images of high spatial resolution are obtained by Siebenmorgen et al. (2004).
3C076.1 (): A galaxy with no optical or near IR features (Colbert et al. 2001).
3C079 (): Narrow H and H lines (Laing et al. 1994).
3C083.1 (NGC1265, ): Edge–on radio galaxy with radio jet and nearly orthogonal narrow dust lane of 1.5 kpc. There is a bright foreground star near the center (Martel et al. 1999).
3C084 (NGC1275, ): Extensively studied giant elliptical galaxy. It has filamentary dust structures which extend out to 17 kpc (de Koff et al. 2000).
3C098 (): Seyfert 2 with extended X–ray emission and a compact central X–ray source (Hardcastle & Worrall 1999). No optical/near IR features (Colbert et al. 2001).
3C231 (M82, ): Archetype starburst galaxy; see Krügel & Siebenmorgen (1994) for a model of the dust emission.
3C249.1 (PG 1100+772, ): Absorption line quasar.
3C264 (): An apparent optical “ring” is claimed to be produced by a circumnuclear dust disk (Baum et al. 1997).
3C265 (): Complex optical structure without a point source at the nucleus. Probably highly obscured AGN (mag, Simpson et al. 1999).
3C270 (NGC4261, ): Quasar with nuclear dust disk perpendicular to the large-scale radio jets (Jaffe et al. 1996). Indication of vigorous star formation around the AGN (Canalizo & Stockton 2000). The quasar suffers little extinction (Leon et al. 2001).
3C272.1 (M84, ): Elliptical galaxy with dust extending out to almost 1 kpc (de Koff et al. 2000).
3C273 (): First discovered QSO (Schmidt 1963).
3C274 (M87, NGC4486, ): It has an ionized disk surrounding the central black hole (Ford et al. 1994, Harms et al. (1994) of M⊙ (Lauer et al. 1992).
3C277.3 (Coma A, ): Elliptical with radio jet.
3C286 (): Contains high excitation line emission (Boisse et al. 1998).
3C288.1 (): Double radio quasar (Akujor et al. 1994).
3C293 (UGC 08782, ): Has a double nuclei core with a steep radio spectrum and filamentary dust lanes (Martel et al. 1999).
3C295 (): Extended double-lobe radio galaxy without a core (Akujor et al. 1994, Fomalont et al. 2000).
3C296 (NGC5532, ): This elliptical galaxy hosts a sub-kiloparsec, elongated and sharp dusty structure centerd on its nucleus (Martel et al. 1999).
3C303.1 (): The nucleus has an elongated shape. The extended radio source is an asymmetric double 1.8′′ in size, elongated perpendicular to two dust lanes (de Koff et al. 2000).
3C305 (): An inclined disc of gas and dust encircling a quasar reddened by has been observed by Jackson et al. (2003).
3C305.1 (): The NED coordinates have an uncertainty of 4′′. In the DSS, a contaminating source is visible 8′′ away. The radio emission of this high-redshift galaxy forms a core–free structure with two lobes separated by .
3C309.1 ([HB89] 1458+718, ): This quasar has a compact steep radio spectrum (Peng et al. 2000) and remains unresolved in the optical (de Vries et al. 1997).
3C319 (): Resembles a normal non-star-forming elliptical with an optical long axis almost perpendicular to the radio axis (Roche & Eales 2000).
3C321 (): Blue, high surface brightness galaxy. The disturbed dust lane with a projected length of 3.7′′ breaks in two components belonging to two merging galaxies (Roche & Eales 2000).
3C324 (): A gravitationally–lensed, extremely elongated high redshift radio galaxy (Chambers et al. 1996) with a steep radio spectrum ( 1.07, Brunetti et al. 1997). It is a ROSAT source with an X–ray luminosity of L⊙ (Hardcastle & Worrall 1999). From SCUBA and Effelsberg observations Best et al. (1998) conclude that the submillimeter signal is not associated with synchrotron emission.
3C330 (): Optically very luminous and relatively blue galaxy. The disk structure is dominated by line emission (McCarthy et al. 1996).
3C332 (): This broad line radio galaxy shows in HST images a smooth elliptical nuclear region (Taylor et al. 1996).
3C336 (PKS 1622+23, ): This source has a large angular radio size (28′′). The brightest ISOCAM pixel is close to the radio source FIRST J162438.8+234505. The latter may be a resolved component of PKS 1622+23.
3C338 (NGC6166, ): Elliptical in the cluster Abell 2199. An arc-like dust feature extends for from the nucleus to the West (Capetti et al. 2000).
3C341 (): As the NED coordinates are uncertain by 3′′, we use coordinates derived from DSS2. Martel et al. (1999) confirm an optical synchrotron jet.
3C343 (): An optically elongated and not very centrally concentrated quasar. The optical and radio emissions may have similar shapes (de Vries et al. 1997).
3C343.1 (): No radio core has been detected (Ludke et al. 1998).
3C345 (): A superluminal optically violently variable quasar (Penston & Cannon 1970, Katajainen et al. 2000). The spectrum is flat for wavelengths 3mm and steepens for mm (Rantakyroe et al. 1998). As NED coordinates are uncertain by 3′′ we use for astrometry the VLA map by Leahy & Perley (1991).
3C346 (): Narrow-line radio galaxy showing both extended and compact X-ray emission (Hardcastle & Worrall 1999). In the optical there is a jet and a bright core (de Koff et al. 1996). We ignore deviant fluxes by Morabito et al. (1982).
3C349 (): There are two companions, a faint filament suggests an interaction within the triple (Roche & Eales 2000).
3C351 (): Radio-loud QSO of moderate X-ray luminosity. The spectrum from 0.3–10.1m can be fitted with a broken power law (Neugebauer et al. 1987).
3C356 (): In the optical, there are two nuclei 5′′ apart (McCarthy et al. 1995, 1997) and both are detected in the radio (Eales & Rawlings 1990, Fernini et al. 1993). We identify the one which is brighter in the K band with the nucleus of the radio source. 3C356 is detected at X–rays with ROSAT (Hardcastle & Worrall 1999, Crawford & Fabian 1996).
3C368 (): The spectrum from radio to optical wavelengths can be fit by a power-law with a break in the infrared. There are two knots emitting synchrotron emission in the optical (O’Dea et al. 1999). Near infrared spectroscopy by Jackson & Rawlings (1997) shows that the nucleus is contaminated by a galactic M star.
3C371 (): BL Lac object with an unresolved HST point source (Martel et al. 1999).
3C379.1 (): Shows extended OIII emission over a scale of 9′′ (McCarthy et al. 1995).
3C380 (): There are two optical hot spots coinciding with radio peaks (Ludke et al. 1998). Therefore, the optical hot spots probably originate from synchrotron radiation (de Vries et al. 1997).
3C381 (): Shows extended OIII emission on a scale of 20′′ (McCarthy et al. 1995). There is a low surface brightness companion 5.5′′ away (Roche & Eales 2000).
3C382 (): A classic broad-lined radio galaxy whose optical luminosity is dominated by an extremely blue AGN (Roche & Eales 2000).
3C386 (): An elliptical with a compact optical nucleus. There are two point sources of similar magnitude away from the nucleus. They might be faint foreground stars or small companion galaxies (Martel et al. 1999).
3C388 (): This radio galaxy has an unresolved optical nucleus (Martel et al. 1999) and two companions with a nuclear separation of 7′′ (Roche & Eales 2000). The X–ray images show significant diffuse emission (Hardcastle & Worrall 1999).
3C390.3 (): A double-lobed, broad line blazar (Fomalont et al. 2000) detected also at X–rays (Hardcastle & Worrall 1999). The optical band is dominated by a nuclear point source (Martel et al. 1999).
3C401 (): A radio galaxy with a double nucleus (separation 3.6′′) and several neighbours (Roche & Eales 2000).
3C402 (): An elliptical galaxy with an FR I morphology and a double radio nucleus. There is a massive nuclear disk of gas and dust (De Juan et al. 1996).
3C410 (): An elliptical with an optical jet candidate (de Koff et al. 1996).
3C418 (): Has several nearby but faint companions (Lehnert et al. 1999).
3C430 (): An elliptical with a narrow, arc-shaped dust lane that slices the core (Martel et al. 1999).
3C433 (): For the near infrared we use the data of 2MASXi J2123445+250427. The absorption map by de Koff et al. (2000) shows patchy dust features.
3C442 (): A galaxy pair interacting with NGC7237 (De Vaucouleurs et al. 1976).
3C445 (): A broad emission line object (Eracleous & Halpern 1994) with an unresolved nucleus (Martel et al. 1999).
3C449 (): A low–power radio galaxy with multiple X–ray components and a nearby companion (Worrall & Birkinshaw 2000). Leon et al. (2001) derived from CO a molecular gas mass of 2.3 M⊙. The HST images reveals a 5′′ inner disk–like feature (Zirbel & Baum 1998).
3C452 (): de Koff et al. (2000) find indication of a faint dust lane near the nucleus. The radio source has a bright core and two lobes.
3C454.1 (): This source appears in the radio as a double with no core (Ludke et al. 1998). In the optical continuum one sees two nuclear condensations separated by 2′′ (Djorgovski et al. 1988).
3C456 (): The radio core of this FR II galaxy lies within 1′′ of the optical core position (Harvanek & Hardcastle 1998). The near IR shows extended emission (de Vries et al. 1997).
3C459 (): This steep spectrum ULIRG (IRAS 23140+0348) shows optical absorption features suggestive of young stellar populations (Miller 1981) and broad wings on both H and H (Yee & Oke 1978). In the optical there are two polarisation components (Draper et al. 1993) none of which coincide with the radio axis. The radio emission (Condon et al. 1998) is extended to only (48kpc).
3C465 (NGC7720, ): HST reveals a dusty kpc-size disk (Martel et al. 1999) which is roughly perpendicular to the radio jets (de Koff et al. 2000).
3C469.1 (): There is a double nucleus in the optical not aligned with the radio axis (McCarthy et al. 1997).
4C+72.26 (): The galaxy with the greatest red shift in our sample.
NGC5532NED02 ( 0.0237): As no redshift is found in NED we use the value for NGC5532 (3C296).
NGC7236 (): A peculiar radio galaxy merging with NGC7237. It is also detected at X–ray (Hardcastle & Worrall 1999).
PMN J0214-1158 (): A large high redshift radio source with a steep radio spectrum; simple double morphology and jet signatures (Roettgering et al. 1994).
IRAS F 17130+5021 (): A galaxy pair 15′′ away associated with 2MASXi J 1714167+501816.
Appendix B Notes on individual fits
3C006.1: Evidence for dust comes from ISOCAM 12m (this work) and weak millimeter detection by Haas et al. (2001). Evidence for hot dust comes from ISOCAM only.
3C013 and 3C017: Fitting the visible and ISOCAM data points by a Planck function requires a rest frame temperature of 2600 K. If one allows for moderate reddening of mag the temperature would rise to 2900 K. Such a value is still lower than the expected mean stellar temperature in the galaxy and therefore the presence of hot dust is likely.
3C018:
3C018: IRAS fluxes suggests AV larger than 30mag. Evidence for hot dust from ISOCAM only.
3C020: Evidence for hot dust by ISOCAM.
3C022: Fitting the visible and ISOCAM data points by a Planck function requires a rest frame temperature of 3000 K. If one allows for moderate reddening of mag in the galaxy the temperature would rise to 3600 K. Such a value is compatible to a normal stellar population. However, near IR imaging (Simpson et al. 1999) suggests a possible detection of dust.
3C031: ISOCAM emission comes from a compact region of about 8′′ whereas the shown optical data are the magnitudes of the whole galaxy (180′′). The MIR emission of the stars are therfore only a small contribution to the ISOCAM fluxes. Evidence for hot dust by ISOCAM.
3C033.1, 3C048 and 3C061.1: Evidence for dust by ISOCAM and ISOPHOT.
3C66B: Evidence for hot dust comes from ISOCAM data.
3C079: Evidence for dust from ISOCAM and ISOPHOT.
3C083.1: Star superposed just 3′′ southeast of the nucleus makes modelling of this galaxy impossible.
3C098: Evidence for hot dust from ISOCAM only.
3C231: M82 starburst model as described by Krügel & Siebenmorgen (1994).
3C249.1: Evidence for dust from ISOCAM and ISOPHOT.
3C265: Evidence for dust from ISOCAM only.
3C270: No evidence of dust from ISOCAM.
3C272.1: Evidence for dust from ISOPHOT only (Haas et al. 2001).
3C273: Possible hot dust detection by ISOCAM.
3C274: No evidence of dust from ISOCAM.
3C277.3: Evidence for dust from ISOCAM only.
3C286: Evidence for hot dust by ISOCAM only.
3C288.1: IRAS 60 m maybe due to confusion. Likely detection of hot dust by ISOCAM.
3C293: Evidence for hot dust from ISOCAM only.
3C295: Evidence for dust from ISOCAM and ISOPHOT.
3C296: IRAS 100 m maybe due to confusion. Likely detection of hot dust by ISOCAM.
3C303.1: Fitting the visible and ISOCAM data points by a Planck function requires a rest frame temperature of 2600 K. If one allows for moderate reddening of mag the temperature would rise to 2900 K. Such a value is still lower than the expected mean stellar temperature in the galaxy. Evidence for dust from ISOCAM and ISOPHOT.
3C305: Evidence for dust by ISOCAM and ISOPHOT.
3C309.1: Evidence for dust by ISOCAM and ISOPHOT.
3C319: Likely detection of hot dust by ISOCAM.
3C321: Evidence for dust from ISOCAM and ISOPHOT.
3C324: Evidence of hot dust from ISOCAM only.
3C330: Evidence for dust from ISOCAM only.
3C332: Evidence for hot dust from ISOCAM only.
3C336: Evidence for hot dust from ISOCAM only.
3C338: Evidence for dust from IRAS only.
3C341: Evidence for dust from ISOCAM only.
3C343: Possible detection of dust by ISOCAM only.
3C345: Evidence for hot dust from ISOCAM only.
3C346: Evidence for dust from ISOCAM only. Large deviation with ISOPHOT 12 m fluxes given by Haas et al. (2001).
3C349: Evidence for dust from ISOCAM only.
3C351: Evidence for dust from ISOCAM and ISOPHOT.
3C356: Evidence for dust from ISOCAM and ISOPHOT.
3C371: No evidence for dust since the contribution of the synchrotron radiation to the ISOCAM data is unclear.
3C379.1: Evidence for dust by ISOCAM only.
3C380: The measured radio core flux is similar to the total radio emission, so that the synchrotron component, interpolated to the IR, is strong. Still the ISOCAM detection gives evidence of dust emission.
3C381: Evidence for dust from ISOCAM and ISOPHOT.
3C386: Evidence for dust from ISOCAM at 14.3m only.
3C401: In the infrared/submillimeter there are only upper limits which hints to model this galaxy.
3C402: ISOCAM emission comes from a compact region of about 9′′ whereas the shown optical data are the magnitudes of the whole galaxy (55′′). The MIR emission of the stars is therefore only a small contribution to the ISOCAM fluxes. Evidence for dust from ISOPHOT (Haas et al. 2001) only.
3C410: Evidence for dust from ISOCAM only.
3C442: ISOCAM emission comes from a compact region () whereas the shown optical data are the magnitudes of the whole galaxy (130′′). The MIR emission of the stars is therefore only a small contribution to the ISOCAM fluxes. Weak 12m detection might be still photospheric. No evidence for dust.
3C449: ISOCAM emission comes from a compact region of about 7′′ whereas the shown optical data are the magnitudes of the whole galaxy (90′′). The MIR emission of the stars is therefore only a small contribution to the ISOCAM fluxes. Evidence for dust comes from ISOCAM only.
3C449: Evidence for hot dust from ISOCAM only.
3C452: Evidence for dust comes from ISOCAM only.
3C456: Fitting the visible and ISOCAM data points by a Planck function requires a rest frame temperature of 2300 K. If one allows for moderate reddening of mag the temperature would rise to 2600 K. Such a value is still lower than the expected mean stellar temperature in the galaxy. Evidence for dust from ISOCAM only.
3C459: Evidence for dust from ISOCAM and ISOPHOT.
3C465: ISOCAM emission comes from a compact region of about 10′′ whereas the shown optical data are the magnitudes of the whole galaxy (180′′). The MIR emission of the stars is therefore only a small contribution to the ISOCAM fluxes. Evidence for hot dust from ISOCAM only.
3C469.1: Evidence for dust from ISOCAM and ISOPHOT.
4C+72.26: Our highest redshift quasar (z=3.532). The photospheric contribution is unknown, so that there is yet no evidence for dust. The model is not well constrained by the sparse infrared/submillimeter data.
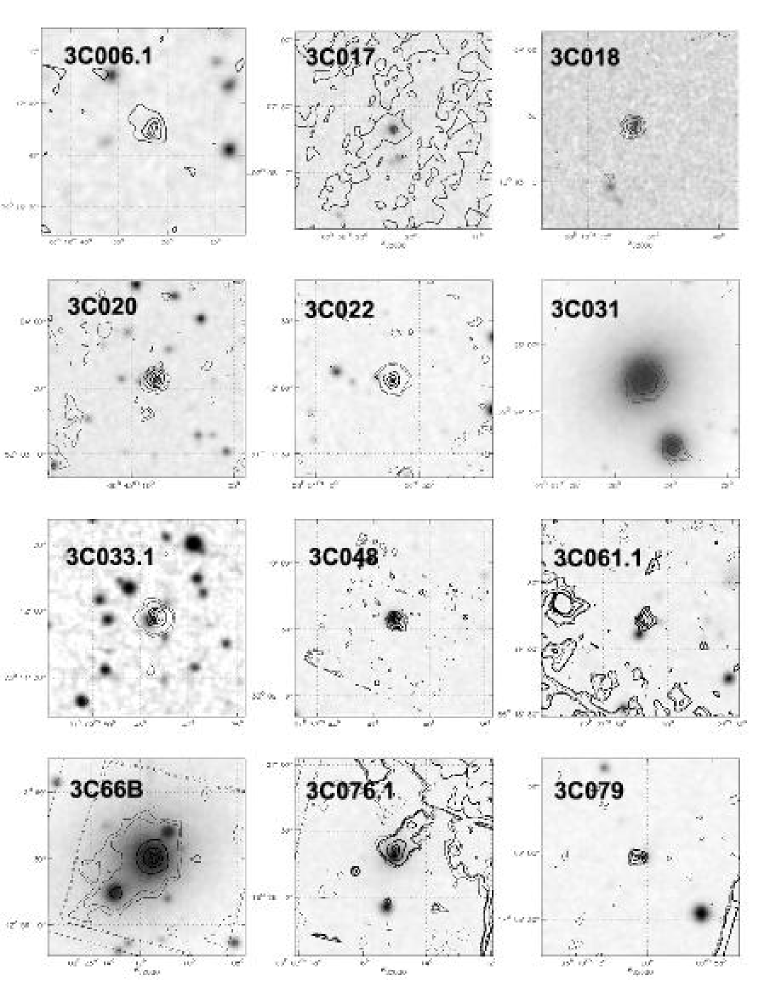
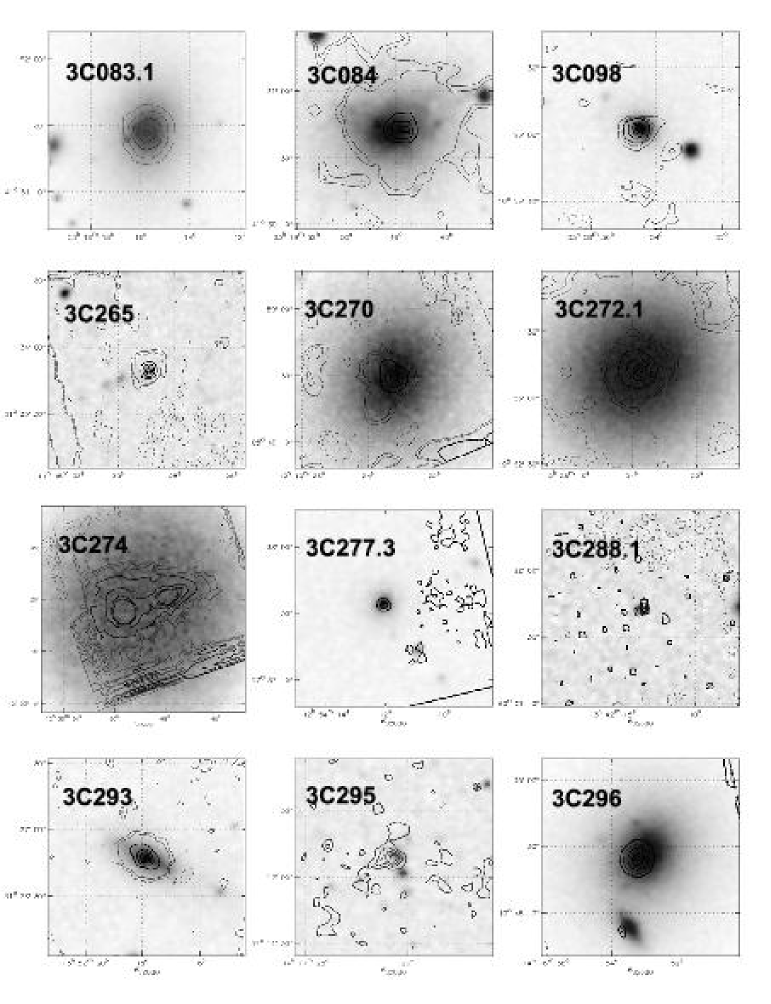
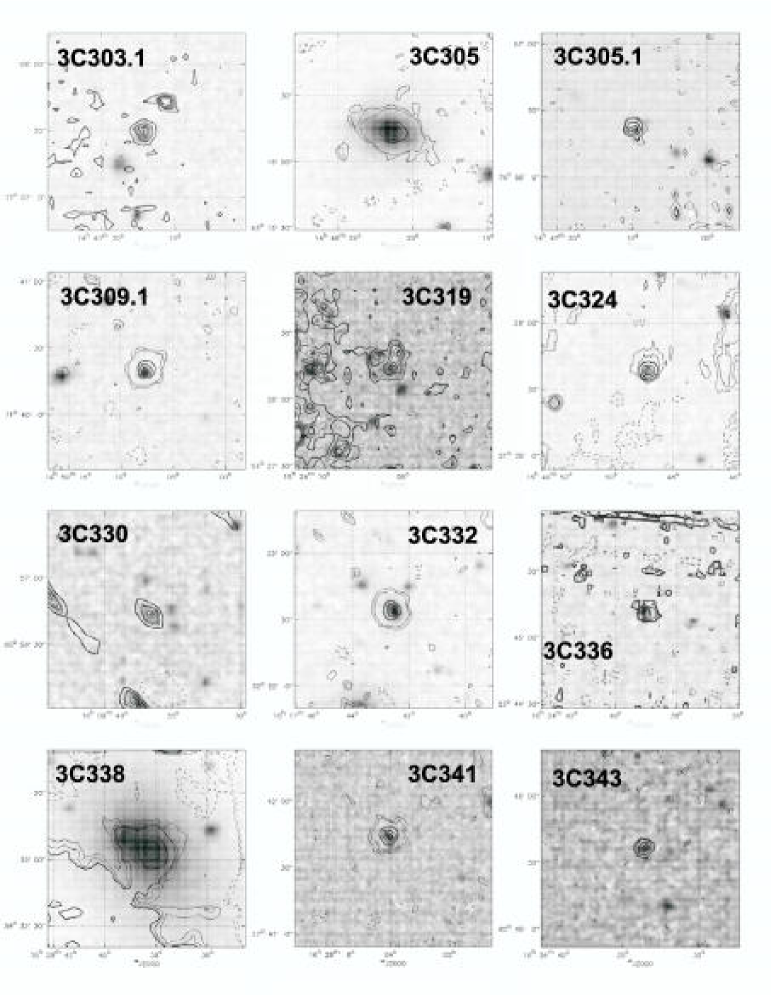
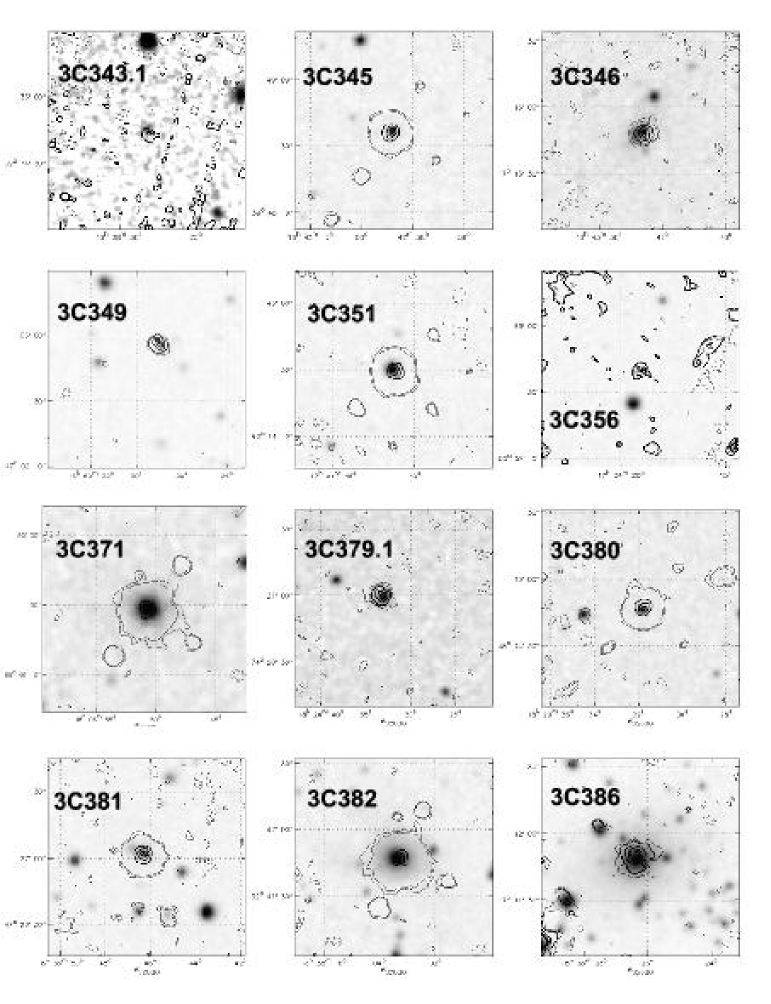
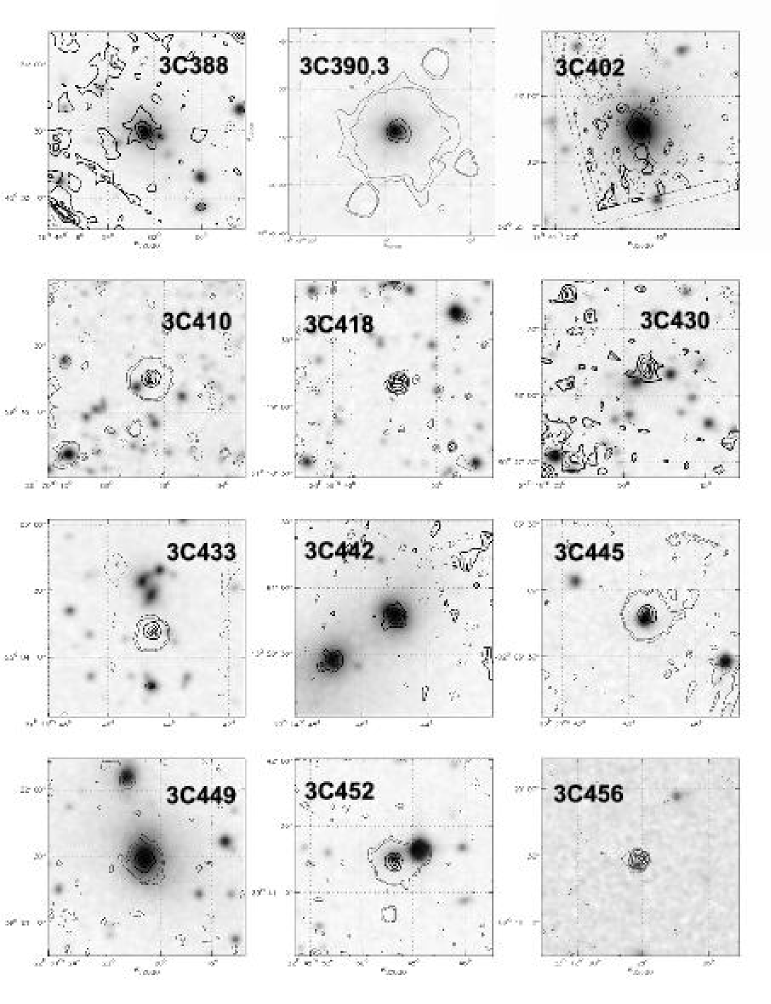
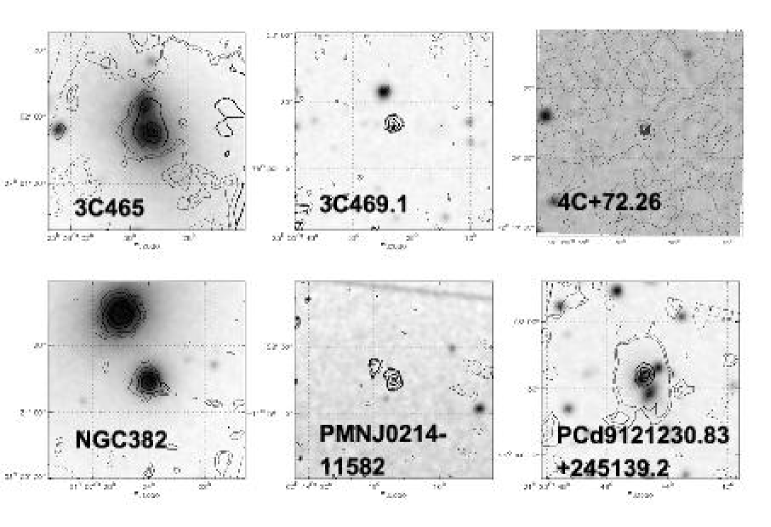
| 1 | 2 | 3 | 4 | 5 | 6 | 7 | 8 | 9 | 10 | 11 | 12 |
| TDT | RA | Dec | Date | Filter | Lens | ||||||
| J2000.0 | UT | ′′ | ′′ | ′′ | |||||||
| 08800387 | 15 11 03.6 | +07 49 52.9 | 13.02.96 | LW10 | 6 | 2 | 2 | 180 | 180 | 8 | 2 |
| 10200421 | 18 05 06.7 | +11 01 31.2 | 27.02.96 | LW3 | 1.5 | 2 | 2 | 13.5 | 13 | 51 | 2 |
| LW2 | 1.5 | 2 | 2 | 13.5 | 13 | 51 | 2 | ||||
| 10601408 | 16 28 38.6 | +39 33 07.0 | 02.03.96 | LW3 | 3 | 3 | 3 | 9 | 9 | 16 | 2 |
| LW1 | 3 | 3 | 3 | 9 | 9 | 12 | 5 | ||||
| 12300106 | 09 55 51.7 | +69 40 45.9 | 19.03.96 | CVF | 3 | 1 | 1 | 0 | 0 | 25 | 2 |
| 12300205 | 14 49 21.5 | +63 16 13.6 | 19.03.96 | LW3 | 3 | 3 | 3 | 15 | 15 | 49 | 2 |
| LW2 | 1.5 | 3 | 3 | 7.5 | 7 | 18 | 2 | ||||
| 14301909 | 14 36 37.1 | +63 19 13.8 | 08.04.96 | LW10 | 3 | 5 | 5 | 144 | 144 | 44 | 5 |
| 14302010 | 14 36 37.1 | +63 19 13.8 | 08.04.96 | LW10 | 3 | 5 | 5 | 144 | 144 | 44 | 5 |
| 18001405 | 14 11 20.6 | +52 12 08.6 | 15.05.96 | LW3 | 3 | 4 | 4 | 144 | 144 | 30 | 10 |
| LW2 | 3 | 4 | 4 | 144 | 144 | 30 | 10 | ||||
| 21305001 | 11 04 13.8 | +76 58 57.3 | 17.06.96 | CVF | 6 | 1 | 1 | 0 | 0 | 14 | 10 |
| 22201802 | 11 45 28.6 | +31 33 49.1 | 26.06.96 | LW2 | 3 | 5 | 5 | 9 | 9 | 13 | 10 |
| 22400303 | 11 45 28.6 | +31 33 49.1 | 28.06.96 | LW10 | 3 | 7 | 7 | 6 | 6 | 15 | 10 |
| 22400201 | 11 45 28.6 | +31 33 49.1 | 27.06.96 | LW1 | 3 | 5 | 5 | 9 | 9 | 19 | 10 |
| 22801205 | 12 19 23.2 | +05 49 29.4 | 02.07.96 | LW3 | 3 | 3 | 3 | 9 | 9 | 12 | 2 |
| LW2 | 3 | 3 | 3 | 9 | 9 | 12 | 2 | ||||
| 23100414 | 12 25 03.7 | +12 53 14.0 | 05.07.96 | LW7 | 3 | 5 | 5 | 9 | 9 | 4 | 5 |
| LW3 | 3 | 5 | 5 | 9 | 9 | 4 | 5 | ||||
| LW2 | 3 | 5 | 5 | 9 | 9 | 3 | 20 | ||||
| 23502406 | 12 25 03.6 | +12 53 14.1 | 09.07.96 | LW1 | 6 | 2 | 2 | 108 | 108 | 25 | 5 |
| 23800308 | 12 30 49.4 | +12 23 28.1 | 12.07.96 | LW1 | 6 | 2 | 2 | 108 | 108 | 25 | 5 |
| LW2 | 3 | 2 | 2 | 54 | 54 | 18 | 5 | ||||
| LW3 | 6 | 2 | 2 | 108 | 108 | 23 | 2 | ||||
| 23901834 | 12 30 48.6 | +12 23 33.0 | 13.07.96 | LW10 | 1.5 | 3 | 3 | 4.5 | 4 | 10 | 5 |
| 24100504 | 12 28 46.8 | +02 08 07.9 | 14.07.96 | LW3 | 1.5 | 1 | 1 | 0 | 0 | 508 | 5 |
| LW2 | 1.5 | 1 | 1 | 0 | 0 | 629 | 5 | ||||
| 24201104 | 12 45 38.4 | +03 23 20.3 | 16.07.96 | LW10 | 3 | 5 | 5 | 144 | 144 | 27 | 5 |
| 24407233 | 13 42 13.2 | +60 21 42.0 | 18.07.96 | LW10 | 3 | 2 | 2 | 60 | 60 | 5 | 10 |
| 24500106 | 12 54 12.0 | +27 37 33.5 | 18.07.96 | LW3 | 3 | 3 | 3 | 15 | 15 | 45 | 5 |
| LW2 | 1.5 | 3 | 3 | 7.5 | 7 | 22 | 5 | ||||
| 27000606 | 14 16 52.8 | +10 48 23.0 | 13.08.96 | LW2 | 3 | 3 | 3 | 9 | 9 | 12 | 2 |
| LW3 | 3 | 3 | 3 | 9 | 9 | 12 | 2 | ||||
| 27503920 | 14 36 43.1 | +15 44 13.0 | 17.08.96 | LW10 | 3 | 5 | 5 | 144 | 144 | 32 | 5 |
| 30300511 | 15 49 48.9 | +21 25 38.8 | 14.09.96 | LW1 | 3 | 5 | 5 | 9 | 9 | 36 | 10 |
| 30300612 | 15 49 48.9 | +21 25 38.8 | 14.09.96 | LW2 | 3 | 5 | 5 | 9 | 9 | 22 | 10 |
| 30400442 | 16 24 39.0 | +23 45 13.0 | 15.09.96 | LW10 | 3 | 2 | 2 | 60 | 60 | 5 | 10 |
| 30492200 | 16 24 39.5 | +23 45 00.6 | 16.09.96 | LW2 | 6 | 1 | 1 | 0 | 0 | 6 | 25.2 |
| 33600323 | 16 09 36.5 | +65 56 49.0 | 17.10.96 | LW3 | 6 | 4 | 4 | 504 | 504 | 24 | 10 |
| LW2 | 6 | 4 | 4 | 504 | 504 | 24 | 10 | ||||
| 35200533 | 19 59 25.8 | +40 44 11.0 | 02.11.96 | LW2 | 1.5 | 3 | 3 | 4.5 | 4 | 9 | 10 |
| 35701635 | 21 23 44.5 | +25 04 10.0 | 08.11.96 | LW2 | 3 | 4 | 4 | 9 | 9 | 8 | 10 |
| 36701710 | 22 31 20.5 | +39 21 30.0 | 18.11.96 | LW3 | 3 | 3 | 3 | 9 | 9 | 13 | 2 |
| LW2 | 3 | 3 | 3 | 9 | 9 | 13 | 2 | ||||
| 37403041 | 22 31 20.5 | +39 21 30.0 | 25.11.96 | LW10 | 6 | 4 | 4 | 36 | 36 | 9 | 10 |
| 37500303 | 23 16 34.5 | +04 05 17.4 | 25.11.96 | LW1 | 6 | 1 | 1 | 0 | 0 | 12 | 5 |
| LW4 | 6 | 1 | 1 | 0 | 0 | 12 | 5 | ||||
| LW6 | 6 | 1 | 1 | 0 | 0 | 12 | 5 | ||||
| LW3 | 6 | 1 | 1 | 0 | 0 | 12 | 5 | ||||
| 38600922 | 16 24 39.5 | +23 45 00.6 | 10.07.97 | LW2 | 6 | 1 | 1 | 0 | 0 | 7 | 25.2 |
| 38800808 | 13 31 08.2 | +30 30 33.0 | 08.12.96 | LW10 | 3 | 1 | 1 | 0 | 0 | 206 | 2 |
| 39501112 | 23 38 29.4 | +27 01 54.0 | 15.12.96 | LW3 | 3 | 3 | 3 | 9 | 9 | 16 | 2 |
| LW2 | 3 | 3 | 3 | 9 | 9 | 16 | 2 |
| 1 | 2 | 3 | 4 | 5 | 6 | 7 | 8 | 9 | 10 | 11 | 12 |
| TDT | RA | Dec | Date | Filter | Lens | ||||||
| J2000.0 | UT | ′′ | ′′ | ′′ | |||||||
| 39901248 | 16 38 28.1 | +62 34 44.0 | 19.12.96 | LW10 | 3 | 2 | 2 | 60 | 60 | 5 | 10 |
| 40100319 | 14 36 43.1 | +15 44 13.0 | 21.12.96 | LW10 | 3 | 5 | 5 | 144 | 144 | 32 | 5 |
| 40201422 | 01 07 27.4 | +32 24 08.0 | 22.12.96 | LW2 | 6 | 3 | 3 | 36 | 36 | 9 | 10 |
| 41907203 | 00 06 22.6 | 00 04 25.0 | 08.01.97 | LW10 | 3 | 2 | 2 | 60 | 60 | 5 | 10 |
| 43502724 | 02 23 11.5 | +42 59 30.0 | 24.01.97 | LW2 | 3 | 2 | 3 | 9 | 9 | 8 | 10 |
| 43901804 | 01 37 41.2 | +33 09 35.3 | 29.01.97 | LW3 | 1.5 | 2 | 2 | 22.5 | 22 | 20 | 5 |
| 45304902 | 02 23 11.5 | +42 59 30.0 | 11.02.97 | LW3 | 3 | 3 | 3 | 9 | 9 | 10 | 2 |
| LW1 | 3 | 3 | 3 | 9 | 9 | 8 | 5 | ||||
| 46300408 | 14 49 21.5 | +63 16 14.0 | 21.02.97 | LW1 | 3 | 3 | 3 | 9 | 9 | 8 | 5 |
| 46601603 | 03 03 15.0 | +16 26 16.0 | 24.02.97 | LW2 | 3 | 3 | 3 | 9 | 9 | 8 | 2 |
| LW3 | 3 | 3 | 3 | 9 | 9 | 9 | 2 | ||||
| LW1 | 3 | 3 | 3 | 9 | 9 | 7 | 5 | ||||
| 47100710 | 18 38 25.4 | +17 11 52.0 | 01.03.97 | LW2 | 3 | 3 | 3 | 9 | 9 | 15 | 2 |
| LW3 | 3 | 3 | 3 | 9 | 9 | 15 | 2 | ||||
| 49604639 | 19 41 42.8 | +50 36 36.7 | 26.03.97 | LW10 | 3 | 3 | 3 | 72 | 72 | 15 | 5 |
| 50304334 | 18 33 45.9 | +47 27 01.2 | 02.04.97 | LW10 | 3 | 3 | 3 | 72 | 72 | 15 | 5 |
| 51100561 | 16 28 38.3 | +39 33 04.5 | 10.04.97 | LW10 | 3 | 3 | 3 | 72 | 72 | 15 | 5 |
| 51100679 | 16 42 58.7 | +39 48 36.7 | 10.04.97 | LW10 | 3 | 3 | 3 | 72 | 72 | 15 | 5 |
| 51301035 | 18 38 26.3 | +17 11 49.5 | 12.04.97 | LW10 | 3 | 3 | 3 | 72 | 72 | 15 | 5 |
| 51400760 | 14 49 21.8 | +63 16 14.0 | 13.04.97 | LW10 | 3 | 3 | 3 | 72 | 72 | 15 | 5 |
| 51800103 | 17 14 11.9 | +50 16 60.0 | 17.04.97 | LW10 | 6 | 11 | 11 | 198 | 198 | 12 | 5 |
| 51800667 | 17 10 44.0 | +46 01 29.1 | 17.04.97 | LW10 | 3 | 3 | 3 | 72 | 72 | 15 | 5 |
| 51800831 | 17 28 20.1 | +31 46 01.9 | 17.04.97 | LW10 | 3 | 3 | 3 | 72 | 72 | 15 | 5 |
| 52100668 | 17 24 19.3 | +50 57 36.1 | 20.04.97 | LW10 | 3 | 3 | 3 | 72 | 72 | 15 | 5 |
| 52100804 | 17 14 11.9 | +50 16 60.0 | 20.04.97 | LW10 | 6 | 11 | 11 | 198 | 198 | 12 | 5 |
| 52201845 | 21 23 44.0 | +25 04 31.1 | 21.04.97 | LW10 | 3 | 3 | 3 | 72 | 72 | 15 | 5 |
| 52201948 | 21 44 11.6 | +28 10 18.7 | 21.04.97 | LW10 | 3 | 3 | 3 | 72 | 72 | 15 | 5 |
| 52500130 | 17 04 41.3 | +60 44 30.1 | 24.04.97 | LW10 | 3 | 3 | 3 | 72 | 72 | 15 | 5 |
| 52500429 | 16 59 28.8 | +47 02 55.4 | 24.04.97 | LW10 | 3 | 3 | 3 | 72 | 72 | 15 | 5 |
| 52500562 | 18 35 03.3 | +32 41 46.9 | 24.04.97 | LW10 | 3 | 3 | 3 | 72 | 72 | 15 | 5 |
| 52900115 | 14 43 14.6 | +77 07 27.6 | 28.04.97 | LW10 | 3 | 3 | 3 | 72 | 72 | 15 | 5 |
| 52900417 | 15 10 23.0 | +70 45 52.8 | 28.04.97 | LW10 | 3 | 3 | 3 | 72 | 72 | 15 | 5 |
| 52901232 | 18 06 50.5 | +69 49 29.9 | 28.04.97 | LW10 | 3 | 3 | 3 | 72 | 72 | 15 | 5 |
| 52901433 | 18 24 32.8 | +74 20 57.2 | 28.04.97 | LW10 | 3 | 3 | 3 | 72 | 72 | 15 | 5 |
| 52901537 | 18 42 08.7 | +79 46 17.8 | 28.04.97 | LW10 | 3 | 3 | 3 | 72 | 72 | 15 | 5 |
| 52902663 | 21 04 06.3 | +76 33 11.8 | 28.04.97 | LW10 | 3 | 3 | 3 | 72 | 72 | 15 | 5 |
| 53200838 | 19 40 24.9 | +60 41 36.7 | 01.05.97 | LW10 | 3 | 3 | 3 | 72 | 72 | 15 | 5 |
| 53503041 | 20 20 06.5 | +29 42 13.6 | 04.05.97 | LW10 | 3 | 3 | 3 | 72 | 72 | 15 | 5 |
| 53503146 | 21 23 16.2 | +15 48 05.6 | 04.05.97 | LW10 | 3 | 3 | 3 | 72 | 72 | 15 | 5 |
| 53503288 | 21 47 25.1 | +15 20 33.8 | 04.05.97 | LW10 | 3 | 3 | 3 | 72 | 72 | 15 | 5 |
| 53702750 | 22 14 46.8 | +13 50 27.1 | 06.05.97 | LW10 | 3 | 3 | 3 | 72 | 72 | 15 | 5 |
| 53702911 | 22 14 46.9 | +13 50 27.0 | 06.05.97 | LW3 | 3 | 3 | 3 | 9 | 9 | 15 | 2 |
| 53702911 | 22 14 46.9 | +13 50 27.0 | 06.05.97 | LW2 | 3 | 3 | 3 | 9 | 9 | 15 | 2 |
| 54000949 | 21 55 52.1 | +38 00 29.4 | 09.05.97 | LW10 | 3 | 3 | 3 | 72 | 72 | 15 | 5 |
| 54100619 | 15 24 04.8 | +54 28 05.2 | 10.05.97 | LW10 | 3 | 3 | 3 | 72 | 72 | 15 | 5 |
| 54100836 | 18 44 02.3 | +45 33 30.3 | 10.05.97 | LW10 | 3 | 3 | 3 | 72 | 72 | 15 | 5 |
| 54100969 | 18 29 31.7 | +48 44 46.3 | 10.05.97 | LW10 | 3 | 3 | 3 | 72 | 72 | 15 | 5 |
| 54101870 | 20 38 36.8 | +51 19 12.1 | 10.05.97 | LW10 | 3 | 3 | 3 | 72 | 72 | 15 | 5 |
| 54301344 | 21 18 19.0 | +60 48 08.2 | 12.05.97 | LW10 | 3 | 3 | 3 | 72 | 72 | 15 | 5 |
| 54500518 | 22 23 49.5 | 02 06 12.3 | 14.05.97 | LW2 | 3 | 1 | 1 | 0 | 0 | 43 | 2 |
| LW3 | 3 | 1 | 1 | 0 | 0 | 49 | 2 | ||||
| 54700854 | 23 12 28.1 | +09 19 27.6 | 16.05.97 | LW10 | 3 | 3 | 3 | 72 | 72 | 15 | 5 |
| 54801053 | 22 45 48.7 | +39 41 16.6 | 17.05.97 | LW10 | 3 | 3 | 3 | 72 | 72 | 15 | 5 |
| 54801112 | 22 31 20.5 | +39 21 30.0 | 17.05.97 | LW1 | 3 | 3 | 3 | 9 | 9 | 8 | 5 |
| 1 | 2 | 3 | 4 | 5 | 6 | 7 | 8 | 9 | 10 | 11 | 12 |
| TDT | RA | Dec | Date | Filter | Lens | ||||||
| J2000.0 | UT | ′′ | ′′ | ′′ | |||||||
| 54801252 | 22 31 20.5 | +39 21 29.4 | 17.05.97 | LW10 | 3 | 3 | 3 | 72 | 72 | 15 | 5 |
| 55500476 | 18 06 50.8 | +69 49 30.0 | 24.05.97 | LW3 | 3 | 1 | 1 | 0 | 0 | 109 | 2 |
| 56001074 | 22 50 32.9 | +71 29 19.0 | 29.05.97 | LW10 | 3 | 3 | 3 | 72 | 72 | 15 | 5 |
| 56201064 | 23 55 23.0 | +79 55 18.7 | 31.05.97 | LW10 | 3 | 3 | 3 | 72 | 72 | 15 | 5 |
| 56201411 | 02 22 36.2 | +86 19 07.6 | 31.05.97 | LW10 | 3 | 3 | 3 | 72 | 72 | 15 | 5 |
| 56500458 | 23 38 29.4 | +27 01 53.3 | 03.06.97 | LW10 | 3 | 3 | 3 | 72 | 72 | 15 | 5 |
| 56501357 | 23 21 28.5 | +23 46 47.2 | 03.06.97 | LW10 | 3 | 3 | 3 | 72 | 72 | 15 | 5 |
| 57502102 | 00 38 20.5 | 02 07 40.8 | 13.06.97 | LW10 | 3 | 3 | 3 | 72 | 72 | 15 | 5 |
| 58703793 | 01 07 24.9 | +32 24 44.9 | 25.06.97 | LW10 | 3 | 3 | 3 | 72 | 72 | 15 | 5 |
| 58703801 | 01 07 25.0 | +32 24 45.2 | 25.06.97 | LW3 | 3 | 3 | 3 | 9 | 9 | 9 | 2 |
| 59501620 | 15 31 25.4 | +35 33 40.5 | 03.07.97 | LW10 | 3 | 3 | 3 | 72 | 72 | 15 | 5 |
| 59601514 | 02 14 17.4 | 11 58 46.2 | 04.07.97 | LW10 | 3 | 8 | 8 | 36 | 36 | 13 | 5 |
| 59601615 | 02 14 17.4 | 11 58 46.2 | 04.07.97 | LW10 | 3 | 8 | 8 | 36 | 36 | 12 | 5 |
| 59702305 | 00 43 09.2 | +52 03 33.7 | 05.07.97 | LW10 | 3 | 3 | 3 | 72 | 72 | 15 | 5 |
| 59702607 | 01 09 44.3 | +73 11 57.6 | 05.07.97 | LW10 | 3 | 3 | 3 | 72 | 72 | 15 | 5 |
| 60001373 | 16 09 34.6 | +65 56 37.7 | 08.07.97 | LW10 | 3 | 3 | 3 | 72 | 72 | 15 | 5 |
| 60001472 | 14 59 07.5 | +71 40 19.5 | 08.07.97 | LW10 | 3 | 3 | 3 | 72 | 72 | 15 | 5 |
| 60009220 | 14 59 13.5 | +71 40 26.9 | 08.07.97 | LW2 | 6 | 1 | 1 | 0 | 0 | 7 | 25.2 |
| 60201626 | 16 28 03.8 | +27 41 38.6 | 10.07.97 | LW10 | 3 | 3 | 3 | 72 | 72 | 15 | 5 |
| 60201725 | 16 17 42.8 | +32 22 28.6 | 10.07.97 | LW10 | 3 | 3 | 3 | 72 | 72 | 15 | 5 |
| 61503617 | 03 19 48.2 | +41 30 42.4 | 23.07.97 | LW2 | 6 | 2 | 2 | 108 | 108 | 25 | 5 |
| 61503807 | 03 10 00.3 | +17 05 54.0 | 23.07.97 | LW10 | 3 | 1 | 1 | 0 | 0 | 61 | 2 |
| 61701307 | 13 52 17.8 | +31 26 47.0 | 25.07.97 | LW2 | 3 | 3 | 3 | 9 | 9 | 8 | 2 |
| LW3 | 3 | 3 | 3 | 9 | 9 | 9 | 2 | ||||
| 61701413 | 13 52 17.8 | +31 26 46.4 | 25.07.97 | LW10 | 3 | 3 | 3 | 72 | 72 | 15 | 5 |
| 61900565 | 16 34 33.7 | +62 45 36.2 | 27.07.97 | LW10 | 3 | 3 | 3 | 72 | 72 | 15 | 5 |
| 61901003 | 00 40 50.3 | +10 03 23.4 | 27.07.97 | LW10 | 3 | 3 | 3 | 72 | 72 | 15 | 5 |
| 63301602 | 02 42 40.7 | 00 00 47.3 | 10.08.97 | LW1 | 3 | 2 | 2 | 36 | 36 | 247 | 2 |
| 63301902 | 02 42 40.7 | 00 00 47.3 | 10.08.97 | LW5 | 3 | 2 | 2 | 36 | 36 | 247 | 2 |
| 63302202 | 02 42 40.7 | 00 00 47.3 | 10.08.97 | LW9 | 3 | 2 | 2 | 36 | 36 | 266 | 2 |
| 63302405 | 03 58 54.7 | +10 25 47.0 | 10.08.97 | LW2 | 3 | 3 | 3 | 9 | 9 | 9 | 2 |
| LW3 | 3 | 3 | 3 | 9 | 9 | 8 | 2 | ||||
| 64001327 | 16 43 48.7 | +17 15 49.3 | 17.08.97 | LW10 | 3 | 3 | 3 | 72 | 72 | 15 | 5 |
| 65800208 | 15 31 42.7 | +24 04 24.7 | 03.09.97 | CVF | 3 | 1 | 1 | 0 | 0 | 33 | 2 |
| 65901032 | 03 18 15.7 | +41 51 27.0 | 05.09.97 | LW2 | 3 | 4 | 4 | 9 | 9 | 9 | 10 |
| 65901304 | 03 18 15.7 | +41 51 27.0 | 05.09.97 | LW3 | 3 | 3 | 3 | 9 | 9 | 9 | 2 |
| 70101081 | 00 16 31.1 | +79 16 41.5 | 16.10.97 | LW10 | 3 | 3 | 3 | 72 | 72 | 15 | 5 |
| 71200283 | 18 05 06.3 | +11 01 31.2 | 27.10.97 | LW2 | 1.5 | 1 | 1 | 0 | 0 | 83 | 5 |
| LW3 | 1.5 | 1 | 1 | 0 | 0 | 80 | 5 | ||||
| 71702771 | 14 47 08.9 | +76 56 19.6 | 01.11.97 | LW10 | 3 | 3 | 3 | 72 | 72 | 15 | 5 |
| 74101506 | 19 08 23.7 | +72 20 11.8 | 25.11.97 | LW10 | 3 | 8 | 8 | 36 | 36 | 18 | 5 |
| 75300580 | 16 09 36.5 | +65 56 42.7 | 07.12.97 | LW3 | 6 | 20 | 3 | 228 | 18 | 15 | 5 |
| 75300681 | 16 09 36.5 | +65 56 42.7 | 07.12.97 | LW3 | 6 | 20 | 3 | 228 | 18 | 15 | 5 |
| 75300779 | 16 09 36.5 | +65 56 42.7 | 07.12.97 | LW3 | 6 | 20 | 3 | 228 | 18 | 15 | 5 |
| 75400182 | 16 09 36.5 | +65 56 42.7 | 08.12.97 | LW3 | 6 | 20 | 3 | 228 | 18 | 15 | 5 |
| 78500882 | 00 50 56.2 | +51 12 03.8 | 08.01.98 | LW10 | 3 | 3 | 3 | 72 | 72 | 15 | 5 |
| 80201405 | 03 18 12.1 | 25 35 09.0 | 25.01.98 | LW10 | 3 | 6 | 6 | 72 | 72 | 15 | 5 |
| 80201507 | 03 18 12.1 | 25 35 09.0 | 25.01.98 | LW10 | 3 | 6 | 6 | 72 | 72 | 14 | 5 |
| 80801283 | 00 34 14.7 | +39 24 13.7 | 31.01.98 | LW10 | 3 | 3 | 3 | 72 | 72 | 15 | 5 |