Low mass stars, brown dwarf candidates and the mass function of the young open cluster NGC 2547
Abstract
We present a catalogue of photometry over an area of 0.855 square degrees, centred on the young open cluster NGC 2547. The survey is substantially complete to limits of , , . We use the catalogue to define a sample of NGC 2547 candidates with model-dependent masses of about 0.05-1.0 . After correcting for incompleteness and estimating contamination by foreground field dwarfs, we investigate the mass function of the cluster, its binary content, and search for evidence of mass segregation among the lower mass stars. There is ample evidence for mass segregation between high () and lower mass stars, but over the range , the data are consistent with no further mass segregation. By fitting King profiles we conclude that at least 60 percent of the low-mass stellar population are contained within our survey. The cluster mass function is remarkably similar to the Pleiades for . Because of its age ( Myr), we demonstrate that this mass function is robust to a number of systematic uncertainties likely to affect older and younger clusters and is therefore one of the best available estimates for the initial mass function in young disc populations. For there is some evidence for a deficit of brown dwarfs in NGC 2547 compared with other clusters. This deficit may extend to lower masses or may only be a dip, perhaps caused by an imperfect understanding of the mass-magnitude relationship at temperatures of around 2800 K. Incompleteness in both our survey, and the luminosity functions from which we estimate contamination by foreground objects, leave this question open. The binary fraction for systems with mass ratios greater than about 0.5 is 20-35 per cent for M-dwarfs in NGC 2547, quite consistent with that found in the field and other young clusters. The full photometric catalogue and our lists of candidate cluster members are made available in electronic format.
keywords:
techniques: photometric – methods: data analysis – open clusters and associations: individual: NGC 2547 – stars: formation – stars: pre-main-sequence1 INTRODUCTION
The open cluster NGC 2547 (= C0809-491) is important for efforts to understand the formation and evolution of low-mass, pre-main-sequence (PMS) stars. Its isochronal age is about 30 Myr, it is relatively close ( 400–450 pc), has low reddening () and a rich population of identified early and late-type members (see Clariá 1982; Jeffries, Totten & James 2000; Naylor et al. 2002 – hereafter N02). Being close and quite compact it serves as an ideal laboratory to investigate evolutionary tracks and isochrones, rotation rates, magnetic activity and light element abundances of low-mass PMS stars as they approach the ZAMS. In particular, NGC 2547 occupies an important and comparatively little studied niche of parameter space with an age between those of regions of recent star formation, and clusters like the Pleiades, where low-mass stars have already reached the zero-age main-sequence (ZAMS).
Jeffries & Tolley (1998) first identified the low-mass PMS population of NGC 2547 as counterparts to ROSAT X-ray sources. A number of these counterparts were positively identified as F to K-type cluster members by Jeffries et al. (2000) using radial velocities. A photometric study of NGC 2547 was presented by N02. Their survey covered an approximately square area of 0.32 square degrees and identified several hundred candidate cluster members with masses from 6 down to about 0.25 at . N02 concluded that the mass function (MF) was similar in shape to that of the Pleiades and of field stars over this mass range, but that the total mass of NGC 2547 could be a few times less than the Pleiades. Littlefair et al. (2003) have used the same list of candidate members to show that stars with mass in NGC 2547 are much more centrally concentrated than lower mass objects. Because NGC 2547 is no more than 10 dynamical crossing times old, it seems likely that most of this segregation must be primordial (e.g. Bonnell et al. 2001), rather than due to dynamical evolution.
The N02 survey did not cover a sufficiently large area or go to sufficient depths to discover whether the spatial distribution of low-mass () cluster members was independent of mass. The possibility of differential mass segregation between lower mass stars is important. Some recent theories concerning the formation of very low-mass stars and brown dwarfs suggest they are ejected as low-mass fragments from protostellar multiple systems before they have a chance to accrete significant material (e.g. Reipurth & Clarke 2001). Such objects may have a greater velocity dispersion than their higher mass siblings and hence be less spatially concentrated in a cluster (Sterzik & Durisen 2003). This in turn would mean that a cluster MF measured over a limited volume would understimate the contribution from the lowest mass stars and brown dwarfs. However, alternative simulations of brown dwarf formation (e.g. Bate, Bonnell & Bromm 2003) predict that the initial velocity dispersions of low mass stars and brown dwarfs will be similar and little mass segregation or preferential evaporation of very low-mass objects would be expected prior to full dynamical relaxation.
In this paper we present a new photometric survey of NGC 2547. This survey is deeper than that of N02, extending to just below the substellar boundary, encompassing the “turnover” of the observed MF seen in the field and in the Pleiades at (see Chabrier 2003 and references therein). The new survey also covers a wider area (0.855 square degrees) allowing us to explore the question of mass segregation among lower mass cluster candidates in more detail. The observational data and analysis are presented in section 2. The selection of candidate cluster members and an evaluation of completeness and contamination are addressed in section 3. In section 4 we evaluate the mass segregation, luminosity and mass functions for NGC 2547. We discuss the results and draw our conclusions in sections 5 and 6.
2 OBSERVATIONS AND DATA ANALYSIS
2.1 Observations
| Field | Field Center (J2000) | Exposures (s) | ||||
|---|---|---|---|---|---|---|
| R.A. | Dec. | |||||
| 01 | 08 12 20.6 | -49 34 00 | 6200 | 5100 | 3300 | |
| 02 | 08 11 16.3 | -49 34 00 | 7200 | 7100 | 3300 | |
| 03 | 08 10 12.0 | -49 34 00 | 5200 | 5100 | 3300 | |
| 04 | 08 09 07.7 | -49 34 00 | 6200 | 5100 | 2300 | |
| 06 | 08 08 03.4 | -49 23 30 | 6200 | 5100 | 3300 | |
| 07 | 08 09 07.7 | -49 23 30 | 6200 | 5100 | 3300 | |
| 08 | 08 10 12.0 | -49 23 30 | 6200 | 7100 | 4300 | |
| 09 | 08 11 16.3 | -49 23 30 | 6200 | 6100 | 3300 | |
| 10 | 08 12 20.6 | -49 23 30 | 6200 | 5100 | 3300 | |
| 11 | 08 12 20.6 | -49 13 00 | 3100 | 3300 | ||
| 12 | 08 11 16.3 | -49 13 00 | 6300 | 3100 | 3300 | |
| 13 | 08 10 12.0 | -49 13 00 | 7200 | 3100 | 4200 | |
| 14 | 08 09 07.7 | -49 13 00 | 7200 | 3100 | 4200 | |
| 15 | 08 08 03.4 | -49 13 00 | 6200 | 5100 | 3300 | |
| 16 | 08 08 05.3 | -49 03 08 | 6200 | 5100 | 3300 | |
| 17 | 08 09 07.7 | -49 02 30 | 6200 | 5100 | 3300 | |
| 18 | 08 10 12.0 | -49 02 30 | 6200 | 5100 | 3300 | |
| 19 | 08 11 16.3 | -49 02 30 | 6200 | 5100 | 3300 | |
| 20 | 08 12 20.6 | -49 02 30 | 6200 | 5100 | 3300 | |
| 22 | 08 11 16.3 | -48 52 00 | 6200 | 5100 | 3300 | |
| 23 | 08 10 12.0 | -48 52 00 | 6200 | 5100 | 3300 | |
| 24 | 08 09 07.7 | -48 52 00 | 6200 | 5100 | 3300 | |
| 51 | 08 04 50.6 | -48 31 00 | 6200 | 5100 | 3300 | |
| 52 | 08 15 33.4 | -49 55 30 | 6200 | 5100 | 3300 | |
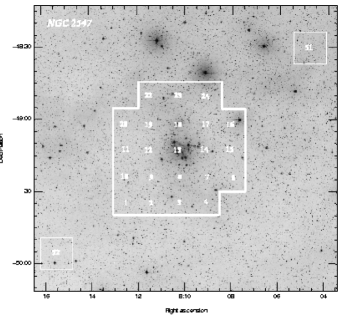
The observations were obtained between 4 February 1999 and 9 February 1999 inclusive, using a CCD mounted at the Cassegrain focus of the 0.91-m telescope of the Cerro Tololo Interamerican Observatory. The camera had a field of view of approximately square arcminutes. The dataset consists of multiple exposures of 24 overlapping fields taken using each of a Harris filter, a Kron-Cousins filter and a Gunn filter. The approximate field centres and a log of the separate exposures obtained are listed in Table 1. Seeing varied between 0.9 and 2.0 arcsec in the individual frames (with a median of 1.3 arcsec and standard deviation of 0.2 arcsec). Exposure times were adjusted a little to achieve a reasonably uniform sensitivity across the mosaic. The area covered is illustrated in Fig. 1 and covers 0.855 square degrees in total. Two of the individual fields are situated about a degree from the cluster centre but along a line of constant galactic latitude. We intended to use these fields as a check on the field contamination present in the photometrically selected cluster candidates.
Individual images were bias subtracted (overscan subtracted and then a median of overscan-subtracted bias frames was subtracted) and flat-fielded using twilight sky flats from the same observing night. The frames were affected by fringing of night sky spectral lines. We dealt with these by constructing a median image from all the sky-subtracted frames taken during the run. This “fringe-frame” was then multiplied by a constant and subtracted from each of the individual frames. The constant was modified iteratively until the mean absolute deviation in the sky was minimised and approached the nominal value expected from the sky signal and gain of the CCD. After this procedure no visible trace of the fringing pattern could be discerned.
The CCD was affected by a number of bad columns and pixels. We also found that occasional images were affected by 27 bad rows at the bottom of the CCD. Bad pixel masks were constructed for all frames and used in the subsequent reduction. The bad pixels were replaced with the median of surrounding pixels. It is worth emphasizing that these patched pixels were used in the initial source searching of the summed frames, but the final combined photometry uses only stellar images with no patched pixels where possible.
2.2 Photometric calibration
Photometric calibration was achieved with reference to measurements of Landolt (1992) standard fields taken on a number of occasions on each night. The flux from standard stars was measured inside a 6 arcsecond radius aperture and sky subtracted using the median sky measured in a much larger annulus.
The and values listed in Landolt (1992) were used to find a weighted least squares solution to the following equations on each night
| (1) |
| (2) |
where and are instrumental magnitudes (corrected for exposure time), and are extinction coefficients, is the airmass of an observation, and are photometric zeropoints, is a colour term to take into account any mismatch between the filter we used and the Cousins system, and is a similar term for the colour.
For our best photometric night (7 February 1999) we obtained a solution with , , , . The rms discrepancy from this fit using 26 points was 0.04 mag in and 0.02 mag in . The addition of about 0.02 mag in quadrature to the instrumental and uncertainties leads to a reduced chi-squared of 1. However, only two standards with were measured and one of these (SA 98-L5) has quite uncertain colours. Systematic errors of up to 0.1 mag in the colours and magnitudes cannot be ruled out for stars with , although it is encouraging that the colour terms in equations 1 and 2 are small and the residuals to the fits at do not suggest any non-linearities in the calibration.
There is no equivalent of the Landolt standards for the colour. Instead we used observations of stars in Landolt field SA 98 which have had their colours defined by Zapatero-Osorio et al. (1999), along with two early A stars from Landolt field SA 99 for which we assumed that . Using an equation of the form
| (3) |
we found and , with an rms discrepancy of less than 0.01 mag from 9 points.
These coefficients were applied to 5 of our fields which were taken on the same night and in an airmass range comparable to the standards (fields 1, 2, 6, 7, 10) . These fields were considered “photometric” in a normalisation procedure that uses the considerable (2-3 arcminute) overlaps between the fields (described below and in more detail by N02). The remaining fields were put onto the standard system using the same coefficients, but their zeropoints were allowed to vary in the normalisation procedure.
2.3 Photometry and astrometry in the cluster
From the processed CCD frames the analysis proceeded using the cluster software suite described in detail by N02. In brief, this consisted of searching for objects in the summed I-band image of each field. A signal-to-noise ratio threshold of 5 was used for the search. Shifts between each frame and the summed I-band image were parameterised with a 6-coefficient solution, and optimal photometry (see Naylor 1998) of each object performed in each individual frame at fixed positions determined from the summed I-band image. Bright, unsaturated stars in each frame were used to derive the “profile correction”, which was applied to the optimal photometry values to place them onto the system defined by the aperture photometry of standard stars. The profile correction was successfully modelled as a quadratic function of the horizontal and vertical coordinates in each frame.
Profile-corrected photometry measurements were adjusted for differences in the airmass of each frame, weighted by their statistical errors and combined. Additional, magnitude-independent errors of between 0.004 and 0.010 mag were added (in quadrature) to the results for each individual frame to yield a plot of reduced chi-squared versus signal-to-noise ratio for each field which had a uniform value of 1 (see N02 for details). Instrumental magnitudes were combined with the average airmass of each set of observations and equations 1, 2 and 3 used to obtain preliminary magnitudes and colours for stars in each field.
Astrometric calibration was defined by approximately 1000 objects in each frame that were identified on UK Schmidt plates as part of the SuperCOSMOS sky survey (Hambly et al. 2001a). The rms discrepancy in position for each identified object, after correction for proper motions in the SuperCOSMOS catalogue, was 0.20–0.25 arcseconds. This uncertainty is mainly in the positions from the SuperCOSMOS catalogue – comparison of positions for stars in our final catalogue with those common to the NGC 2547 catalogue presented by N02, which was calibrated using the same SuperCOSMOS data, indicate an internal astrometric precision for each catalogue of 0.05 arcseconds (rms) in each coordinate.
The overlapping regions between fields were used to refine the photometry and produce a uniformly calibrated mosaic. A shift was applied to the colours and magnitudes of each field which minimised the average discrepancies of all the stars in the overlap regions, subject to the constraint that the average shift applied to all those fields considered “photometric” (see section 2.2) was zero. After this procedure the rms discrepancy in the photometry for each field was 0.010 mag in , 0.007 mag in and 0.009 mag in . The final catalogue was produced by averaging the results for stars found in more than one field.
There were several departures from the procedures described by N02 which are worth noting.
-
1.
In N02 the source searching algorithm looked for “islands” of pixels which were some multiple of the noise above the sky level. This threshold was iteratively reduced by factors of 4 in order to isolate stars situated in the wings of other stars, where the minimum flux at a point between them may not fall below the original threshold. It became apparent during the reduction of this dataset that a better thresholding step is a factor of . In the case of sky-limited, Gaussian stars, this ensures that stars which are formally resolved (i.e. their flux profiles overlap at a point beyond their FWHM) are clearly separated as two sources by our search technique in the course of at least one iteration. Though this choice slows down the source searching procedure it is far from being the rate-determining step in the overall data reduction process.
-
2.
The photometry in the catalogue now uses the character-based flagging scheme described in Burningham et al. (2003) to identify non-stellar objects, stars lying on bad pixels, poor sky estimation etc.
-
3.
In our reduction scheme, “non-stellar” means that the optimal photometry technique will not yield a reliable measurement because the object is significantly extended, confused with another object or affected by the flux from a nearby brighter star. We found that testing for non-stellarity only in the summed I-band image was insufficient. Faint, very red, low-mass cluster candidates might appear isolated in the band, but their band flux could be biased upward by a nearby, unrelated field star with a bluer spectrum. Hence the estimated colour of the cluster candidate could be significantly underestimated. To counter this, an additional test for non-stellarity was made in the summed band image. If either test resulted in a non-stellar classification then this was reflected in the flags of all three magnitudes and colours. It was not necessary to extend the test to a summed Z-band image because the vast majority of stars (see Figs. 2 and 3) are bluer than the faint cluster candidates.
-
4.
The sky estimation technique (see Naylor 1998) is robust to nearby stars inside the “sky box” or smooth gradients in the sky background. However, curvature in the background, such as for objects situated in the wings of very bright or saturated stars will result in a histogram of pixel values that is highly asymmetric or not well fit by the skewed Gaussian model we adopt. To avoid spurious detections or significantly mis-estimated sky backgrounds, we demand that the reduced chi-squared of the fit to the sky histogram is less than 3 and that the skewness parameter is less than 0.3. If either test is failed then an “ill-determined sky” flag is set.
2.4 The final catalogue
The final catalogue contains 133788 stars, of which 49223 have one or more quality flags set. It is available in electronic format and is described in Appendix A.
Before using the catalogue it is worth examining sources of internal and external errors in the catalogue measurements.
-
1.
The astrometry has an internal precision of about 0.05 arcsec (1 sigma) in each coordinate for objects with a signal-to-noise ratio (in the band) of . The systematic external uncertainties are equivalent to the external uncertainties present in the SuperCOSMOS astrometric calibration (about arcsec compared with the International Celestial Reference Frame – Hambly et al. 2001b).
-
2.
The uncertainties for the magnitudes and colours reflect a combination of the statistical uncertainties of the optimal photometry flux measurements with an additional, small, magnitude-independent error added to each frame (see section 2.3).
-
3.
The catalogue does not include uncertainties revealed by the rms discrepancies in the zeropoints of the overlapping regions between fields (see section 2.3). These uncertainties should be added to the errors presented in the final catalogue if stars are to be compared or combined across different fields or the survey as a whole (as is the case in this paper).
-
4.
Finally there are systematic external photometric uncertainties, which are generally less than 0.02 mag but perhaps as large as 0.1 mag for the reddest stars (see section 2.2 and below). These may be important when comparing with other catalogues or with theoretical models.
As a check on external photometric precision we compared our photometry with that in N02. A subset of stars with no quality flags set and errors less than 0.1 mag was selected from each catalogue. These subsets were cross-correlated using a 1.0 arcsec correlation radius, finding 13032 matches. We find the following weighted least-squares fit relationships after adding the small errors revealed by the rms discrepancies in the zeropoints of the overlapping regions in each dataset:
for and , and where the numbers in brackets are 1-sigma uncertainties in the final significant figure. Higher order polynomials provide no significantly better fits. One of the strengths we claim for our techniques is the complete trustworthiness of the internal photometry errors (for unflagged objects). The reduced chi-squared values for the above fits, of 1.37 and 1.22 respectively, provide reassurance that this is the case, especially given the likelihood that at least some stars are truly variable. There is a significant difference and trend with colour between the N02 and our values – the N02 values are about 0.08 mag brighter at . As both datasets suffer from the same lack of very red calibration stars it would be unwise to attach more weight to one than the other.
3 Cluster Membership
3.1 Colour magnitude diagrams
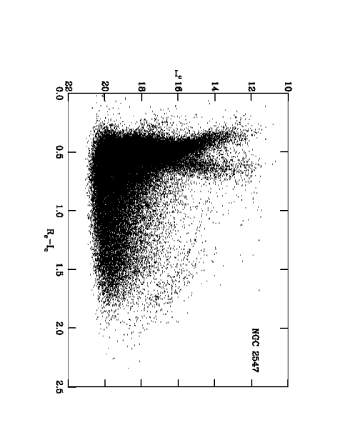
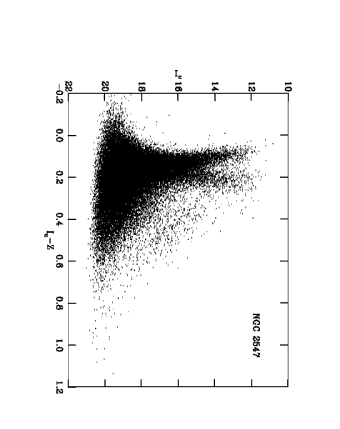
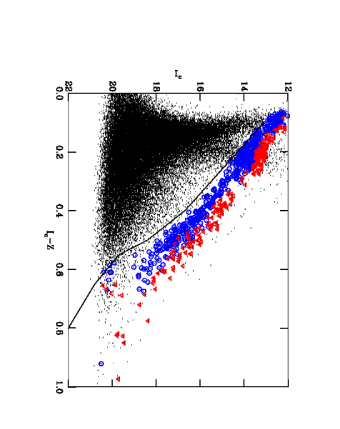
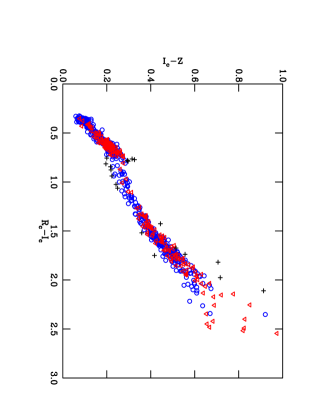
Figures 2 and 3 show the vs and vs colour-magnitude diagrams (CMDs) for all unflagged stars with a signal-to-noise ratio (in colour and magnitude) better than 10 (62722 and 55174 stars respectively).
The NGC 2547 PMS is clearly visible in both diagrams. It is better delineated when looking at the positions of X-ray active stars (see section 3.2 and N02), but we show these diagrams to make obvious the concentration of cluster stars (especially in Fig. 2 for ) and their separation from the contaminating background.
3.2 Model Isochrones
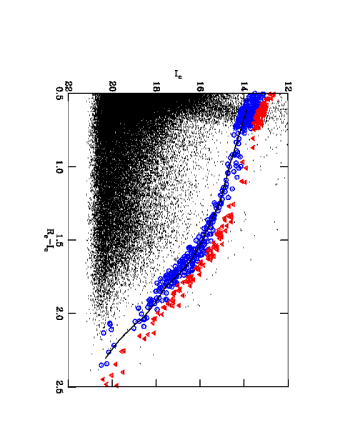
To select cluster members and assign masses to stars on the basis of their colours and magnitudes, we must choose an isochrone that adequately models the data. To aid this process we fit a subset of the catalogue identified as optical counterparts to XMM-Newton X-ray sources. The rationale is that young stars in NGC 2547 are known to be very X-ray active, typically orders of magnitude more active than contaminating field stars at a similar position in the observed CMDs (Jeffries & Tolley 1998). An X-ray selected sample should present a relatively clean PMS sample with which to fit model isochrones. The details of the XMM-Newton observations will be presented elsewhere (Jeffries et al. in preparation). In brief, they consist of a 50 ks pointing at the centre of the cluster, from which a total of 213 significant X-ray sources were found in one or a combination of the two PN plus EPIC detectors and within a 17 arcminute radius of the XMM-Newton field centre. These sources were correlated with our photometric catalogue, but to to minimize the number of spurious correlations, we restricted the catalogue to , because experiments showed that no plausible PMS cluster members were X-ray detected at lower luminosities. The X-ray optical counterparts are displayed in Figures 4, 5 and 6. The objects in the lower left of these plots are not cluster members and are most likely extragalactic X-ray sources that are randomly correlated with faint objects in the bulk of the CMD background population.


To select appropriate isochrones we used the models of D’Antona & Mazzitelli (1997, DM97) and Baraffe et al. (2002, B02 – with mixing length parameter set to 1.9 scale heights for masses greater than 0.6). The B02 models predict optical and infrared magnitudes as a function of age and mass, using the same model atmospheres that provide boundary conditions for the evolutionary model. However, it is well known that there are problems (mainly at and ) with these magnitudes, probably due to omissions in the various sources of opacity at these wavelengths (see Baraffe et al. 1998). In Figure 4 we show a model 30 Myr B02 isochrone (as a dashed line) constructed assuming an intrinsic distance modulus of 8.1 - clearly it is not a reasonable match to the data, being far too blue for the fainter X-ray sources.
Instead we adopt the approach of Jeffries, Thurston & Hambly (2001) and N02. We assume that the large amount of excellent photometric data for the Pleiades defines an empirical isochrone at an age of Myr111We use data for confirmed Pleiades proper-motion members from Stauffer (1982), Stauffer et al. (1984), Bouvier et al. (1998) and Moraux, Bouvier & Stauffer (2001). Where necessary, Kron-Cousins photometry is transformed to Cousins photometry using the equations in Bessell & Weis (1987). Combined with empirical -band bolometric-correction versus relationships (a quadratic fit to data from Leggett 1992 and Leggett et al. 1996), this empirical isochrone is used to determine a colour- relation that can be applied to isochrones at any age. Isochrones are generated from each set of evolutionary models, converted to colours and magnitudes and adjusted for the distance modulus, extinction and reddening for NGC 2547. The data here cannot determine any of these parameters independently of age, so we assume an intrinsic distance modulus of 8.1 (see N02), visual extinction, , of 0.19 magnitudes (Clariá 1982) and of 0.043.
versus isochrones are shown in Figs. 4 and 5 for the B02 and DM97 models respectively. The isochrones are a good fit to the X-ray selected cluster members at ages of 35 Myr (B02) and 30 Myr (DM97) for the range of colours of low mass objects discussed in this paper (). The age uncertainties are dominated by uncertainties in the cluster distance modulus – a plausible error in distance modulus leads to a Myr age change. There are significant differences in the shapes of the B02 and DM97 isochrones for . In principle these differences could be tested by firm membership information for fainter cluster candidates. In practice we need to perform our analysis for both isochrones in terms of selection of candidate members and subsequent calculation of MFs etc.
The same approach cannot be adopted for the versus CMD where there is insufficient, consistently calibrated Pleiades photometry from which to define the versus relation. Instead, for we define a locus that forms a conservative lower boundary to the X-ray selected stars and for fainter stars we extend this boundary by assuming that NGC 2547 candidates must lie above a set of consistently calibrated Pleiades low-mass stars (from Zapatero-Osorio et al. 1999). Our X-ray selected stars, the Pleiades objects (shifted to the same distance modulus as NGC 2547) and our defined lower boundary are shown in Fig. 6. The point of inflexion at does appear to be a genuine feature of the models and filter bandpasses (e.g. Moraux et al. 2003).
3.3 Selection criteria
Selection of candidate members in the CMDs is an arbitrary process to some extent. As our aims are to produce luminosity and mass functions (LFs and MFs) we choose to err on the side of generosity, defining tests that all members should pass (although see section 3.4), at the expense of including more contaminating field objects (see section 3.5). For each of the two sets of model isochrones in the vs CMD we select cluster candidates according to the following tests.
-
1.
The star must be unflagged and have photometric errors less than 0.1 mag in and and less than 0.2 mag in . The less stringent constraint on is justified because it is approximately twice as sensitive to effective temperature as .
-
2.
The star must be redder in than the boundary defined by the solid line in Fig. 6.
-
3.
The star must lie between 0.9 mag above and 0.25 mag below the chosen isochrone in Figs. 4 and 5. In addition we allow a further degree of freedom by adding the photometric error (the sum of uncertainties in the colour and magnitude after allowing for the gradient of the isochrone). Furthermore for stars with we allow another mag of possible error (in and ) to allow for plausible uncertainties in the photometric calibration.
-
4.
For stars that pass the above tests there is still the possibility that a star’s and may be incompatible. Although we do not have a good estimate of the intrinsic locus at faint magnitudes, we iteratively reject stars that lie more than 4 from a cubic fit to candidate members in the vs plot, where is the appropriately combined photometric uncertainty in both colours. This test is only applied to stars with because the sample is dominated at bluer colours by background giants (see section 3.5).
-
5.
Finally, those stars that pass all tests and lie more than 0.5 mag above the vs isochrone are classified as possible binary systems with large mass ratios. The threshold of 0.5 mag corresponds roughly to mass ratios, (see section 4.5).
3.4 Completeness


Completeness is an important issue when deriving LFs and MFs in clusters and is rarely addressed comprehensively in the literature. There are several reasons why members of the NGC 2547 cluster may not appear in our final lists of candidate members. (a) They may not be detected at all, either because they are too faint or too close to another star. (b) They may be flagged as non-stellar or fall on bad pixels or be otherwise flagged as having poor quality photometry. (c) Their photometry may scatter outside the selection criteria defined in the previous section. It is not sufficient to simply decide upon a magnitude threshold above which one expects to merely detect some fraction of stars.
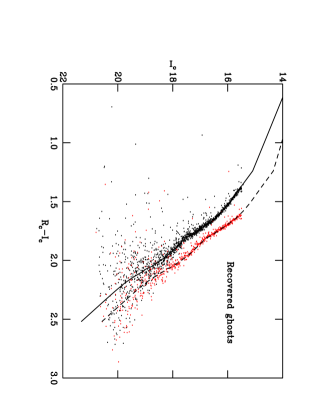
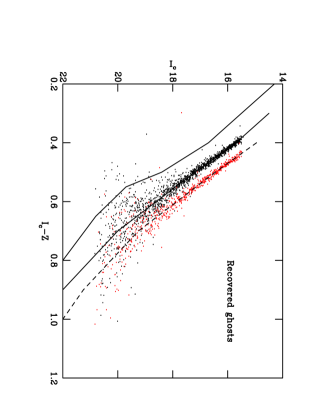
To estimate completeness we generated a catalogue of “ghost” stars (see N02), that were scaled copies (with the appropriate noise characteristics) of bright, unflagged stars in the total catalogue. The colours and magnitudes of the ghosts were allocated according to the isochrones defined for vs in section 3.2. For we used the isochrone defined in Figure 6. It is important to provide appropriate colours for the ghosts, as completeness will certainly be colour-dependent. It is impossible to precisely simulate the properties (LF, binary frequency, binary mass ratio distribution) of the cluster without knowing what they are a priori. We made the simplification that the cluster can be represented with a single star population and a binary star population with unit mass ratio. Because we allowed quite generous bounds on our selection criteria in section 3.3, this simplification should not have any great influence on the derived completeness information.
Two simulations were run. The first contained 2013 ghost stars placed on the single star cluster isochrones between (we used the DM97 vs isochrone), with a declining LF (LF ) that roughly mimics that seen in the data (see section 4.2), although with a shallower gradient222We anticipated that incompleteness would grow with magnitude, so this choice was approximately consistent with the measured LF. N02 explain why an appropriate choice of LF is important.. The second contained 862 ghost stars placed on a binary sequence, 0.75 magnitudes above the single star locus, covering the same magnitude range and with the same LF. This binary frequency (number of binary systems divided by total number of systems) of 30 per cent is about the average frequency of binary systems found (using the definition in section 3.3) in our data with .
The ghosts were placed in individual image frames according to their positions in the catalogue. The spatial distribution of the ghosts was tied to the parents from which they were scaled and was approximately uniform. The individual frames were summed and searched and pass through precisely the same operations as the genuine data. The number of ghosts was only a small perturbation (typically ghosts in a frame containing 8000 other stars) on the detection efficiency. They did not significantly increase the crowding in the frame and rarely did ghosts interfere with the detection and photometry of another ghost. However, the number of ghosts was large enough compared with the numbers of candidate NGC 2547 members, that statistical uncertainties in completeness are unimportant in our final derived LFs and MFs.
CMDs for recovered ghosts that were unflagged and have the required signal-to-noise-ratios are shown in Figs. 10 and 11. Some ghosts (a few per cent) were found with colours and magnitudes completely different to those simulated. We examined a number of these pathological objects and found that these were instances where the ghost was placed almost directly on top of an already existing star and was not flagged as non-stellar. As most stars in our fields are bluer than the cluster sequence, the photometry of these objects tended to be bluer than expected. This could happen to real cluster stars, so it is appropriate that these are included in completeness considerations. It is also clear that in the absence of detailed a priori knowledge of the mass-ratio distribution, any attempt to determine binary frequencies based on position in the CMDs will be compromised by scatter for ().
We determined two “completeness functions” (CFs) using these simulations. The first is the percentage of ghosts as a function of that were detected, unflagged and satisfied our signal-to-noise criteria in section 3.3. The second took the recovered ghosts through the full membership selection procedure, discarding those with colours and magnitudes inconsistent with membership. This second CF is appropriate for correcting the observed cluster LFs and MFs. Figure 12 shows the results. The upper plot (for the whole surveyed area) demonstrates that the second definition of CF results in significantly lower completeness at fainter magnitudes – a difference that could change the slope of a completeness-corrected LF or MF.
Both CFs were investigated for any spatial variation. It could be the case that the presence of more bright stars and hence higher and more complicated background in the cluster centre could compromise sensitivity or photometric accuracy. We derived CFs for the inner 15 arcminute radius (using the cluster centre defined by Littlefair et al. 2003) and compared them to CFs outside this area and these are shown in the lower plot of Fig. 12. There is some evidence that the inner CF is lower for , but not for brighter stars. In subsequent derivations of MFs and LFs we use a linear interpolation of the appropriate CF, depending on whether stars are inside or outside this inner circle. We will also assume that the CF for stars with is 95 per cent.
3.5 Contamination


Another issue hindering accurate reconstruction of LFs and MFs is contamination of CMDs by objects unassociated with the cluster. Our photometrically selected sample of cluster candidates contains contaminants, consisting of background giants and foreground dwarfs. Background G/K giants can be seen in Fig. 2 as a dense “finger” of contamination dominating the cluster sequence at . It is doubtful that evolved stars make much contribution to contamination outside of these colours. The cluster is at galactic latitude -8.6 degrees and longitude 264.5 degrees. A background M giant/supergiant with would have an absolute magnitude less than -2 and in order to have and encroach on the NGC 2547 PMS would be at a distance kpc and be more than 3.7 kpc out of the plane. The space density of such objects is essentially zero more than 2 kpc above the plane (Branham 2003) and so if we restrict our analysis to stars with then we need not consider contamination by background giants any further.
Contamination by older foreground field dwarfs with similar colours but lower luminosities than the NGC 2547 PMS stars is a more serious problem. The separation of the PMS from the bulk concentration of field objects in the CMDs is encouraging, but a quantitative estimate is desirable. We simulate the field star population using the -band luminosity function of stars within 8 pc (taken from Reid & Hawley 2000). Taking this local LF (in stars pc-3 mag-1) as a weighting function, we assign absolute magnitudes randomly to a large number of stars. The local LF contains many resolved binary systems, the vast majority of which would be unresolved in our survey. To account for this we assume 75 per cent of stars are part of binary systems (the fraction found in the 8 pc sample), consisting of two stars drawn randomly from the local LF. We further assume that the spatial density varies as , where is the height below the galactic plane, pc is the scale height for low-mass stars (see Kroupa, Tout & Gilmore 1993) and is the density implied by the local LF. We populate a cone of length 1.2 kpc in the direction of NGC 2547 and assume reddening increases linearly at about kpc-1. Stars are given intrinsic using an empirical 5 Gyr isochrone, generated as described in section 3.2333The empirical 5 Gyr isochrones generated from the B02 and DM97 models are so similar that it makes no difference which is used for the simulation. The isochrones are also age-insensitive for ages Myr.. colours are assigned using a polynomial relationship between and found for all stars in our catalogue with .
We generate a simulated catalogue corresponding to 5 square degrees of sky coverage – about 6 times larger than our actual survey area and sufficient to ensure that correction for contamination plays little role in the statistical uncertainties in the final LFs and MFs. To account for measurement uncertainties and completeness we have injected the simulated stars into our dataset using the same “ghosting” technique described in section 3.4. To restrict the numbers of ghosts to per cent of the number of stars in the genuine data we have clipped the input catalogue to include only those stars with and which lie sufficiently close to the NGC 2547 sequence to stand any chance of contaminating the final membership catalogue.
After running the simulated data through the cluster pipeline we recover 7697 of the original 8391 ghosts, of which, 646 had bad quality flags. Figure 13 shows a subset of the recovered field star ghosts, corresponding to 0.855 square degrees on the sky (we simply plot a fraction of the recovered catalogue). From this the reader can judge the level of contamination by comparison with Fig. 2. We pass the full 5 square degree simulated catalogue through our membership selection procedure to find the subset of field stars that would have been selected as candidate members. LFs/MFs (corrected for incompleteness, see sections 4.2 and 4.3) can be obtained for this contaminating sample from whatever area of the real catalogue we choose to construct the cluster LF/MF. This has the additional advantage of accounting for differing sensitivities due to the overlap regions or variations in exposure time and seeing.
Example “observed” (i.e. uncorrected for completeness) contaminating field star LFs (taken from the full survey area), expressed in numbers of stars per square degree are shown in Fig. 14. The main feature of the LF is a broad peak at , which is apparent as an enhancement in the density of contaminating stars in Fig. 2, and which is due to a maximum in the space density of stars with absolute . If the DM97 empirical cluster isochrone is used to select candidate members there are an average 127 contaminating stars per square degree expected for the range . The B02 empirical isochrone is fainter than that of DM97 for , resulting in more contamination at these colours and a total of 179 contaminants per square degree for .
A test of our contamination simulation is provided by fields 51 and 52, which are 60-75 arcminutes from the cluster centre. There is evidence (see section 4.1) that the density of cluster candidates is much lower in these fields than in the cluster centre, or possibly zero. If this is the case, then the candidate members in these fields represent the contamination level.
We find 11 candidate members with in fields 51 and 52 when selected using the DM97 isochrone or 13 when using the B02 isochrone. Our contamination simulations predict we should have seen 12.4 or field dwarf contaminants respectively. This close agreement offers reasonable support for our contamination model, although we must bear in mind two issues. First, the 8 pc sample is quite small: there are only 138 stars belonging to 103 systems defining the field star LF. Second, the 8 pc sample is probably complete to , but thereafter is likely to be increasingly incomplete (Reid, Gizis & Hawley 2002). The field dwarfs that contaminate our cluster sample will be those of the right colour and distance to fall within the photometric selection bounds. More distant intrinsically bright stars will be too blue, and very close intrinsically faint stars will be too red. The contribution to the contamination will be dominated by a mag range of the nearby star LF, at a distance commensurate with their coincidence with the NGC 2547 PMS. The consequent uncertainties on each of the histogram points in Fig. 14 arising from Poisson errors in the nearby star LF are therefore of order 20 per cent at , about 30 per cent at and in all cases larger than the statistical errors in our simulations.
More significantly, an unreddened dwarf with has and will contaminate the PMS of NGC 2547 at for the DAM97 isochrone, or for the B02 isochrone. At fainter magnitudes in NGC 2547 it is probable that the contamination by field dwarfs is underestimated by the simulation. A comparison of the 5.2 pc sample which is believed to be complete beyond (but of course contains far fewer stars), suggests that the 8 pc LF could be underestimated by a factor of 2 for (Reid & Hawley 2000). Insufficient area at large distances from the cluster centre has been observed to empirically rule out this possibility. For instance there are either 1 or 2 candidate members with lying in fields 51 and 52, depending on whether the DAM97 or B02 isochrones are adopted. The contamination simulation predicts we should have seen or respectively.
4 Results
4.1 Mass segregation


| D’Antona & Mazzitelli 1997 | ||||||
| Average Mass | 0.16 | 0.16 | 0.50 | 0.50 | 1.89 | 3.85 |
| (arcmin) | ||||||
| normalisation (arcmin-2) | ||||||
| background (arcmin-2) | 0.012 | 0.024 | 0.000 | 0.000 | ||
| 3.7/6 | 3.5/5 | 5.8/6 | 5.6/6 | 2.2/3 | 2.1/3 | |
| 83.2 | 89.6 | 123.1 | 129.3 | 70.0 | 8.3 | |
| 138.6 | 153.9 | 195.9 | 209.2 | 95.6 | 9.3 | |
| Baraffe et al. 2002 | ||||||
| Average Mass | 0.16 | 0.16 | 0.51 | 0.51 | ||
| (arcmin) | ||||||
| normalisation (arcmin-2) | ||||||
| background (arcmin-2) | 0.0267 | 0.0257 | ||||
| 2.0/7 | 1.9/6 | 9.9/6 | 9.1/5 | |||
| 60.6 | 62.8 | 114.5 | 128.4 | |||
| 88.7 | 92.8 | 181.3 | 211.9 | |||


The work of Littlefair et al. (2003) showed that high mass stars (3 ) are more centrally concentrated in NGC 2547 than their lower mass siblings. If this trend continued to even lower masses then any derived low-mass LF or MF for NGC 2547 would depend on the radius out to which candidate members are included, unless this radius can be made large enough to encompass most cluster members of all relevant masses. However, the possible problems with uncertain contamination lead to a conflicting need to minimise the radius used for LF/MF estimation.
To look for mass segregation in NGC 2547 we need to assign a mass to each of our candidate members. For candidates classified as single (see section 3.3) masses are assigned using a relationship between and mass that comes from the same empirical isochrone used to select the members. A complication arises for possible binary systems in that a binary may have twice the (system) mass of a single star with the same colour. In this paper we assume that the percent of candidate members classed as possible binary systems, on the basis that they are mag brighter than the single star isochrone, are all unit mass ratio binary systems with equal luminosity components. We subtract 0.75 mag from their values, calculate the mass of each star as if it were a single star and assume that the system mass is double this. We are actually sensitive to binaries with (depending on the colour – see Fig. 22 and section 4.5) but, because binaries with are redder than the intrinsic primary star colour, we find that this approximation still yields a system mass that is within about 10 per cent of that which would be determined using the correct value.
Figure 15 shows the completeness-corrected mass density (per square arcminute) and number density (of systems) for candidate NGC 2547 members with (corresponding to for the DAM97 isochrone or for the B02 isochrone), selected using the DAM97 isochrone. The bottom panel of this figure shows the average mass for the candidates. The magnitude limits were chosen to (a) avoid strong contamination by background giants and (b) avoid any strong spatial dependence in the completeness corrections (see section 3.4). The dashed histograms show the same quantities for the simulated field dwarf contamination. The plots show the expected concentration of mass towards the centre of the cluster, but there is no sign of any decrease in the average mass with radius. This leads us to believe that there is no strong mass segregation over this mass range. The result is not model dependent. The bottom panel shows the radial dependence of the average mass obtained by repeating the analysis using candidate members and masses assigned using the B02 cluster isochrone. However, the analysis is affected by increasing background contamination as a function of radius and does not yield any quantitative limit on the amount of segregation that could be present.
To overcome these problems we divided the magnitude-selected sample into two subsets with masses above and below 0.25, corresponding to for single stars with both sets of model isochrones. Using the DAM97 isochrone, the average masses of systems in these two subsets are 0.16 and 0.50 respectively. The bottom two panels of Fig. 16 show the radial number density profiles for the subsets. The horizontal dashed lines on these plots represent the average number density of field objects found for similarly defined subsets in our simulated contamination catalogue.
We fitted these profiles with King functions (see King 1962) plus a constant background density and fixed the tidal radius of the cluster using (Pinfield, Hodgkin & Jameson 1998; Jeffries et al. 2001), where is the mass of the cluster. Assuming (see section 5.2) and a distance modulus of 8.1, then arcminutes. In one set of fits the background density was fixed at the average value found from the simulated contamination catalogue and in another the background was a free parameter. We were careful to integrate the King profile over the 5 arcminute radial bins that were necessary to accumulate sufficient counts for chi-squared fitting to be valid. Because all the data lie well inside the tidal radius, the best-fit core radii and normalisations of the King functions are quite insensitive to . The results of our fitting are shown in Table 2. For comparison we modelled the radial number density profiles of two higher mass subsets of stars from the membership catalogues of N02. The subsets are chosen with (2.8 to 5.9 , average mass 3.85) and (1.1 to 2.8 , average mass 1.89). Masses were assigned to individual systems using the best-fit empirical DAM97 isochrone described by N02. The N02 catalogue does not extend beyond a 25 arcmin radius and so we could not fit the background density, but it is expected to be very small for these brighter subsamples and so we fixed it at zero (see Littlefair et al. 2003).
The results in Table 2 indicate a significant difference in spatial distribution for the high and low-mass stars. Note that because there are only eight stars in the highest mass subsample we considered, the quoted parameters and uncertainties (based on a chi-squared fitting technique) should not be taken too literally. The mass segregation implied by the much smaller core radius compared with the lower mass subsamples has however been confirmed, using a number of statistical tests, by Littlefair et al. (2003). Our results show only marginal evidence for any further mass segregation below 1 . To put this on a more quantitative basis we fit simultaneous King models to the two subsamples with average mass of 0.50 and 0.16 using the ratio of the core radii, expressed as , as a free parameter. We find best-fit ratios of for the case of fixed background values and the DAM97 isochrone, or if the background densities are allowed to vary. The 95 per cent upper limits to the ratio are 1.92 and 2.16 respectively.
We have also fitted a simple power law of the form to these two points plus the core radius of the subsample with an average mass of 1.89 . We would expect if no mass segregation is present over this mass range or in the case of dynamical equipartition (Pinfield et al. 1998). We find or for the cases of a fixed or free background respectively, and 90 percent confidence intervals of and .
Selecting candidate members and assigning masses using the B02 isochrone we obtain essentially indistinguishable results for the subsample with average mass 0.51 , but in the lower mass subsample, the empirical and model background estimates are significantly higher. This results in smaller core radii estimates (see Table 2), although consistent with those from the DAM97 modelling within the statistical uncertainties. The ratio or for the cases of fixed or freely fitted background densities. The 95 per cent upper limits on the ratio are 1.48 and 1.57 respectively.
We conclude that there is evidence for strong mass segregation between stars with and lower mass stars; weaker evidence for mass segregation of stars above and below ; that for lower mass stars () the radial distributions are consistent with no mass segregation; that strong mass segregation of the form with for is ruled out at the 95 per cent level, and that growth of the core radius by as much as a factor of 2 between 0.16 and is quite unlikely in the case of the DAM97 modelling and ruled out for the B02 models.
4.2 Luminosity function


Having established limits on how much mass segregation may be present in NGC 2547 we estimate the cluster LF by binning stars in magnitude bins out to some limiting radius. We choose a radius of 25 arcmin, because this significantly exceeds the core radii for stars of all masses making our LF insensitive to any mild mass segregation, and because beyond this radius the contamination density becomes equal to or greater than the density of cluster stars, compromising the precision of the LF.
The King profile fits in the last subsection allow us to estimate what fraction of cluster members lie inside this radius by comparing the integral of the King profile out to the tidal radius, with that out to a radius of 25 arcminutes. These results (for the differing mass subsets) are given in Table 2. Of course the estimates of the numbers out to the tidal radius are reliant on the assumption that a King profile is the correct form for the spatial density at large radii.
The encouraging feature from the point of view of this paper is that, at least for the two lowest mass subsets, the fraction of cluster members inside a 25 arcminute radius only varies in a narrow range between 58 and 68 percent depending on mass, background estimate and selected evolutionary model. This is a consequence of the lack of demonstrable mass segregation and the relatively consistent estimates of core radii from both the DAM97 and B02 models. Additionally, although the background contamination density varies by a factor of 2-3 between the DAM97 and B02 models in the lowest mass subset, it does not dominate in either until radii greater than 25 arcminutes. As a result, when estimating the MFs and the LFs for stars from the survey described in this paper, there is no compelling reason to apply any differential correction due to mass segregation, although such an effect may be present at levels of 10 percent for .
To construct an LF we place cluster candidates into 0.5 mag bins (in ) and apply completeness corrections by incrementing the binned value by the reciprocal of the completeness correction per star. We do the same for the simulated sample of contaminating field dwarfs selected as candidate cluster members and subtract this from the cluster candidate LF, propagating the statistical uncertainties according to the binomial distribution. The results are shown in Fig. 17 for the cases where the DAM97 or B02 isochrones were used for membership selection. The effects of completeness correction and the contamination subtraction are indicated.
The large peak in the LF at is attributable to contaminating background giants. Our contamination model does not include these, so they are not subtracted correctly. At fainter magnitudes the LF exhibits a shallow rise, reaching a peak at and then declines sharply, reaching a minimum at that is consistent with there being no objects in NGC 2547 at this magnitude. Comparing the dashed lines, solid lines and points with error bars in Fig. 17, we can see that the accuracy of the contamination subtraction and completeness correction are unlikely to have a great bearing on the above statements and there also seems to be little model dependency in the results.
The LF appears to rise again for , but here we have to caution the reader that the completeness corrections are large and the contamination model may itself be incomplete at colours corresponding to these magnitudes (see section 3.5). Our estimates of the LF are probably upper limits at this point, but Fig. 17 shows that, even if the subtracted contamination in the final three bins is increased by a factor of two, it makes little difference to the overall LF shape.
The LF of NGC 2547 (which has a distance modulus of about 8.1) can be compared with LFs found for other young clusters and the field. For example, Barrado y Navascués et al. (2002) find that the -band LF for low mass members of the 70-90 Myr old Alpha Per cluster peaks at and then declines by a factor of three by . Moraux et al. (2003) find a similar peak in the Pleiades. We have obtained the Pleiades data from Moraux et al. (2003), corrected it for the 30 per cent contamination in the brown dwarf regime suggested in that paper, found the LF, shifted it to match the distance modulus of NGC 2547 and applied an arbitrary normalisation to provide an approximate match to NGC 2547 at . The comparison can be seen in Fig. 18, where statistical uncertainties on the Pleiades points are quite similar to those in NGC 2547. The decline in the NGC 2547 LF appears to be steeper than in the Pleiades (and Alpha Per) and the LF peak occurs at , more like that found for the very young ( Myr) Sigma Orionis cluster, by Béjar et al. (2001). Of course because the luminosity-mass relation will be a function of age as young low-mass stars descend their PMS tracks, this is not necessarily surprising. Béjar et al. also show a (marginal) minimum in the band LF for , but their photometrically selected sample may (like ours) be contaminated with non-members at fainter magnitudes.
In Fig. 18 the NGC 2547 LF is compared with the LF of the local 8 pc sample from Reid & Hawley (2000), which has been shifted to the distance modulus of NGC 2547 and arbitrarily normalised to agree with the NGC 2547 LF at . Here the comparison is far from favourable, there appear to be significantly more faint stars in the nearby sample. Partly this must be an age effect – when comparing stars at similar absolute magnitude in the field and NGC 2547 we are comparing stars with very different masses. For instance, corresponds to according to the DAM97 NGC 2547 isochrone. Allowing for the distance modulus of NGC 2547, the same magnitude range corresponds to in a group of stars with age 5 Gyr. If the mass function declines with mass over this range, then it would be unsurprising to find more faint stars in the field sample. The local LF also contains stars from many resolved binary systems (see section 3.5). The majority of these would not be resolved in NGC 2547 (or other young clusters) and so a straightforward comparison with the nearby LF is not likely to be valid, as many faint stars in NGC 2547 will be hidden in binary systems. Instead we show in Fig. 18 what the local LF would look like if none of the binary systems were resolved. This accounts for some of the discrepancy, but much remains – and the discrepancy will be enhanced at fainter magnitudes if the 8 pc sample is incomplete.
4.3 Mass function


The cluster MF is estimated by calculating the mass of each candidate member using a mass- relationship derived from the isochrones that were used to fit the cluster CMDs. In this paper we define the MF using the form , where the canonical IMF for field stars derived by Salpeter (1955) would have .
Unresolved binarity is a problem in two ways: A binary star that appears above the single star cluster locus will be treated as one star with a slightly higher mass than either of its two components. The second problem is that binary stars with unequal mass components will have a derived primary star mass that is approximately correct, but the hidden, lower mass secondary component will not be included in the MF. Sagar (1991), Kroupa (2001) and Chabrier (2003) show that these two effects could result in systematic underestimates of by between 0.3 and 1, depending on the mass range considered, the binary fraction and the steepness of the MF.
In section 4.1 we discussed a simple correction for binarity that results in reasonably accurate estimates of system masses, but does not really assist us in generating the stellar MF because can only be loosely constrained for the photometric binaries and an unknown fraction of the remaining “single” stars are actually low- binary systems. Attempting to correct the observed MF for binarity is important in estimating the total cluster mass, but not for comparing cluster MFs with each other or with the field MF, so long as corrections are applied consistently, or not at all. A caveat is that there must be no significant differences in binary fraction or distribution. There is however little evidence for any enhanced binary frequency in younger clusters compared to the field (see Bouvier et al. 2001 and section 4.5). Halbwachs et al. (2003) also conclude that both the binary frequency and the distributions of field F-K binaries and their counterparts in the Pleiades and Praesepe are indistinguishable.
We derive the MF of NGC 2547 in a similar way to that done for the LFs. Each star is assigned to a bin (we use bins of size 0.1 dex in mass), a completeness correction is applied and the MF due to (completeness-corrected) contamination is subtracted. The MFs for the cases where the DAM97 or B02 models were used are shown in Fig. 19 in the form of versus .
The features apparent in the LFs are mirrored here. There is a strong peak in the MFs for which we attribute to contamination by giant stars – the two highest mass points in Fig. 19 should be considered extremely conservative upper limits. Both plots show a roughly flat MF for , which then turns downwards towards the brown dwarf regime. There is a minimum at corresponding to a for the DAM97 isochrones and for the B02 isochrones. The MFs are consistent with zero at this point, unless the level of background contamination has been seriously overestimated. However, incompleteness in the local LF used to generate the contaminating sample means that the converse is more likely, especially for the the lowest mass two and three points of the B02 and DAM97 MFs respectively. These should probably be considered (increasingly conservative) upper limits to the MF of NGC 2547.
Many authors have described the MF of the field and young clusters in terms of a power law ( ). There are problems with this approach, not least the arbitrary way in which the mass range for the fits is chosen (see below). For the range we obtain for the DAM97 MF, with a relatively poor chi-squared of 12.0 for 7 degrees of freedom. Alternatively, we obtain for the B02 MFs, with a reduced chi-squared of 6.2. However, it would also be perfectly reasonable to model both MFs with a flat function () for followed by a rather steeper decline with below this.
A value of for is rather typical of that found in the field and for a number of young clusters such as the Pleiades (see Meusinger et al. 1996; Gould 1997; Kroupa 2001). It is also consistent with the results obtained for stars overlapping this mass range in the NGC 2547 survey of N02. Chabrier (2003) hypothesises that the disc MF has a log-normal form (shown as a smooth dashed curve with arbitrary normalisation in Fig. 19), with a characteristic mass (when binary systems are not resolved) of 0.22 and Gaussian sigma of 0.57 dex. The field MF is not well constrained below 0.1 , but Chabrier claims that an extension of this log-normal form does a reasonable job of describing the very low mass and substellar MF in a number of young clusters, notably the Pleiades and Alpha Per. The authors that obtained the data upon which this conclusion is based have tended rather to fit power law MFs with indices of over a variety of mass ranges within the limits (e.g. Béjar et al. 2001; Barrado y Navascués et al. 2002; Jameson et al. 2002; Moraux et al. 2003).
Our MF for NGC 2547 is reasonably consistent with Chabrier’s log-normal model down to masses of , but then declines more steeply. When expressed as a power law, the MF for NGC 2547 also seems to drop more rapidly towards lower masses than in most young clusters. Much of this discrepancy may be down to the variation in mass limits over which power-law fits are applied. A better way to compare clusters is to derive MFs from the original data using the same magnitude-mass relationships. Taking the magnitudes for stars and brown dwarf candidates in the Pleiades (Moraux et al. 2003), we have used the -mass relationships used in this paper to calculate the Pleiades MF. As discussed by Moraux et al., we apply no correction for mass segregation and correct for 30 per cent contamination among the brown dwarf candidates.
Figure 20 shows the comparison between the MFs of NGC 2547 and the Pleiades (derived using DAM97 models, an age of 120 Myr and a distance modulus of 5.6). The MFs have been scaled to roughly agree with that of NGC 2547 at . The agreement between the MFs is exceptionally good down to the substellar limit, with a similar level of statistical precision in both clusters. There is then a suggestion that there are fewer brown dwarfs in NGC 2547 than the Pleiades. This statement is based on one well defined point in the MF (at ), which is about 5-sigma discrepant from the Pleiades point, and the knowledge that lower mass points in NGC 2547 may well be afflicted with a higher level of contamination than we have assumed. The Pleiades MF also features a dip at . Dobbie et al. (2002) have suggested that sharp dips in the MF close to the substellar limit may be as a result of an imperfect understanding of cool atmospheres and hence the mass-magnitude relationship (see section 5.3). The Pleiades MF also seems a little inconsistent with the log-normal form proposed by Chabrier (2003) and this is not changed if the MF is calculated using the B02 isochrones. The Pleiades MF also features a dip at
Both datasets favour a narrower Gaussian sigma of around 0.4 in , although the point at in NGC 2547 would still lie well below even this model. Finally, as a cautionary tale, we find that a power law MF fitted between in the Pleiades yields (and similar using the B02 models), but a fit between yields !
4.4 The overall mass function of NGC 2547

| Notes | ||
| 0.75 | 1 | |
| 0.60 | 1 | |
| 0.45 | 1 | |
| 0.35 | 1 | |
| 0.25 | 1 | |
| 0.15 | 1 | |
| 0.05 | 1, 3 | |
| -0.05 | 1, 3 | |
| -0.15 | 1, 3 | |
| -0.25 | 2 | |
| -0.35 | 2 | |
| -0.45 | 2 | |
| -0.55 | 2 | |
| -0.65 | 2 | |
| -0.75 | 2 | |
| -0.85 | 2 | |
| -0.95 | 2 | |
| -1.05 | 2 | |
| -1.15 | 2, 4 | |
| -1.25 | 2, 5 | |
| -1.35 | 2, 5 | |
| -1.45 | 2, 5 | |
| 1 Data from N02 | ||
| 2 Data from this paper | ||
| 3 Contaminated by giants | ||
| 4 2-sigma upper limit | ||
| 5 Probable additional contamination | ||
We can combine the low-mass MF determined here with the cluster candidates from N02 to estimate a cluster MF over two orders of magnitude in mass – . We calculate an MF from the magnitudes of the N02 survey by using a -mass relationship defined by the empirical 30 Myr DAM97 isochrone used to select members in that paper. For stars with the isochrones of Schaller et al. (1992) are used. The data are corrected for completeness, but no correction is made for binarity and there is assumed to be no contamination.
To compare the MFs from the N02 and our survey we must account for the differing survey areas and the (mass-dependent) spatial distribution of the cluster candidates. The MFs are normalised to what would be seen out to the tidal radius if King profiles accurately represent the spatial distributions. The corrections are applied in a mass-dependent way using the four models (with fixed background) from Table 2. For the record we multiplied the MF contribution from stars by 1.16, the stars by 1.73, the stars by 1.94 in the N02 data, and the and stars from this paper by 1.59 and 1.67 respectively.
The final MFs are plotted for both datasets in Fig. 21. Where the datasets overlap in mass, the agreement is reasonable. The N02 MF is higher for , but this is probably because no contamination has been allowed for – the MF from this paper is far more reliable in this mass range. The “spike” in the MF at , caused by background giants is lower in the N02 dataset because many giants were cleaned from this sample by selection in the versus diagram. The cluster is not well fitted by the log-normal plus power-law form suggested bt Chabrier (2003), but could be well represented over the range with three power laws, as suggested by Kroupa (2001), with for , for and for . As an aid to future work, Table 3 list our best estimate of the “whole cluster” MF for NGC 2547.
4.5 Binarity


The binary frequency and distribution of binary periods and mass ratios are important diagnostics of the star formation process (e.g. see Halbwachs et al. 2003; Fisher 2004). In Figure 22 we show the fraction of stellar systems as a function of that are identified as binary systems according to the photometric selection techniques in described in section 3.3. The binary fraction is defined as the number of binary systems divided by the total number of systems. The numbers of systems in each case were taken from within a radius of 25 arcminutes of the cluster centre, corrected for completeness, and a completeness-corrected number of contaminating field dwarfs from a similar area was subtracted before performing the division.
The bluest bins are based on quite small number statistics and the very bluest bin may contain a few contaminating giant stars. We also cannot trust the results for for several reasons: (i) These stars will have and the uncertainties in their colours will confuse the sensitivty of our test for binarity and bias it in a way that is difficult to predict (see section 3.4) . (ii) At these faint magnitudes there is a significant difference in the completeness correction for binaries and single stars at the same colour – to the extent that many single stars would simply not have been detected. The binary fraction is then heavily reliant on the accuracy of the completeness corrections at low levels of completeness. (iii) Our estimate of the sample contamination is likely to be too low at these colours. This will likely lower the true binary fraction because the fall off for the background density as a function of decreasing magnitude at a given colour in the CMD is quite steep.
For we obtain weighted mean binary fractions of and when using the DAM97 and B02 models respectively. There is marginal evidence that this fraction is higher for (corresponding to masses of approximately and according to the DAM97 and B02 cluster isochrones we have used). This is counterbalanced by the increasing range of values to which our binary identification technique is sensitive (see Fig. 22), which ranges (with some slight model dependency) from about at to for , due to the changing slope of the cluster single stars locus and the -mass relationship.
The deduced binary fraction for M dwarfs in NGC 2547 is similar to binary fractions deduced for field M-dwarfs. Fischer & Marcy (1992) find that per cent of M-dwarf primaries form multiple systems with . Henry & McCarthy (1990) find 34 per cent binarity for M-dwarfs within 5.2 pc, and the 8 pc sample of M-dwarfs has 33 per cent binarity (Reid & Hawley 2000). These latter two surveys almost certainly suffer from a little incompleteness at the smallest mass ratios. Comparable photometrically selected binarity statistics for young clusters suggests a binary fraction of 26 per cent among the K and early M stars of the Pleiades (with – Stauffer et al. 1984) and per cent for M5-M6 dwarfs in the Pleiades (with – Pinfield et al. 2003). We conclude that the binary fraction for M-dwarfs in NGC 2547 is consistent with that in either the field or the Pleiades.
5 Discussion
Most measurements of the initial mass function (IMF) to date have been made in either very young star forming regions (e.g. IC 348, Trapezium, Ori), where low-mass stars and brown dwarfs are intrinsically luminous, or in older, rich clusters with large populations of low-mass objects (e.g. Alpha Per, Pleiades, M 35, NGC 2516). There are disadvantages to both these methods. In the star forming regions one must contend with the presence of discs, uncertainties in reddening and age as well as spreads in these quantities. In addition there are likely systematic uncertainties in low-mass evolutionary models due to to the non-negligible influence of the initial conditions at very young ages (B02). In older clusters ( Myr) these particular systematic uncertainties will be less, but there are then problems with mass segregation and the evaporation of low-mass objects, uncertainties in the colours, bolometric corrections and hence the magnitude-mass relationship for very cool low-mass objects and the observational bias that older clusters necessarily started off very rich and populous in order to exist now in their current form. These very rich concentrations of stars may have had a different IMF to that in less dense star forming regions.
NGC 2547 forms an important bridge between these two categories of objects. It is old enough that age spreads and reddening are not an issue and systematic uncertainties in the evolutionary models are not too important. On the other hand it is not old enough to have undergone very significant mass segregation among its low-mass population and is a smaller cluster than the Pleiades (see below).
5.1 The IMF and NGC 2547
The major result of this paper is that the MF of NGC 2547 is remarkably consistent with that of the Pleiades down to the Hydrogen burning limit (HBL). Just below the HBL there seems to be a dip in the MF of NGC 2547 that is not present in the Pleiades, or in a number of other young clusters. This dip is present at quite a high level of significance – for example, whereas we might have expected to detect about 10 objects in our NGC 2547 MF (using the DAM97 isochrones and multiplying by the likely level of incompleteness) with if it had a similar MF to the Pleiades, we only detected 2 such objects in NGC 2547, both of which have a reasonably high probability of being contaminating objects. Spreading the range to the comparison becomes about 15 expected from a Pleiades MF versus 6 seen in NGC 2547 (of which about 3 are expected to be contamination). At lower masses the MF of NGC 2547 appears to recover to levels seen in the Pleiades, but we cannot be certain that this is the case, because our estimates of the contamination level at colours corresponding to this mass in NGC 2547, are likely to be too low (see section 3.5).
Our MF for NGC 2547 (and also the Pleiades) appears significantly lower (for ), than the log-normal form hypothesised to be universal among young disc clusters and star forming regions by Chabrier (2003). Because of its age NGC 2547 provides a unique constraint on the form of the initial mass function for disc stars, but we must consider several possible sources of systematic error.
5.1.1 Methodology problems

The possible problems that could have arisen in our analysis procedures are centered upon (i) subtraction of background contamination; (ii) correction for incompleteness and (iii) model dependence of the results.
-
1.
A weakness in our analysis is that we were forced to rely upon a model to estimate the background contamination because we did not observe sufficient area at large distances from the cluster to make a precise observational estimate. However, the observations we have were sufficient to show that our background estimates are not likely to be wrong by factors of two, except perhaps at the very lowest masses , where we make no claim to have accurately determined the NGC 2547 MF. Because of the relatively high contrast between the cluster and background at arcminutes, uncertainties in the contamination cannot change our main conclusions, though they could alter the exact slope of the MF at low masses, particularly if the B02 isochrones (for which the low-mass cluster members are more heavily contaminated by background) turn out to be more appropriate than those of DAM97. If anything, we believe our model underpredicts the amount of contamination at the lowest masses, which would lead to fewer brown dwarfs in NGC 2547.
-
2.
We have made great efforts to ensure our completeness corrections are as accurate as possible – including a number of effects rarely addressed in the literature to date (for example the spatial and colour dependence of completeness and the effects of non-Gaussian uncertainties which scatter stars sufficiently for them to be excluded as candidate cluster members). Our survey is substantially complete ( per cent for , corresponding to . To explain the discrepancy between NGC 2547 and the log-normal disc MF of Chabrier (2003) would require these completeness corrections to be smaller by factors of 2-3 for (). Systematic errors of this size seem most unlikely (see for instance the tests performed in N02).
-
3.
We have used those readily available models which cover the required mass range in our data. There are some model dependencies in the results – notably that the DAM97 models do allow the possibility of some mass segregation at low-masses, while the B02 models do not. These differences are as a result of the slightly differing candidate members selected using the two models and the concomitant differences in the estimated levels of contamination. However, the magnitude-mass relationships are remarkably similar and so the MF of NGC 2547 is essentially the same for both sets of models. These magnitude-mass relationships make use of empirical relationships between colour and bolometric correction and an assumed age and distance for the Pleiades. An alternate approach adopted by many authors is to use the theoretical bolometric corrections and magnitudes directly calculated in the Baraffe et al. (1998) nextgen models to estimate masses. To test for sytematic error, we recalculated the MF of NGC 2547 using this technique. The result is shown in Fig. 23 and illustrates very little sensitivity to this change. This is probably because there is very little disagreement between the theoretical bolometric corrections of Baraffe et al. (1998) and the empirical bolometric corrections adopted in this paper over the colour range of interest for NGC 2547. This is not likely to be the case for brown dwarfs in older clusters, where photospheric temperatures may be cool enough for dust formation and hence bluer colours and fainter magnitudes for the same mass. However, Dobbie et al. (2002) have suggested this may be a problem even at temperatures as warm as 2700 K (corresponding to or 2.30 for the B02 or DAM97 model isochrones we have used), causing a dip in MFs derived from models that do not incorporate these effects (see section 5.3). Such temperatures are present at the faint end of our NGC 2547 sample and we cannot be sure that our MFs are not susceptible to sytematic effects ignored (or included incompletely) in all available models.
5.1.2 Hidden binary companions
In section 4.3, we pointed out the problem of unresolved binarity in determining the true MF. We ignored the problem, with the caveat that, when making comparisons with the field and other clusters, we must assume that the binary frequency and distribution (as a function of mass) is similar. A recent series of papers (Kroupa & Bouvier 2003; Kroupa et al. 2003) have highlighted that differences in binary properties can lead to apparent differences in the observed MF. The particular example discussed is the apparent deficit of brown dwarfs in the Taurus-Auriga association (TA) compared with the Orion Nebula Cluster (ONC – see Briceño et al. 2002). The hypothesis is that many “missing” brown dwarfs are still locked in binary systems in the TA, while these binaries have been disrupted in the denser environs of the ONC.
So a possible solution to the apparent deficit of high-mass brown dwarfs in NGC 2547 compared to the Pleiades could be an enhanced binary fraction, especially of low- systems. The results discussed in section 4.5 partly argue against this possibility. The binary frequencies of binaries with primary masses are similar to those in the Pleiades. However, there could still be an anomalously high number of systems in NGC 2547, which we could not identify with our photometric techniques and in any case we have not been able to estimate a binary fraction below the HBL.
5.1.3 Incorrect cluster age

The low-mass isochronal age of NGC 2547 is about 30 Myr, but there has been some debate in the literature concerning this age. Clariá (1982) and Jeffries & Tolley (1998) find an age of about 50 Myr from the high-mass turn-off in the cluster, albeit defined by only one or two stars. Jeffries et al. (2003) and Oliveira et al. (2003) conclude that the pattern of lithium depletion seen amongst the low-mass members of NGC 2547 may also be best explained (using the same models used to fit isochronal ages) if the cluster age is Myr. A similar pattern is exhibited in other young clusters, where the isochronal age (both low and high mass) is found to be younger than the age determined from Li depletion mechanisms (e.g. Barrado y Navascués, Stauffer & Patten 1999).
Our low-mass data are incapable of simultaneously fixing the age and distance of NGC 2547, because at ages around 30 Myr the isochrones are almost parallel (certainly for see Figs. 4 and 5). Hence a change of age can be compensated by a change in distance modulus (considering only the low-mass data presented here). To check the age dependence of our MFs we increase the assumed age of the cluster to 50 Myr and decrease the distance modulus to 7.8 and 7.7 in the case of the B02 and DAM97 models respectively. These isochrones yield new -mass relationships that can then be used to generate MFs.
We find that after correction for the differing distance moduli, the mass-magnitude relationships are almost identical over the mass range of interest here. Figure 24 shows a comparison of the MFs derived assuming a cluster age of 30 Myr and 50 Myr and the DAM97 evolutionary models. Uncertainty in the cluster age at this level cannot affect any of our conclusions.
5.1.4 Mass segregation
If mass segregation is present in the cluster then a survey that does not extend to the cluster tidal radius may underestimate the contribution from low-mass stars/brown dwarfs. An example of this is M 35, a cluster which is old enough (175 Myr) to be dynamically relaxed (see below), shows a sharp downturn in its MF below 0.2 from a survey of limited area (Barrado y Navascués et al. 2001), and which shows clear evidence for mass segregation (Kalirai et al. 2003).
The analysis in section 4.1 failed to reveal significant mass segregation in NGC 2547 between samples with mean masses of 0.16 and 0.50 . Mass segregation of the form is expected in the case of energy equipartion (Pinfield et al. 1998). We can rule this out in the case where we use the B02 isochrones and it very unlikely when using the DAM97 isochrones.
An approximate calculation can be used to check whether this is reasonable. Jeffries et al. (2000) measured a 1-dimensional velocity dispersion of km s-1 for solar-mass stars in NGC 2547, although given that this is similar to the esimated radial velocity measurement errors, this must be a very conservative upper limit. This gives a crossing time-scale (for 2 core radii) of Myr. The number of stars/systems () in the cluster is and using Binney & Tremaine’s (1987) approximate formula
| (4) |
an estimate for the relaxation timescale is Myr.
Numerical simulations for general clusters and specifically for NGC 2547 confirm these approximate results (e.g. Adams et al. 2002, Littlefair et al. 2003). At an age of about 30 Myr, little mass segregation is expected in NGC 2547. That which is, should affect the highest mass stars first. Hence any major mass segregation seen, such as that obvious between stars with and the rest of the cluster, is most likely primordial in nature. The relatively constant behaviour of the cluster core radius for stars from ) does not support any suggestion that they were formed with a mass-dependent spatial distribution or velocity dispersion.
What little evidence for mass segregation that exists (for the DAM97 models) would have very little effect on the measured MF. Extrapolating the King profiles to the tidal radius we see that the ratio of 0.16 to 0.50 stars will only increase by a factor of from that measured within a radius of 25 arcminutes.
5.1.5 Evaporation of low-mass objects
N-body simulations show that the process of dynamical relaxation leads to the preferential evaporation of low-mass objects, in addition to mass segregation (e.g. de la Fuente 2000). Adams et al. (2002) show that dynamical evaporation is unlikely to be a factor until cluster ages significantly greater than the relaxation time. As there is little sign of mass segregation we can safely conclude that dynamical evaporation is also unlikely to be important in NGC 2547.
However, several authors have put forward models where very low-mass stars and especially brown dwarfs are preferentially expelled from protostellar multiple systems, before they have had chance to accrete significant masses - the “ejection hypothesis” – (e.g. Reipurth & Clarke 2001; Sterzik & Durisen 2003). As a result they are likely to have a larger initial velocity dispersion than higher mass stars, resulting in preferential mass segregation and evaporation from a cluster. A number of problems have emerged with the “ejection hypothesis”. For example, the spatial distribution of low-mass stars and brown dwarfs are found to be similar in some young star forming regions (e.g. López-Martí et al. 2004). Our results cannot directly contradict the ejection hypothesis, because there are too few objects with to assess their spatial distribution. The escape velocities for low-mass objects in NGC 2547 and the Pleiades (using the cluster masses derived below) are quite similar at km s-1, so a similar fraction of brown dwarfs might be expected to have escaped in this way.
The early ejection of brown dwarfs from a cluster would result in a cluster MF significantly depleted of brown dwarfs compared with the field. Unfortunately, constraints on the field brown dwarf MF are still too loose to pinpoint any inconsistency between cluster and field MFs at the lowest masses (e.g. Chabrier 2003).
5.2 The mass of NGC 2547
The total mass of NGC 2547 can be estimated by summing the number of stellar systems estimated within the tidal radius ( in Table 2) multiplied by their average mass, which comes to about 350 . We need to add an extra contribution due to NGC 2547 stars that lie within the magnitude range heavily contaminated by giants. Assuming that the MF is roughly flat and has between (corresponding to ) and (corresponding to ), multiplying by a factor of 1.25 to approximately account for binarity (50 per cent binarity and a flat distribution) and a factor of 1.6 to account for stars out to the tidal radius, we arrive at an extra 100 in this mass range. The total cluster is therefore about 450 for 444Which is what we assumed in order to calculate the tidal radius in section 4.1. In practice, as the reader might have guessed, it required an iteration of the analysis to arrive at this consistency., which can be compared with a total Pleiades mass of 735 derived by Pinfield et al. (1998). Uncertainties in the shape of the mass function, choice of evolutionary isochrones and uncertainties in the King profile corrections make the total mass of NGC 2547 uncertain by no more than .
5.3 Possible Variations in the IMF?
Although the MF of NGC 2547 is almost identical to the Pleiades down to the HBL, we have tentatively identified a deficit of high-mass brown dwarfs in NGC 2547. We can go further and state that, because our contamination model suffers an unknown level of incompleteness for masses less than about in NGC 2547, our analysis (using either the DAM97 or B02 models) is consistent with there being no brown dwarfs in NGC 2547. Clearly this requires further testing. In particular, a deeper, wider survey, perhaps incorporating near-IR data, would provide a much more secure empirical estimate of the amount of background contamination at very red colours.
Many believe that the IMF in young clusters and associations may be universal (e.g. Kroupa 2002), but evidence is now emerging for significant differences in the measured MFs in differing star forming regions. The Taurus-Auriga and IC 348 young star forming regions both appear to show a factor of two or more deficit in the ratio of brown dwarfs to low-mass stars, when compared with regions like the Pleiades or the ONC (Briceño et al. 2002; Luhman et al. 2003, Preibisch, Stanke & Zinnecker 2003). In particular, the MF for IC 348 presented by Luhman et al. (2003) shows a sharp 0.6 dex fall below that is quite reminiscent of what we have found for NGC 2547. These authors speculate that either the low stellar density in these regions or the absence of very high mass stars () may be important factors. It could be that the far-ultraviolet radiation from hot stars is an important factor in terminating accretion in low-mass objects, resulting in more brown dwarfs.
The lack of brown dwarfs in NGC 2547 could be interesting in this context. The most massive star in the cluster has and an extrapolation of the high-mass end of the present-day MF suggests that more massive stars may never have been present (see N02).
An alternative explanation might involve an incomplete understanding of cool atmospheres in low-mass stars. Dobbie et al. (2002) have identified a number of “dips” in the LFs of young clusters (Pleiades, Ori, Alpha Per, IC 2391) which, whilst individually not very significant, collectively seem to point to a drop in the LF (and consequently the MF) at effective temperatures of about 2700 K. Dobbie et al. interpret this as the onset of dust formation with grains somewhat larger than assumed in most models, which would lead to enhanced opacity at near infrared wavelengths and a modified mass-magnitude relationship. Our observations may support this idea. The “gap” in the CMD seen in Fig. 7 occurs at colours corresponding to 2800-2900 K in the B02 and DAM97 models. Given the likely systematic errors in this could be consistent with the 2700 K value proposed by Dobbie et al. If the LF and MF of NGC 2547 really did increase again for then NGC 2547 might be the clearest example yet of this phenomenon.
6 Conclusions
In this paper we have presented optical/near infrared photometry of NGC 2547 that is both deeper and covers a wider area (0.855 square degrees) than previously published surveys. The survey has been used to collate a catalogue of candidate members and investigate the degree of mass segregation and the mass function (MF) for the cluster. The main conclusions of our work can be summarised as follows:
-
1.
The cluster shows strong evidence for mass segregation, in that stars with are much more centrally concentrated than lower mass stars. There is some evidence for mass segregation above and below 1 , but lower mass stars have spatial distributions that are consistent with no further mass segregation for . By fitting King profiles we have estimated that at least 60 per cent of the cluster’s low-mass population is included within our survey.
-
2.
The MF for in NGC 2547 has been determined with roughly the same statistical precision as available for the best Pleiades studies (and much more precisely than field MF determinations) and is in remarkable agreement with the Pleiades MF (and other young clusters) over this mass range. Because of it’s age ( Myr), NGC 2547 is not badly affected by a number of systematic uncertainties which could well affect studies of both younger and older clusters (age spreads and uncertainties, reddening, discs, very cool atmospheres, dynamical evolution) and neither are our results very dependent on which stellar evolutionary models are used. Our analysis therefore represents one of the most precise and robust determinations of a low-mass disc population MF, and possibly the initial MF if primordial velocity dispersions are reasonably mass-independent.
-
3.
Below the hydrogen burning limit we have identified an apparent dearth of high-mass brown dwarf candidates in NGC 2547 (). This deficit may extend to lower masses, but increasing incompleteness in both our survey and our estimates of contaminating foreground M-dwarfs leave this question open. Alternatively, we may be seeing an example of the “missing M dwarf” phenomenon, identified by Dobbie et al. (2002), which could result from an imperfect understanding of atmospheres with temperatures of around 2700 K and would not reflect a true deficit of brown dwarfs. A deeper, wider survey of NGC 2547 is called for to verify this result, to provide a better empirical estimate of contamination among the lowest mass cluster candidates, and hence show whether the deficit we have seen is merely a dip or a genuine lack of brown dwarfs.
-
4.
The total mass of NGC 2547 for stars with is and about a factor of two smaller than the Pleiades.
-
5.
The binary fraction of M-dwarfs in NGC 2547 is between 20 and 35 per cent for systems with mass ratios greater than 0.35 to 0.65. This fraction is consistent with values determined for populations of low-mass stars found in the field and other young clusters.
-
6.
Finally, we have provided in electronic format both our entire photometric catalogue as well as subsets of photometrically selected cluster candidates. These catalogues contain data with robust and precisely determined photometric and astrometric uncertainties.
Acknowledgments
We would like to thank the director and staff of the Cerro Tololo Interamerican Observatory, operated by the Association of Universities for Research in Astronomy, Inc., under contract to the US National Science Foundation. Computing was performed at the Keele and Exeter nodes of the Starlink network, funded by PPARC. EJT was supported during this work from a PPARC research grant. CRD was supported by a Nuffield Undergraduate Bursary (NUF-URB00). The defringing algorithm used in our data reduction was kindly supplied by Mike Irwin. We thank the Paul Dobbie for supplying a very prompt and useful report.
The Digitized Sky Survey was produced at the Space Telescope Science Institute under U.S. Government grant NAG W-2166. The images of these surveys are based on photographic data obtained using the Oschin Schmidt Telescope on Palomar Mountain and the UK Schmidt Telescope. The plates were processed into the present compressed digital form with the permission of these institutions.
References
- Adams et al. (2002) Adams T., Davies M. B., Jameson R. F., Scally A., 2002, MNRAS, 333, 547
- Baraffe et al. (1998) Baraffe I., Chabrier G., Allard F., Hauschildt P. H., 1998, A&A, 337, 403
- Baraffe et al. (2002) Baraffe I., Chabrier G., Allard F., Hauschildt P. H., 2002, A&A, 382, 563
- Barrado y Navascués et al. (2002) Barrado y Navascués D., Bouvier J., Stauffer J. R., Lodieu N., McCaughrean M. J., 2002, A&A, 395, 813
- Barrado y Navascués et al. (2001) Barrado y Navascués D., Stauffer J. R., Bouvier J., Martín E. L., 2001, ApJ, 546, 1006
- Barrado y Navascués et al. (1999) Barrado y Navascués D., Stauffer J. R., Patten B. M., 1999, ApJ, 522, L53
- Bate et al. (2003) Bate M., Bonnell I. A., Bromm V., 2003, MNRAS, 339, 577
- Béjar et al. (2001) Béjar V., Martín E. L., Zapatero-Osorio M. R., Rebolo R., y Navascués B., Bailer-Jones C. A. L., Mundt R., Baraffe I., Chabrier G., Allard F., 2001, ApJ, 556, 830
- Bessell & Weis (1987) Bessell M. S., Weis E. W., 1987, PASP, 99, 642
- Binney & Tremaine (1987) Binney J., Tremaine S., 1987, Galactic Dynamics. Princeton Univ. Press, Princeton
- Bonnell et al. (2001) Bonnell I. A., Clarke C. J., Bate M. R., Pringle J. E., 2001, MNRAS, 324, 573
- Bouvier et al. (2001) Bouvier J., Duchêne G., Mermilliod J. C., Simon T., 2001, A&A, 375, 989
- Bouvier et al. (1998) Bouvier J., Stauffer J. R., Martín E. L., Barrado y Navascués D., Wallace B., Bejar V. J. S., 1998, A&A, 336, 490
- Branham (2003) Branham R. L. J., 2003, A&A, 401, 951
- Briceño et al. (2002) Briceño C., Luhman K. L., Hartmann L., Stauffer J. R., Kirkpatrick J. D., 2002, ApJ, 580, 317
- Burningham et al. (2003) Burningham B., Naylor T., Jeffries R. D., Devey C. R., 2003, MNRAS, 346, 1143
- Chabrier (2003) Chabrier G., 2003, PASP, 115, 763
- Clariá (1982) Clariá J. J., 1982, A&AS, 47, 323
- D’Antona & Mazzitelli (1997) D’Antona F., Mazzitelli I., 1997, Mem. Soc. Astr. It., 68, 807
- de la Fuente Marcos & de la Fuente Marcos (2000) de la Fuente Marcos R., de la Fuente Marcos C., 2000, Ap&SS, 271, 127
- Dobbie et al. (2002) Dobbie P. D., Pinfield D. J., Jameson R. F., Hodgkin S. T., 2002, MNRAS, 335, L79
- Fischer & Marcy (1992) Fischer D. A., Marcy G. W., 1992, ApJ, 396, 178
- Fisher (2004) Fisher R. T., 2004, ApJ, 600, 769
- Gould et al. (1997) Gould A., Bahcall J. N., Flynn C., 1997, ApJ, 482, 913
- Halbwachs et al. (2003) Halbwachs J. L., Mayor M., Udry S., Arenou F., 2003, A&A, 397, 159
- Hambly et al. (2001) Hambly N. C., Davenhall A. C., Irwin M. J., MacGillivray H. T., 2001, MNRAS, 326, 1315
- Hambly et al. (2001) Hambly N. C., MacGillivray H. T., Read M. A., Tritton S. B., Thompson E. B., Kelly B. D., Morgan D. H., Smith R. E., Driver S. P., Williamson J., Parker Q. A., Hawkins M. R. S., Williams P. M., Lawrence A., 2001, MNRAS, 326, 1279
- Henry & McCarthy (1990) Henry T. J., McCarthy D. W. J., 1990, ApJ, 350, 334
- Jameson et al. (2002) Jameson R. F., Dobbie P. D., Hodgkin S. T., Pinfield D. J., 2002, MNRAS, 335, 853
- Jeffries et al. (2003) Jeffries R. D., Oliveira J. M., Barrado y Navascués D., Stauffer J. R., 2003, MNRAS, 343, 1271
- Jeffries et al. (2001) Jeffries R. D., Thurston M. R., Hambly N. C., 2001, A&A, 375, 863
- Jeffries & Tolley (1998) Jeffries R. D., Tolley A. J., 1998, MNRAS, 300, 331
- Jeffries et al. (2000) Jeffries R. D., Totten E. J., James D. J., 2000, MNRAS, 316, 950
- Kalirai et al. (2003) Kalirai J. S., Fahlman G. G., Richer H. B., Ventura P., 2003, AJ, 126, 1402
- King (1962) King I. R., 1962, AJ, 67, 471
- Kroupa (2001) Kroupa P., 2001, MNRAS, 322, 231
- Kroupa (2002) Kroupa P., 2002, Science, 295, 82
- Kroupa & Bouvier (2003) Kroupa P., Bouvier J., 2003, MNRAS, 346, 369
- Kroupa et al. (2003) Kroupa P., Bouvier J., Duchêne G., Moraux E., 2003, MNRAS, 346, 354
- Leggett (1992) Leggett S. K., 1992, ApJS, 82, 351
- Leggett et al. (1996) Leggett S. K., Allard F., Berriman G., Dahn C. C., Hauschildt P. H., 1996, ApJS, 104, 117
- Littlefair et al. (2003) Littlefair S. L., Naylor T., Jeffries R. D., Devey C. R., Vine S., 2003, MNRAS, 345, 1205
- López-Martí et al. (2004) López-Martí B., Eisloffel J., Scholz A., Mundt R., 2004, A&A
- Luhman et al. (2003) Luhman K. L., Stauffer J. R., Muench A. A., Rieke G. H., Lada E. A., Bouvier J., Lada C. J., 2003, ApJ, 593, 1093
- Meusinger et al. (1996) Meusinger H., Schilbach E., Souchay J., 1996, A&A, 312, 833
- Moraux et al. (2001) Moraux E., Bouvier J., Stauffer J. R., 2001, A&A, 367, 211
- Moraux et al. (2003) Moraux E., Bouvier J., Stauffer J. R., Cuillandre J. C., 2003, A&A, 400, 891
- Naylor et al. (2002) Naylor T., Totten E. J., Jeffries R. D., Pozzo M., Devey C. R., Thompson S. A., 2002, MNRAS, 335, 291
- Oliveira et al. (2003) Oliveira J. M., Jeffries R. D., Devey C. R., Barrado y Navascués D., Naylor T., Stauffer J. R., Totten E. J., 2003, MNRAS, 342, 651
- Pinfield et al. (2003) Pinfield D. J., Dobbie P. D., Jameson R. F., Steele I. A., Jones H. R. A., Katsiyannis A. C., 2003, MNRAS, 342, 1241
- Pinfield et al. (1998) Pinfield D. J., Hodgkin S. T., Jameson R. F., 1998, MNRAS, 299, 955
- Preibisch et al. (2003) Preibisch T., Stanke T., Zinnecker H., 2003, A&A, 409, 147
- Reid et al. (2002) Reid I. N., Gizis J. E., Hawley S. L., 2002, AJ, 124, 2721
- Reid & Hawley (2000) Reid I. N., Hawley S. L., 2000, New light on dark stars. Springer-Praxis, Chichester, UK
- Reipurth & Clarke (2001) Reipurth B., Clarke C., 2001, AJ, 122, 432
- Sagar & Richtler (1991) Sagar R., Richtler T., 1991, A&A, 250, 324
- Salpeter (1955) Salpeter E. E., 1955, ApJ, 121, 161
- Schaller et al. (1992) Schaller G., Schaerer D., Meynet G., Maeder A., 1992, A&AS, 96, 269
- Stauffer (1982) Stauffer J. R., 1982, ApJ, 87, 1507
- Stauffer et al. (1984) Stauffer J. R., Hartmann L., Soderblom D. R., Burnham N., 1984, ApJ, 280, 202
- Sterzik & Durisen (2003) Sterzik M. F., Durisen R. H., 2003, A&A, 400, 1031
- Zapatero-Osorio et al. (1999) Zapatero-Osorio M. R., Rebolo R., Martín E. L., Hodgkin S. T., Crossburn M. R., Magazzù A., Steele I. A., Jameson R. F., 1999, A&AS, 134, 537
Appendix A Catalogues
Three electronic catalogues are available from this paper. The first is our entire photometric/astrometric catalogue, containing 133788 entries. A sample is shown below in Table A1 as a guide to its form and content. We also provide subsets of this catalogue which contain candidate members of NGC 2547, selected according to the criteria in section 3.3. Table A2 lists thise candidate members selected using the B02 isochrone, while Table A3 lists those selected using the DAM97 isochrone. The two catalogues contain 726 and 744 entries respectively, with 682 objects common to both. Note that these catalogues suffer from incompleteness and contamination as described in sections 3.4 and 3.5.
The format of these catalogues is one row per star consisting of a field number (note though that a star may have been detected in more than one field because of the overlaps), star identifier in that field, x and y pixel positions on a reference frame in that field, right ascension and declination (J2000.0), and three sets of magnitude, magnitude error and magnitude flags corresponding to the , and values respectively. The flags consist of two alphabetic characters for each magnitude, referring to the first and second measurements that contribute to the final magnitude. Objects with no problems in their detection or measurement are flagged “OO”, the other flags are described in Burningham et al. (2003).
The catalogues can be obtained from the online version of the journal
on Synergy, from the Centre de Données astronomiques de Strasbourg or the
Cluster Collaboration web page at
www.astro.ex.ac.uk/people/timn/Catalogues/description.html
| J2000 Position | Pixel Position | |||||||||||||
|---|---|---|---|---|---|---|---|---|---|---|---|---|---|---|
| Field | Star | R.A. | Dec. | X | Y | Mag. | Error | Flag | Mag. | Error | Flag | Mag. | Error | Flag |
| 51 | 3612 | 08 04 5.376 | -48 24 16.58 | 2036.691 | 66.065 | 25.449 | 0.755 | OE | -5.519 | 0.735 | OE | -0.167 | 0.904 | EE |
| 51 | 4639 | 08 04 5.386 | -48 28 11.35 | 2034.791 | 651.172 | 19.949 | 0.105 | OO | 0.798 | 0.113 | OO | -0.180 | 0.196 | OO |
| 51 | 5500 | 08 04 5.386 | -48 25 56.23 | 2035.732 | 314.446 | 20.910 | 0.250 | OO | 0.574 | 0.261 | OO | 0.789 | 0.311 | OO |
| 51 | 3903 | 08 04 5.396 | -48 29 44.64 | 2033.890 | 883.673 | 19.030 | 0.044 | OO | 0.421 | 0.046 | OO | 0.108 | 0.081 | OO |
| 51 | 2055 | 08 04 5.422 | -48 30 13.26 | 2033.065 | 955.029 | 17.524 | 0.021 | OO | 0.540 | 0.023 | OO | 0.273 | 0.033 | OI |
| 51 | 914 | 08 04 5.445 | -48 24 58.94 | 2034.706 | 171.642 | 17.425 | 0.026 | NN | 0.413 | 0.029 | NN | 0.161 | 0.033 | NN |
| 51 | 4781 | 08 04 5.484 | -48 30 27.57 | 2031.394 | 990.664 | 19.693 | 0.098 | OO | 0.061 | 0.110 | OO | 0.614 | 0.142 | OI |
| 51 | 3497 | 08 04 5.504 | -48 35 53.37 | 2028.676 | 1802.636 | 19.215 | 0.052 | OO | 0.745 | 0.056 | OO | 0.338 | 0.069 | OO |
| 51 | 4520 | 08 04 5.527 | -48 26 23.64 | 2032.090 | 382.744 | 20.322 | 0.126 | OO | 0.869 | 0.141 | OO | 0.026 | 0.211 | OO |
| 51 | 1225 | 08 04 5.553 | -48 27 18.73 | 2031.014 | 520.017 | 17.736 | 0.015 | OO | 0.394 | 0.016 | OO | 0.138 | 0.023 | OO |
| 51 | 3702 | 08 04 5.589 | -48 26 1.73 | 2030.705 | 328.098 | 18.685 | 0.067 | NN | 0.765 | 0.075 | NN | 0.276 | 0.082 | NN |
| 51 | 1446 | 08 04 5.602 | -48 36 32.15 | 2025.960 | 1899.284 | 17.595 | 0.032 | NN | 0.440 | 0.034 | NN | 0.158 | 0.040 | NN |
| 51 | 1105 | 08 04 5.606 | -48 35 39.95 | 2026.239 | 1769.169 | 17.266 | 0.011 | OO | 0.556 | 0.012 | OO | 0.157 | 0.016 | OO |
| 51 | 5222 | 08 04 5.609 | -48 36 55.65 | 2025.646 | 1957.868 | 19.032 | 0.099 | NN | 4.309 | 0.755 | NN | -2.119 | 0.154 | NN |
| 51 | 6203 | 08 04 5.622 | -48 33 1.15 | 2026.984 | 1373.438 | 20.080 | 0.107 | OO | 1.018 | 0.124 | OO | 0.408 | 0.140 | OO |
| 51 | 552 | 08 04 5.629 | -48 26 40.95 | 2029.409 | 425.844 | 16.429 | 0.006 | OO | 0.711 | 0.007 | OO | 0.212 | 0.009 | OO |
| 51 | 2619 | 08 04 5.632 | -48 30 47.40 | 2027.668 | 1040.092 | 18.994 | 0.044 | OO | 0.460 | 0.046 | OO | 0.072 | 0.072 | OO |
| 51 | 1854 | 08 04 5.635 | -48 24 25.17 | 2030.183 | 87.482 | 18.151 | 0.046 | NN | 0.549 | 0.050 | NN | 0.131 | 0.059 | NN |
| 51 | 2059 | 08 04 5.638 | -48 30 21.57 | 2027.665 | 975.724 | 17.768 | 0.037 | IO | 0.497 | 0.040 | IO | 0.267 | 0.045 | OI |
| 51 | 2194 | 08 04 5.642 | -48 34 20.88 | 2025.907 | 1572.124 | 18.413 | 0.057 | NN | 0.835 | 0.064 | NN | 0.580 | 0.060 | NN |
| 51 | 423 | 08 04 5.668 | -48 26 3.84 | 2028.733 | 333.376 | 16.348 | 0.006 | OO | 0.554 | 0.007 | OO | 0.183 | 0.008 | OO |
| J2000 Position | Pixel Position | |||||||||||||
|---|---|---|---|---|---|---|---|---|---|---|---|---|---|---|
| Field | Star | R.A. | Dec. | X | Y | Mag. | Error | Flag | Mag. | Error | Flag | Mag. | Error | Flag |
| 51 | 48 | 8 4 10.205 | -48 31 26.50 | 1914.251 | 1137.169 | 13.068 | 0.003 | OO | 0.570 | 0.004 | OO | 0.190 | 0.004 | OO |
| 51 | 260 | 8 4 12.936 | -48 27 12.39 | 1848.160 | 503.670 | 15.352 | 0.004 | OO | 1.246 | 0.005 | OO | 0.326 | 0.005 | OO |
| 51 | 4399 | 8 4 14.176 | -48 24 35.24 | 1818.334 | 111.949 | 20.033 | 0.087 | OO | 2.421 | 0.196 | OO | 0.682 | 0.100 | OO |
| 51 | 31 | 8 4 17.313 | -48 28 23.15 | 1739.295 | 679.771 | 12.827 | 0.003 | OO | 0.363 | 0.007 | OO | 0.093 | 0.004 | OO |
| 51 | 2012 | 8 4 19.765 | -48 28 58.81 | 1678.399 | 768.470 | 18.473 | 0.025 | OO | 1.786 | 0.039 | OO | 0.579 | 0.029 | OO |
| 51 | 55 | 8 4 23.267 | -48 24 43.58 | 1592.836 | 132.166 | 13.799 | 0.003 | OO | 0.705 | 0.004 | OO | 0.250 | 0.004 | OO |
| J2000 Position | Pixel Position | |||||||||||||
|---|---|---|---|---|---|---|---|---|---|---|---|---|---|---|
| Field | Star | R.A. | Dec. | X | Y | Mag. | Error | Flag | Mag. | Error | Flag | Mag. | Error | Flag |
| 51 | 48 | 8 4 10.205 | -48 31 26.50 | 1914.251 | 1137.169 | 13.068 | 0.003 | OO | 0.570 | 0.004 | OO | 0.190 | 0.004 | OO |
| 51 | 260 | 8 4 12.936 | -48 27 12.39 | 1848.160 | 503.670 | 15.352 | 0.004 | OO | 1.246 | 0.005 | OO | 0.326 | 0.005 | OO |
| 51 | 4399 | 8 4 14.176 | -48 24 35.24 | 1818.334 | 111.949 | 20.033 | 0.087 | OO | 2.421 | 0.196 | OO | 0.682 | 0.100 | OO |
| 51 | 106 | 8 4 15.530 | -48 27 30.30 | 1783.775 | 548.145 | 14.182 | 0.003 | OO | 0.634 | 0.004 | OO | 0.212 | 0.004 | OO |
| 51 | 31 | 8 4 17.313 | -48 28 23.15 | 1739.295 | 679.771 | 12.827 | 0.003 | OO | 0.363 | 0.007 | OO | 0.093 | 0.004 | OO |
| 51 | 55 | 8 4 23.267 | -48 24 43.58 | 1592.836 | 132.166 | 13.799 | 0.003 | OO | 0.705 | 0.004 | OO | 0.250 | 0.004 | OO |