Cold Neutral Gas in a Damped Lyman- System: Fuel for Star Formation
Abstract
We discuss interstellar temperature determinations using the excitation equilibrium of the levels of Si II and C II. We show how observations of the fine structure levels of Si II and C II (which have significantly different excitation energies, corresponding to and 92 K, respectively) can be used to limit gas kinetic temperatures. We apply this method to the damped Lyman- system toward the quasar PSS 1443+27. The lack of significant absorption out of the Si II level and the presence of very strong C II provides an upper limit to the temperature of the C II∗-bearing gas in this system. Assuming a solar Si/C ratio, the observations imply a limit K for this absorber; a super-solar Si/C ratio gives stricter limits, K. The observations suggest the presence of a cold neutral medium; such cold gas may serve as the fuel for star formation in this young galaxy.
1 Introduction
High-redshift damped Lyman- systems (DLAs) are the highest column density class of QSO absorption lines. Defined by (Wolfe et al. 1986), these systems are thought to trace the interstellar medium (ISM) of high-redshift galaxies. Dedicated surveys over the past two decades have helped trace the global properties of high-redshift DLAs, including their contribution to the cosmological baryon density (Storrie-Lombardi & Wolfe 2000; Prochaska & Herbert-Fort 2004), their chemical enrichment (e.g., Prochaska et al. 2003), their dust content (e.g., Pettini et al. 1994), and molecular fraction (Ledoux, Petitjean, & Srianand 2003). These studies have demonstrated that the DLAs have a baryonic mass density comparable to the mass density of modern galaxy disks, that the metallicity of high- DLAs is slowly increasing, and that the majority of DLA sight lines have low dust-to-gas ratios and molecular fractions.
Understanding the detailed physics of the ISM in DLAs is an important step in understanding high-redshift galaxies in general. Wolfe, Prochaska, & Gawiser (2003a) have constructed detailed models for the thermal equilibrium of the ISM in a set of DLAs, calculating the heating rate experienced by the gas due to the ultraviolet emission from young hot stars. They used observations of absorption out of the level of C II (hereafter C II∗) – a direct indicator of the cooling rate through [C II] 158 m emission (Pottasch, Wesselius, van Duinen 1979) – to infer the actual heating rate experienced by the gas (assuming thermal equilibrium). Their comparison of the inferred and calculated heating rates suggests DLAs harbor significant star formation.
The models of Wolfe et al. (2003a,b) required that the observed C II∗ in DLAs arise in a cold neutral medium (CNM), i.e., in gas with temperatures K; their WNM models give SFRs that violate observations of the bolometric background. The detection of absorption in some high- DLAs is further evidence that at least some of these systems contain a CNM (Ledoux et al. 2003; Hirashita & Ferrara 2005). However, such temperatures are at odds with 21-cm absorption studies; all DLAs searched for 21-cm absorption show K () (Kanekar & Chengalur 2003). Wolfe et al. (2003b) argue that this discrepancy is likely due to the differing properties of the sight lines probed by the optical background sources and by the more extended radio sources.
In this Letter we present a method for determining the kinetic temperature of interstellar matter based solely on basic atomic physics. Our method compares the excitation of the upper fine-structure levels in Si II and C II, which have excitation energies that differ by a factor of four. We describe our approach in §2. We apply this technique to the DLA toward the quasar PSS 1443+27 in §3, demonstrating that this DLA contains a substantial reservoir of cold gas. Lastly, we discuss the implications of this temperature determination in §4.
2 Determining Gas Temperatures from and
In this section we discuss how analysis of the fine structure excitation in Si II and C II can be used to limit interstellar kinetic temperatures. Srianand & Petitjean (2000) have used a similar analysis to limit temperatures and densities in an associated absorber. Silva & Viegas (2002, hereafter SV) give a detailed summary of the excitation equilibrium of fine structure lines in DLAs.
We treat the excitation of the fine structure states as a two-level atom.111This is appropriate given the temperatures of the ISM probed by low-ionization absorption lines ( K). The equilibrium ratio of the densities in the upper and lower levels (Spitzer 1978), and , respectively, is
| (1) |
The quantities , , and are the familiar Einstein transition probabilities. The energy density of the cosmic microwave background, , for direct excitation of the transitions is calculated assuming a standard cosmology, i.e., , where K (Mather et al. 1999). The fluorescent rates due to the great opacity of the ground-state transitions of interest (Sarazin, Rybicki, & Flannery 1979; see Wolfe et al. 2003a). The summations describe excitations and deexcitations with collision partners (, , and H0), where is the particle density of each partner and and are the Maxwellian-averaged collision rate coefficients for excitation and deexcitation. The collision rates are related to one another and to , the collision strength (Spitzer 1978), by:
| (2) |
where is the energy of the level above the ground state, and is the gas kinetic temperature. We adopt atomic data from the same sources as SV throughout.
The column density of material in the level of C II is
| (3) |
where is the gas-phase abundance of carbon, is the density of neutral hydrogen, is the differential pathlength along the line of sight, and the ratio is a function of four quantities: , , , and (Eqn. 1). We have assumed , consistent with limits on C I in DLAs (see Figure 12 of Wolfe et al. 2003b). A similar expression applies for Si II∗. The column densities of C II∗ and Si II∗ are therefore density- and excitation-weighted integrals over pathlength.
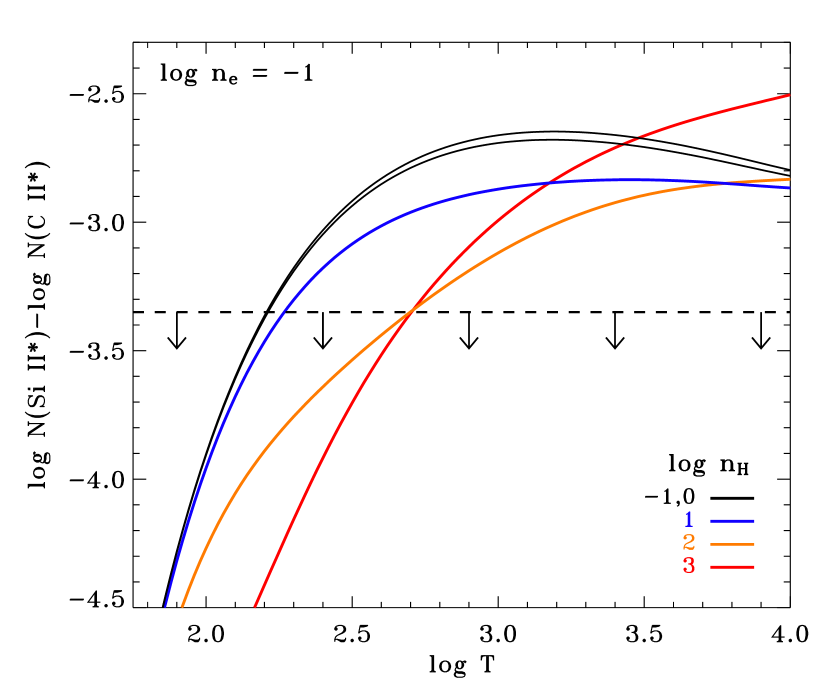
To understand the usefulness of Si II∗ and C II∗ to limit gas temperatures, imagine that the excitation of the states were only due to electron collisions and deexcitation due to spontaneous emission. In this case , i.e., the ratio is only a function of temperature and the Si/C ratio. Figure 1 shows the ratio as a function of temperature, including all of the terms in Eqn. (1), for several densities at assuming [Si/C]=0.222[X/Y]. varies slowly with temperature for K (for all but the highest densities) and more strongly at lower temperatures. The sensitivity to density is modest, especially for low , because the populations of the levels of Si II and C II depend on density in a similar manner. We use the ratio of the to levels of C II and Si II to constrain the allowable range of densities.
Gas at K produces ratios ; the corresponding optical depth ratio of the 1264.738 Å line of Si II∗ to the typically-unresolved 1335.663 and 1335.708 Å doublet of C II∗ is (-values from Morton 2003). Thus, the use of this ratio to distinguish cool from warm temperatures requires large C II∗ optical depths and good S/N at Si II∗. Observations of will allow a range of parameters , and , which apply to the C II∗-bearing gas. However, the maximum allowable temperature can be low if the limits on are low.
3 Application to the Damped Lyman- System Toward PSS 1443+27
Prochaska et al. (2001) present high-resolution (), high S/N observations of the DLA toward of the quasar PSS 1443+27 using HIRES (Vogt et al. 1994) on the Keck I 10-m telescope. The properties of this DLA are summarized in Table 1. Due to its redshift and relatively strong metal lines, column densities can only be measured for a few species. Table 1 gives a measurement of Fe II (from the 1611.2 Å transition) and meaningful limits on C II∗, Si II and Si II∗. All but the last of these are from Prochaska et al. (2001).
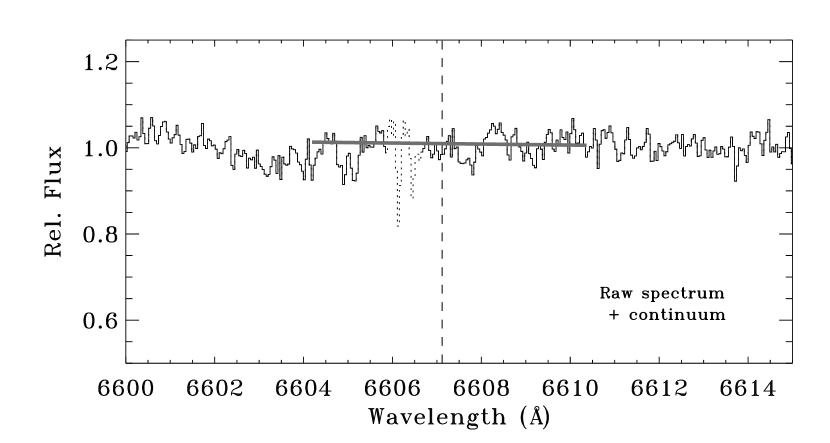
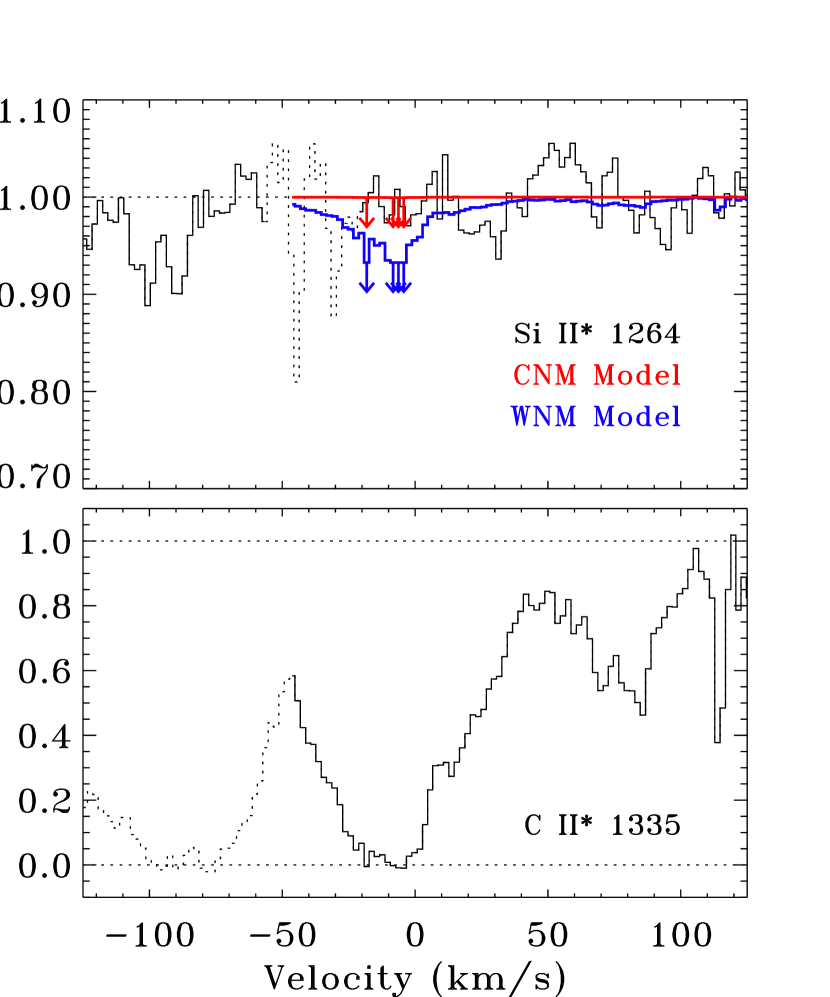
Figure 2 shows the HIRES spectrum at the expected location of Si II∗ in this absorber, including our fitted continuum. Our limit to Si II∗ was determined using an empirically-measured signal-to-noise ratio (following Sembach & Savage 1992) and includes continuum placement uncertainties. Figure 3 shows the normalized profiles of Si II∗ and C II∗. Also shown are models for the expected Si II∗ absorption for a canonical warm neutral medium (WNM; with cm-3, , and K) and CNM (with cm-3, , and K). The models are derived by scaling the C II∗ profile by the amount predicted using Eqns. (1) and (3) and assuming [Si/C]. The hypothesis that C II∗ absorption toward PSS 1443+27 arises in a canonical WNM is not consistent with the observations.
To limit , we calculate the excitation balance of the fine structure levels of Si II and C II for densities and and temperatures . We compare these calculations with our observational limits for , , and to constrain the physical properties (, , and ) of the gas in the C II∗-bearing gas.333These three physical quantities are coupled in the calculations. A wide range of T-dependent and values are allowable, and only T is stringently constrained in our analysis.
The allowable range of physical conditions in the PSS 1443+27 DLA then depends upon the ratios of Si/C and C/Fe, which are used for determining the expected and , respectively. C II is rarely measurable in DLAs due to saturation effects; we estimate from (Table 1) with an assumed abundance ratio. As a fiducial, we adopt the solar system ratios from Grevesse & Sauval (1998): and . This gives . Nucleosynthetic effects are unlikely to modify the C/Fe ratio, as a roughly solar value is found in low-metallicity Milky Way stars (e.g., Carretta, Gratton, & Sneden 2000). However, nucleosynthetic effects could enhance element abundances, leading to high Si/C ratios (see, e.g., Prochaska 2004). In one case where the C II measurements may be reliable, D’Odorico & Molaro (2004) find and (assuming the Fe II column from Lu et al. 1996). This implies [C/Fe] and [Si/C] compared with our adopted solar system abundances. The overall metallicity of this absorber is [Si/H], however, which is significantly lower than the metallicity of the DLA studied in this work.
The presence of dust will raise the C/Fe ratio due to differential depletion. The depletion of Fe in DLAs is typically modest, similar to the “halo” and “disk-halo” clouds in the Milky Way (Savage & Sembach 1996) with [Fe/H].444The intrinsic gas+dust abundance in the Milky Way is [Fe/H]. Thus, unlike the case in DLAs, the sub-solar gas-phase Fe/H quoted here is due entirely to depletion into dust grains. For diffuse clouds in the Milky Way, Sofia et al. (2004) find [C/H]. Thus, we expect [C/Fe]. In low-depletion Milky Way clouds, and by extension DLAs, Si is likely not depleted much differently from C, and we assume [Si/C]. The small number of species for which measurements are possible in the DLA toward PSS 1443+27 make it difficult to judge the degree of Fe depletion. Moderate depletion is suggested by [Si/Fe], but this could also result from -enhanced abundances.
We give temperature limits for the C II∗-bearing gas in the DLA toward PSS 1443+27 for six different abundance assumptions in Table 2. The first three assume [Si/C] with [C/Fe], +0.3, and +0.6, allowing for modest levels of depletion. The next three assume [Si/C], i.e., -enhanced abundances (see Prochaska 2004). We note that the model in which [Si/C][C/Fe] is not self-consistent: scaling both Si II and Fe II by solar abundances gives inconsistent values for the C II column density.
The highest limit is K, assuming assuming [C/Fe] and [Si/C]. This is likely an extreme assumption for the C/Fe ratio. The highest temperature limit for -enhanced abundances, which we prefer due to the distribution of [Si/Fe] at very low metallicities (where dust depletion effects are likely small; see Prochaska 2004), is K. Temperatures above 1400 K, consistent with limits for the DLAs observed at 21-cm (Kanekar & Chengalur 2003), require [C/Fe] to +0.8 for both solar and -enhanced abundances. We feel this is inconsistent with our knowledge of differential depletion in the Milky Way and DLAs.
4 Discussion
We have presented a method for limiting gas temperatures in the ISM of galaxies through measurements and analysis of the fine structure levels of Si II and C II. We have applied this method to limit the properties of the C II∗-bearing gas in the DLA toward PSS 1443+27. We rule out the hypothesis that the C II∗ absorption arises in a WNM. Our conservative temperature limit for this gas is K; we obtain stricter temperature limits if [Si/C] or [C/Fe]: K. The detection of a CNM (Wolfire et al. 1995) in a high-redshift DLA is significant: while the gas seen in this DLA is likely not associated with the dense star-forming clouds, our result demonstrates that the physical conditions of the ISM in this system do not preclude the existence of cold material, including, in principle, the dense clouds from which stars could form.
The detection of a CNM in the z=4.224 absorber toward PSS 1443+27 is the first detection at such a large redshift. We stress that our measurements allow a WNM as part of a multiphase medium toward PSS 1443+27, but the majority of the C II∗ cannot come from warm material.555We have tested the effects of multiphase absorbers on our technique, with as much as half of the ground-state ions arising in a WNM. We find that there is very little impact on the derived maximum temperatures (Howk et al. 2005). The existence of CNM material may be a feature of many high- DLAs, as suggested by Wolfe et al. (2003a,b). While H I 21-cm absorption-line measurements suggest the presence of cold H I in DLAs, no 21-cm absorption has been found in DLAs with (Kanekar & Chengalur).666Only six DLAs have been observed; PSS 1443+27 has not been searched for 21-cm absorption. We note, however, that at least three DLAs show absorption (Ledoux et al. 2003), indicating the presence of cold gas (Hirashita & Ferrara 2005). Searching for toward PSS 1443+27 might be difficult due to the strength of the Lyman- forest at . In the future we will apply our method for determining gas kinetic temperatures to DLAs for which 21-cm and measurements have been attempted.
We note that the DLA toward PSS 1443+27 may not be typical. It shows a high metallicity ([Si/H]), especially compared with other DLAs (Prochaska et al. 2003). Furthermore, we chose this DLA for this experiment because it has very strong C II∗. It has the highest C II∗/H I ratio measured, some dex above the next highest (the DLA toward Q2206-19; Wolfe et al. 2004). The intensity of radiation in this DLA calculated following Wolfe et al. (2004) is higher than all other systems. Although the fuel for star formation may be present in this DLA, no optical counterpart to this DLA has been identified in deep ground-based and Hubble Space Telescope images of PSS 1443+27 (Prochaska et al. 2002; L. Storrie-Lombardi, private communication).
The method presented here will be discussed further, and temperature limits given for a larger number of DLAs, in Howk et al. (2005). We note that the use of the relative populations of the levels of Si II and C II may also be useful for constraining temperatures in Milky Way gas.
References
- (1) Carretta, E., Gratton, R.G., & Sneden, C. 2000, A&A, 356, 822
- (2) D’Odorico, S., et al. 2000, Proc. SPIE, 4005, 121
- (3) Grevesse, N., & Sauval, A.J. 1998, SSRv, 85, 161
- (4) Hirashita, H., & Ferrara, A. 2005, MNRAS, 356, 1529
- (5) Howk, J.C., et al. 2004, in preparation.
- (6) Kanekar, N., & Chengular, J.N. 2003, A&A, 399, 857
- (7) Ledoux, C., Petitjean, P., & Srianand, R. 2003, A&A, 346, 209
- (8) Lu, L., Sargent, W.L.W., Barlow, T.A., Churchill, C.W., & Vogt, S.S. 1996, ApJS, 107, 475
- (9) Mather, J.C., Fixsen, D.J., Shafer, R.A., Mosier, C., Wilkinson, D.T. 1999, ApJ, 512, 511
- (10) Morton, D.C. 2003, ApJS, 149, 205
- (11) Petitjean, P., Srianand, R., & Ledoux, C. 2000, A&A, 364, L26
- (12) Pottasch, S. R.,Wesselius, P. R., & van Duinen, R. J. 1979, A&A, 77, 189
- (13) Pettini, M., Smith, L.J., Hunstead, R.W., & King, D.L. 1994, ApJ, 426, 79
- (14) Prochaska, J.X. 2004, IAU Proc., eds. P. Nissen and M. Pettini (astro-ph/0310850)
- (15) Prochaska, J.X., et al. 2001, ApJS, 137, 21
- (16) Prochaska, J.X., et al. 2002, AJ, 123, 2206
- (17) Prochaska, J.X., & Herbert-Fort, S. 2004, PASP, 116, 622
- (18) Prochaska, J.X., & Wolfe, A.M. 2002, ApJ, 566, 68
- (19) Roueff, E. 1990, A&A, 234, 567
- (20) Sarazin, C.L., Rybicki, G.B., & Flannery, B.P. 1979, ApJ, 230, 456
- (21) Silva, A.I., & Viegas, S.M. 2002, MNRAS, 329, 135 (SV)
- (22) Sofia, U.J., Lauroesch, J.T., Meyer, D.M., & Cartledge, S.I.B. 2004, ApJ, 605, 272
- (23) Spitzer, L. 1978, Physical Processes in the Interstellar Medium (New York: John Wiley), Chap. 4
- (24) Srianand, R., & Petitjean, P. 2000, A&A, 357, 414
- (25) Storrie-Lombardi, L.J., & Wolfe, A.M. 2000, ApJ, 543, 552
- (26) Vladilo, G., Centurion, M., Bonifacio, P., & Howk, J.C. 2001, ApJ, 557, 1007
- (27) Vogt, S.S., et al. 1994, proc. SPIE, 2198, 362
- (28) Walborn, N.R., Danks, A.C., Vieira, G., & Landsman, W. 2002, ApJS, 140, 407
- (29) Wolfe, A. M., Prochaska, J. X., & Gawiser, E. 2003a, ApJ, 593, 215
- (30) Wolfe, A. M., Gawiser, E., & Prochaska, J. X. 2003b, ApJ, 593, 235
- (31) Wolfe, A.M., Turnshek, D.A., Smith, H.E., & Cohen, R.D. 1986, ApJS, 61, 249
- (32) Wolfire, M. G., Hollenbach, D., McKee, C. F., Tielens, A. G. G. M., & Bakes, E. L. O. 1995, ApJ, 443, 152
- (33)
| Quantity | Value |
|---|---|
| 4.2240 | |
| Model | [Si/C] | [C/Fe] | [K] | aaHydrogen density giving maximum allowed temperature in each model. |
|---|---|---|---|---|
| 1 | +0.0 | +0.0 | 1.44 | |
| 2 | +0.0 | +0.3 | 1.04 | |
| 3 | +0.0 | +0.6 | 0.56 | |
| 4 | +0.3 | +0.0 | 1.46 | |
| 5 | +0.3 | +0.3 | 1.14 | |
| 6 | +0.3 | +0.6 | 0.64 |