21st Century VLBI: Deep Wide-Field Surveys
Abstract
A 20-hour VLBI observation with the NRAO VLBA and GBT in the NOAO Boötes field reaches an rms noise of 9 microJy per beam at 1.4 GHz. Three sources were detected at 10-milliarcsecond resolution within the GBT primary beam of FWHM 8.6′, including the 20-milliJy calibrator and two sub-milliJy sources. By tapering the visibility data, portions of the VLBA primary beam of FWHM 29′ were imaged at poorer sensitivity and resolution to yield five further detections. New developments at JIVE will permit deeper and wider VLBI surveys at full sensitivity and resolution, enabling new types of survey science.
Joint Institute for VLBI in Europe, Dwingeloo, NL
National Radio Astronomy Observatory, Socorro, NM, U.S.A.
Netherlands Foundation for Radio Astronomy, Dwingeloo, NL
1. Motivation
Very Long Baseline Interferometry (VLBI) observations, and VLBI surveys in particular, have contributed significantly to our understanding of active galaxies. For example, the discovery of superluminal motion in these systems provided the first clue that viewing angle was an important parameter in interpreting and eventually unifying different classes of active galaxies, including radio galaxies and quasars (Urry & Padovani 1995). More recently, VLBI has provided direct evidence for an evolutionary scenario wherein very young compact sources are the precursors of giant extended sources associated with radio galaxies (Taylor et al. 2000). Numerous other advances are summarized in these Proceedings.
At GHz frequencies, VLBI surveys usually target sources distributed across the sky. The sources are also often pre-selected to be strong ( mJy) and to exhibit flat spectra (e.g., Beasley et al. 2002). Such samples are largely dominated by intrinsically luminous active galaxies at moderate redshifts . Self-calibration techniques can be used for such bright sources so calibration overhead is minimal. But the observation time per source is reduced by needing to slew the array from source to source. Also, most observers impose a typical image field of view () of milliarcseconds, ensuring that only one source is detected in any given observation time . Such VLBI surveys are therefore slow and the biases introduced are substantial.
Recent attempts have been made to survey weaker ( mJy) sources using phase referencing in the switching style. Such VLBI surveys take advantage of the huge catalog of FIRST sources now available at 1.4 GHz with a resolution of 5′′ (White et al. 1997). These VLBI surveys are usually localized to a region subtending a few square degrees and including a strong phase calibrator close to weaker targets. Example surveys are presented in these Proceedings by Gurvits et al. (2004) and by Wrobel et al. (2004). These surveys are both unbiased as no spectral pre-selection is made and efficient as they minimize array slewing. But phase referencing in the switching style causes substantial calibration overhead, leaving a typical observation time per source of minutes. For the weaker VLBI detections, the dynamic range can be 10 or less. For the stronger VLBI detections, the dynamic range is often limited by residual phase-referencing errors. These limitations mean that jets and other secondary features can easily be missed, making morphological classification difficult. Although a milliarcseconds is required to accommodate FIRST’s astrometric accuracy, this is still small enough to ensure only one target per . Moreover, the 10-milliJy sources from FIRST still involve essentially the same radio source populations that are targeted in the bright surveys (Ivezić et al. 2002).
Indeed, at 1.4 GHz most sources slightly stronger than mJy are energized by active nuclei (e.g., Condon et al. 2003). What steps can be taken toward studying the more diverse sub-milliJy population at resolutions of, say, 10 milliarcseconds (80 pc at for , , and km s-1 Mpc-1)? Sources brighter than 0.1 milliJy have an areal density of 0.2 per square arcminute, so about a dozen are expected within the primary beam of a 100-m class antenna. Therefore, progress can be expected if two technical goals can be reached: achieve wider fields of view and lower detection thresholds, such that many sources can be observed simultaneously with the VLBI array.
For a connected array with short baselines, the is often set by the primary-beam response of the antennas in the array. For VLBI this is rarely the case. In VLBI, a more demanding limitation is set by the frequency and time sampling used during data correlation. This sampling must be fine enough to mitigate the effects of both bandwidth and time-average smearing in images. Also, since preserving scales computationally with the square of the baseline length, generating wide-field VLBI images is often limited by the off-line computing resources available. This latter restriction has introduced a psychological barrier, which is that most VLBI observers over-average their data in both the time and frequency domains to make data sets more manageable. Data-averaging collapses both the and the total information content, leaving us with the postage-stamp VLBI images with which we are all so familiar.
2. Deep, Wide-Field EVN Imaging in the HDF-N
The sub-milliJy population in a region containing the Hubble Deep Field-North (HDF-N) was observed using the EVN at 1.6 GHz, 25-milliarcsecond resolution, and 64-MHz bandwidth (Garrett et al. 2001). The observations spanned two 16-hour segments but phase referencing in the switching style left an observation time of only hours. A a few arcminutes in diameter was set by bandwidth and time-average smearing, and by the primary-beam responses of the largest antennas in the array. The EVN clearly detected sources stronger than 210 microJy per beam (5) in two of the five target patches imaged within the . One detection locates the active nucleus and an adjacent feature in an FR-I galaxy at , while the other detection is a candidate active nucleus embedded in an obscured starburst at . The observed rms noise levels were higher than the expected thermal levels, due to residual phase-calibration errors.
3. Deep, Wide-Field VLBA+GBT Imaging in Boötes
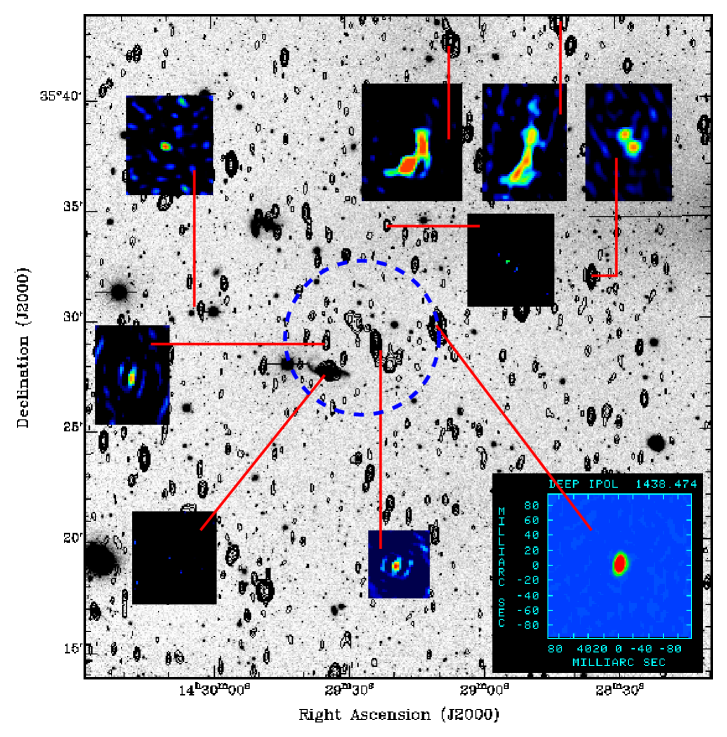
We have improved upon the HDF-N survey with a VLBI observation in the NOAO Boötes field using the NRAO VLBA and GBT at 1.4 GHz and 64-MHz bandwidth (Garrett, Wrobel, & Morganti, in preparation). The VLBA is described by Napier et al. (1994). The observations spanned three 8-hour segments. Phase referencing in the in-beam style led to an observation time hours. Two correlation passes were made within the GBT primary beam of FWHM 8.6′, shown as the circle in the figure. The passes were centered on the in-beam calibrator and on a region with six faint WSRT targets (de Vries et al. 2002, Morganti & Garrett 2002). For each pass, a 4′ in diameter was preserved and the output data rate of 1 MByte per second yielded a data set of size 60 GBytes.
The data from the calibrator pass were edited, averaged, and calibrated, and its gain parameters applied to the target-pass data. The AIPS task IMAGR was used to make dirty images/beams from the target-pass data after editing and calibration. Each dirty image subtended a square 6′′ on a side. For each target, three such dirty images were made from the three observation segments and then simply co-added. This was a slow computational task: about 8 hours were required to produce one dirty image/beam on a 2-GHz Linux PC with dual processors. For the stronger sources, cleaned images were produced with AIPS task APCLN by subtracting the dirty beam from the dirty image. Visibility-based cleaning is currently prohibitively expensive in terms of computing requirements.
Three sources were detected within the GBT primary beam, at a resolution of 10 milliarcseconds and above the detection threshold of 63 microJy per beam (7). These detections include the 20-milliJy calibrator and two sub-milliJy sources. Each detection is unresolved and has NOAO photometric data available (Januzzi & Dey 1999). The calibrator is a quasar. One sub-milliJy detection locates the active nucleus with milliJy within an FR-I galaxy with milliJy. The other sub-milliJy detection has milliJy and recovers most of the milliJy. This is a candidate active nucleus because, at the comological distance suggested by the host’s blue drop-out, (1) the spectral luminosity is too high for prompt emission from a SN and (2) the WSRT photometry spanning 20 months shows no variability, arguing against emission from a GRB afterglow. Finally, the disk galaxy NGC 5646 at with milliJy was not detected at 10-milliarcsecond resolution; its WSRT emission follows the optical isophotes and obeys the FIR/radio correlation, suggesting a star formation origin.
By tapering the visibility data, portions of the VLBA primary beam of FWHM 29′ were imaged at poorer sensitivity and resolution to yield five further detections. These detections involve brighter radio sources probably hosted by active galaxies and quasars, but the available NOAO photometric data have not yet been analysed.
The long-term goal for these new VLBI surveys is to constrain the contribution that active galaxies make to the faint radio source population in general, and the optically faint radio/sub-mm source population in particular (Garrett 2003). To have an impact in this area, it is essential that many sources be surveyed over large regions with rms sensitivities of a few microJy. Global VLBI arrays employing disk-based recordings should be able to achieve such sensitivities. The proposed PCInt program at JIVE will enable output data rates as high as 160 MBytes per second, remarkably expanding the accessible . It will thus be possible to sample simultaneously the summed response of all milliarcsecond-scale emission within (and beyond) the primary-beam response. After some phase-referencing to improve the coherence time, simple self-calibration of most fields should be possible at frequencies of 1-3 GHz. Access to GRID-like computing resources may be the best way to analyse the enormous data sets generated. Huge and unbiased VLBI surveys will be conducted, with the bulk of the targets being faint sources with flux densities of only a few tens of microJy.
Acknowledgments.
This work made use of images provided by the NDWFS, which is supported by NOAO. NOAO is operated by AURA, Inc., under a cooperative agreement with the NSF. NRAO is a facility of the NSF operated under cooperative agreement by AUI.
References
Beasley, A. J., et al. 2002, ApJS, 141, 13
Condon, J. J., et al. 2003, AJ, 125, 2411
de Vries, W. H., et al. 2002, AJ, 123, 1784
Garrett, M. A., et al. 2001, A&A, 366, L5
Garrett, M. A. 2003, New Technologies in VLBI, ed. Y. C. Minh
Gurvits, L. I., et al. 2004, this volume
Ivezić, Z̆. et al. 2002, AJ, 124, 2364
Jannuzi, B. T., & Dey, A. 1999, in ASP Conf. Ser. Vol. 191, Photometric Redshifts and High Redshift Galaxies, ed. R. J. Weymann et al. (San Francisco: ASP), 111
Morganti, R., & Garrett, M. A. 2002, ASTRON Newsletter,
No. 17
(http://www.astron.nl/astron/newsletter/2002-1/)
Napier, P. J., et al. 1994, Proc. IEEE, 82, 658
Taylor, G. B., et al. 2000, ApJ, 541, 112
Urry, C. M., & Padovani, P. 1995, PASP, 107, 803
White, R. L., et al. 1997, ApJ, 475, 479
Wrobel, J. M., et al. 2004, this volume