Near IR Spectroscopic monitoring of WR 140 during the 2001 periastron passage
Abstract
We present new spectra of WR 140 (HD 193793) in the bands with some covering the 1.083-m He i emission line at higher resolution, observed between 2000 October and 2003 May to cover its 2001 periastron passage and maximum colliding-wind activity. The WC7 + O4-5 spectroscopic binary WR 140 is the prototype of colliding-wind, episodic dust-making Wolf-Rayet systems which also show strong variations in radio and X-ray emission. The spectra showed changes in continuum and in the equivalent widths of the WC emission lines, consistent with formation of dust starting between 2001 January 3 and March 26 (orbital phases 0.989 and 0.017) and its subsequent fading and cooling. The 1.083-m He i line has a P-Cygni profile which showed variations in both absorption and emission components as WR 140 went through periastron passage. The variation of the absorption component of the profile yielded tight constraints on the geometry of the wind-collision region, giving for the opening semi-angle of the interaction region ‘cone’, indicating a wind-momentum ratio , about three times larger than previously believed. As the system approached periastron, the normally flat-topped emission component of 1.083-m line profile showed the appearance of a significant sub-peak. The movement of the sub-peak across the profile was seen to be consistent with its formation in wind material flowing along the contact discontinuity between the WC7 and O4-5 stellar winds and the changing orientation of the colliding wind region as the stars moved in their orbits. The flux carried in the sub-peak was significant, exceeding the X-ray fluxes measured at previous periastron passages. This additional source of radiative cooling of the shock-heated gas probably causes it to depart from being adiabatic around periastron passage, thereby accounting for the departure of the X-ray flux from its previously expected -dependency.
keywords:
binaries: spectroscopic – circumstellar matter – stars: individual: WR 140 – stars: Wolf-Rayet – stars: winds1 Introduction
Stars with M 30M⊙ go through a Wolf-Rayet (WR) phase in their evolution, during which they undergo large scale mass loss ( 10-5 year-1). Consequently they display broad emission line spectra and large infrared excesses originating in their accelerated stellar winds (wind terminal velocity v∞=750–5000 km s-1). They are post-main sequence stars which have lost most of their hydrogen envelopes through stellar winds in the pre-WR stage. Based on the emission lines seen, they are classified as WN stars (lines of He, N and H), WC and WO stars (lines of He, C and O). Late WC stars (WC7–9) show evidence of circumstellar dust, mainly of amorphous carbon (Williams 1995). Some of them are persistent dust makers which show continuous dust formation and others are episodic dust makers, where we see periodic rises in their IR flux due to episodic formation of dust. It is believed, now, that episodic dust making WC stars are massive binary systems in which the stellar winds of two massive stars interact. WR 140 (HD 193793) is the prototype of colliding-wind, episodic dust forming WC stars (Williams 1995).
From the photometry of the infrared maxima in 1977 and 1985 and earlier data, Williams et al. (1987) found that the occurence of the IR maxima and the dust formation were periodic and derived a period of 7.9 years. Studying the existing radial velocity data, from which no orbit had previously been derived, they showed that WR 140 was indeed a spectroscopic binary with high eccentricity. This was extended to a multi-wavelength study, including 1.65–12.6 m light curves, radio and X-ray data by Williams et al. (1990, hereafter W90), who derived a photometric period days (7.94 y) and a spectroscopic orbit from published radial velocities giving elements , =328o and T0=JD 244616029 (1985.260.08)). The system formed dust for about four months, 4% of the period, during periastron passage. This is perhaps one of the least well understood of the phenomena shown by WR 140.
The most recent periastron passage and dust-formation episode occurred in early 2001, for which a multi-wavelength observing campaign was planned and undertaken.
Marchenko et al. (2003) carried out optical photometric and spectroscopic observations and derived a spectroscopic period days, in excellent agreement with the photometric period and new orbital elements, =0.8810.005, =46.71.6o and T0=JD 2446147.43.7, which we use in this paper. They found that at phases very close to periastron, the profiles of the 5696Å C iii and 5876Å He i lines developed extra emission components at their ‘blue’ ends which rapidly moved to the red.
Panov & Dinko (2002) observed a minimum in UBV photometric bands in 2001 June (phase = 0.038-0.046). This minimum was observed at the same phase, but deeper than the optical minimum observed in 1993 (Panov, Altmann & Seggewiss 2000). By 2001 July, the optical light almost reached the pre-eclipse level. They interpreted this eclipse-like phenomenon as due to the carbon dust envelope, the formation of which was triggered at the periastron passage. The difference in the rising part of the eclipse light curves of 1993 and 2001 could be due to the differences in clumping in the expanding dust shell from cycle to cycle. Aperture masking interferometric observations by Monnier, Tuthill & Danchi (2002) using the Keck Telescope showed the first direct images of dust in WR 140. Comparison of their pre-periastron observation in 1999 June and post-periastron observation in 2001 July at 2.2 m shows expanding clumpy dust. They resolved five clumps in the shell, expanding with velocities 0.46–1.29 milliarcsec. day-1.
| UKIRT + CGS4 (150 lines/mm grating, R=4700) | ||||
| UT Date | JD | Bands/ | Phase | |
| yyyymmdd.dddd | 2450000+ | |||
| 20001013.3495 | 1830.85 | 1.07,1.1 | 0.9605 | 0.5092 |
| 20001225.1921 | 1903.69 | 1.083 | 0.9856 | 0.2506 |
| 20001226.2004 | 1904.7 | 1.083 | 0.9860 | 0.2465 |
| 20010318.654 | 1987.15 | 1.083 | 1.0144 | 0.2507 |
| 20010331.6208 | 2000.12 | 1.083 | 1.0189 | 0.3018 |
| UKIRT + CGS4 (40 lines/mm grating) | ||||
| R=800 in J band, R=400 in H and K bands | ||||
| 20010331.6618 | 2000.16 | J,H,K | 0.0189 | 0.3020 |
| 20010428.6164 | 2028.12 | J,K | 0.0285 | 0.4045 |
| 20010521.5254 | 2051.03 | J,H,K | 0.0364 | 0.4810 |
| 20010605.4691 | 2065.97 | J,K | 0.0416 | 0.5277 |
| 20010613.5553 | 2074.06 | J | 0.0444 | 0.5521 |
| 20010704.6004 | 2095.1 | J,H,K | 0.0516 | 0.6129 |
| 20010812.2456 | 2133.75 | J,H,K | 0.0650 | 0.7156 |
| 20010909.3325 | 2161.83 | J,H,K | 0.0747 | 0.7841 |
| 20011006.2138 | 2188.71 | J,H,K | 0.0839 | 0.8457 |
| 20011122.2333 | 2235.73 | J,K | 0.1001 | 0.9452 |
| 20011226.1985 | 2269.7 | J,K | 0.1119 | 1.0115 |
| 20020403.6638 | 2368.16 | J,H,K | 0.1458 | 1.1816 |
| 20020630.3636 | 2455.86 | J,H,K | 0.1761 | 1.3104 |
| 20020717.5517 | 2473.05 | J,H,K | 0.1820 | 1.3335 |
| UKIRT + UIST (IJ, HK & shortJ grisms) | ||||
| R=3000-shortJ, R=950-IJ & R=800-1000-HK grism | ||||
| 20030524.5496 | 2784.05 | shortJ | 0.2893 | 1.6542 |
| 20030524.5640 | 2784.06 | IJ | 0.2893 | 1.6542 |
| 20030524.5740 | 2784.07 | HK | 0.2893 | 1.6542 |
| Mt. Abu (R=1000) | ||||
| 19980508.9457 | 0942.45 | JHK | 0.6540 | 1.7620 |
| 20001221.575 | 1900.08 | JH | 0.9844 | 0.2650 |
| 20001222.5658 | 1901.07 | J | 0.9847 | 0.2610 |
| 20001223.5958 | 1902.10 | J | 0.9851 | 0.2570 |
| 20010102.5861 | 1912.09 | J | 0.9885 | 0.2168 |
| 20010103.6090 | 1913.11 | J | 0.9889 | 0.2127 |
| 20010326.9995 | 1995.50 | J | 0.0173 | 0.2836 |
| 20010328.9988 | 1997.50 | J | 0.0180 | 0.2914 |
| 20010402.9167 | 2002.42 | J | 0.0197 | 0.3106 |
| 20010403.8743 | 2003.37 | J | 0.0200 | 0.3145 |
The programme of near-infrared spectroscopy described in the present paper was undertaken to search for changes in the infrared line spectrum, particularly the profile of the He i line at 1.083 m, around the time of maximum colliding wind activity. Previous 1-micron and spectroscopy, e.g. Vreux, Andrillat & Biémont (1990), Eenens, Williams & Wade (1991), and observations of the 1.083-m He i line profile (Eenens & Williams 1994), were made at phases far from periastron. In each observation, the 1.083-m emission-line profile showed a flat top, characteristic of formation in the asymptotic region of the Wolf-Rayet wind, with no evidence of a sub-peak which could be formed in a wind collision region (Stevens & Howarth 1999). Nevertheless, given the very high eccentricity of the binary system and short duration of maximum colliding-wind activity such as dust formation, we considered it worth reobserving the 1.083-m profile as close to the periastron as possible.
2 Observations
We observed near-IR spectra of WR 140 using the 3.8-m United Kingdom Infrared Telescope (UKIRT) on Mauna Kea, Hawaii and the 1.2-m Mt. Abu Infrared Telescope, India. The UKIRT observations were made using the Cooled Grating Spectrometer (CGS4) and the UKIRT 1–5 micron Imager Spectrometer (UIST) while the Mt. Abu observations were made using an LN2 cooled NICMOS array imager and spectrometer. We observed WR 140 from 2000 October to 2003 May, covering the periastron passage expected in 2001 February. No observations were possible during January and February since WR 140 was not available at night. From 2000 October to 2001 March, the He i line at 1.083 m was observed using CGS4 and 150 lines/mm grating at a spectral resolution of 4700, after which this grating was not available for observations. In 2003 May, this line was again observed using UIST with the short J grism, which gives a spectral resolution of 3000 with a 2-pixel slit. From 2001 March, observations were performed in , and bands using CGS4 and the 40 lines/mm grating, which gives a resolution of 800 in the band in the second order and 400 in the and bands in the first order. Observations using the Mt. Abu spectrometer were done in the bands


at a resolution of 1000 in 1998 May and from 2000 Dec. to 2001 April. Due to decreasing transmission of the blocking filter towards shorter wavelengths, the S/N of the J spectra observed by the Mt. Abu spectrometer decreases towards 1.083 m. However, the line profile variations of the He i line are clearly seen. Table 1 gives details of the spectroscopic observations. In the last column, refers to the separation between the O star and the WC star at any epoch of observation and refers to the semi-major axis of the relative orbit with the WC star at one of the focii.

3 The -band spectra

Figs. 1 and 2 show the -band spectra observed from Mauna Kea and Mt. Abu respectively. One of the Mt. Abu spectra (2001 Jan 2) is also shown in Fig. 1 along with the spectra of later epochs from Mauna Kea for comparison of the continuum. Fig. 3 shows the and spectra. The gap in the spectra is the region where the telluric absorption makes the atmospheric transmission poor. Each spectrum is labelled with the date of observation and orbital phase of the binary system. Fig. 4 shows the observed, flux-calibrated spectra observed on 2003 May 24 using UKIRT and UIST. The data were flux calibrated using photometry from Mt. Abu Observatory on 2003 June 5 and 12, which gave average magnitudes of and respectively. Spectra of 2003 May 24 are dereddened assuming E(B-V) = 0.6 (Eenens & Williams 1992) and the equivalent widths of the spectral lines are determined fitting Gaussian profiles. Multiple Gaussians are fitted when the lines are blended. Table 2 lists the spectral lines identified and their fluxes and equivalent widths, estimated from the de-reddened spectra. 1 errors are given in brackets against the estimated values. The main source of errors is from the definition of the continuum. The error estimates are done from multiple attempts of the fits. Line identifications are done in comparison with the near IR spectra of WR 140 and the identifications of Eenens & Williams (1992) and from the atomic line list of Peter van Hoof111van Hoof, P. A. M., http://star.pst.qub.ac.uk/∼pvh/. For the 1.083 m He i line, since the line was flat topped, multiple lines were fitted to estimate the line flux and EW. A comparison of the line fluxes with those of Eenens & Williams (1992) (spectra taken in 1988 July, phase=0.41) shows that the line fluxes of most of the prominent lines match well, implying that the wind properties of the system are very much repeatable.
| Main | Other probable | Flux | EW | FWHM | |
|---|---|---|---|---|---|
| m) | contributor | contributors | (10-15W/m2) | (Å) | km/s |
| 0.933 | C iii | 0.9347(He ii), 0.936,0.941(C iii) | 153 (5.7) | -20.3 (0.9) | 3160 (67) |
| 0.934(C iv) | |||||
| 0.9529 | He i | 0.954(O iii) | 26 (2) | -3.7 (0.3) | |
| 0.972 | C iii | 0.975,0.965 (C iii), 0.977(O v) | 2431 (5) | -371 (2.1) | |
| 0.987 | C iv | 0.984(O v) | 122 (13) | -19.2 (2.2) | |
| 1.0126 | He ii | 1.003(He i, C iv), 1.011-1.023(C iii) | 380 (3) | -62 (0.7) | 3320 (30) |
| 1.055 | C iv | 1.055(C iii), 1.053(C iv) | 82 (2.2) | -16 (0.5) | 3412 (45) |
| 1.083 | He i | 1.078(O v), 1.091(He i) | 558 (3) | -121 (1) | |
| 1.094 | He ii | 44 (2.5) | -10 (1) | ||
| 1.1 | C iv | ||||
| 1.139 | C iv | 30 (2.2) | -7.5 (0.6) | 2800 (120) | |
| 1.163 | He ii | 1.163(C iv), 1.164(C iii) | 220 (1) | -60 (1) | |
| 1.165 | C iii | 1.168(He ii) | |||
| 1.191 | C iv | 1.188(C iv), 1.191(O v) | 424 (2.5) | -124 (1) | |
| 1.199 | C iii | 1.197(He i) | |||
| 1.205 | O v | 1.211(C iii) | 47 (3) | -14 (1.5) | |
| 1.226 | C iv | 7.3 (1) | -2.3 (0.3) | ||
| 1.247 | O v | 66 (1.4) | -23 (1) | ||
| 1.255 | C iii | 1.253(He i), 1.256(C iii) | |||
| 1.258,1.261(C iii), 1.255(O v) | |||||
| 1.282 | He ii | 1.279,1.285(He i), 1.277(C iv) | 70 (1.3) | -27 (0.6) | 3600 (30) |
| 1.298 | C iv | 1.307(C iv), 1.297(He i) | 21.8 (2.3) | -9 (1) | |
| 1.435 | C iv | 1.434(C iv) | 140 (3) | -78 (1.8) | 3637 (85) |
| 1.454 | C iii | 22 (5) | -13 (3) | ||
| 1.476 | He ii | 1.473(C iii), 1.47(O v) | 88 (2.1) | -55 (2) | |
| 1.491 | C iv | 1.489(He ii) | |||
| 1.547 | He i | 1.547,1.551(O iv) | 5.5 (0.7) | -4 (0.6) | |
| 1.552 | He i | ||||
| 1.572 | He ii | 27 (0.7) | -21 (0.5) | ||
| 1.588 | He i | 1.58-1.59(O v) | |||
| 1.635 | C ii | 1.635(O v) | 8.5 (0.8) | -7.5 (0.7) | 2700 (225) |
| 1.641 | He i | ||||
| 1.664 | C iv | 10.7 (0.7) | -9.8 (0.7) | ||
| 1.693 | He ii | 1.712(C iv), 1.699(O v) | 25 (1) | -24.8 (1) | |
| 1.701 | He i | ||||
| 1.736 | C iv | 1.736,1.737(C iv) | 148 (0.5) | -152 (0.5) | 3240 (25) |
| 1.785 | C ii | 1.790(C iv) | 83 (3) | -92 (3) | |
| 1.801 | C iv | 1.814(He i), 1.819(C iv), 1.820(C ii) | |||
| 1.944 | He i | 13.5 (0.7) | -19.5 (1) | 2530 (85) | |
| 2.012 | C iv | 2.010(C iv) | 6.0 (0.6) | -9.5 (0.95) | |
| 2.059 | He i | 284 (3.4) | -493 (7) | ||
| 2.071 | C iv | 2.080(C iv) | |||
| 2.107 | C iv | 2.108(C iii) | 71 (1.2) | -130 (2.5) | |
| 2.113 | He i | ||||
| 2.122 | C iii | 2.139(C iii) | |||
| 2.150 | He i | 7.3 (0.8) | -13.9 (1.4) | ||
| 2.165 | He i, He ii | 2.161(He i, C ii), 2.274(C ii) | |||
| 2.189 | He ii | 24 (1.4) | -47 (3) | ||
| 2.278 | C iv | 10 (1) | -23.4 (2.3) | 3080 (155) | |
| 2.318 | C iv | 2.314(He ii) | 13 (0.7) | -31 (1.6) | |
| 2.325 | C iii | 2.328,2.371(C iv) | |||
| 2.347 | He ii | ||||
| 2.423 | C iv | 65 (0.7) | -175 (1.9) | ||
| 2.429 | C iv | 2.426(C iv) | |||
| 2.433 | C iv | 2.432(O v) | |||
| 2.473 | He i | 2.472(He i), 2.470(O v) | 22 (0.8) | -62 (2.6) | |
| 2.486 | He i |
| Date | Phase | 1.165 | 1.255 | 1.282 | 1.435 | 1.736 | 1.944 | 2.43 |
|---|---|---|---|---|---|---|---|---|
| EW | EW | EW | EW | EW | EW | EW | ||
| 19880715 | 0.4176 | -55 | -29.44 | -30.3 | -78.6 | |||
| 19980508 | 0.6541 | -66.8 | -27.6 | -38. | -163.0 | |||
| 20001221 | 0.9844 | -57.0 | -35 | -33 | ||||
| 20001223 | 0.9851 | -68.9 | -24.0 | -28.0 | ||||
| 20010102 | 0.9885 | -62.4 | -35.4 | -30.3 | ||||
| 20010103 | 0.9889 | -55.0 | -30.1 | -36.9 | ||||
| 20010326 | 0.0173 | -50.1 | -21.4 | -24.4 | ||||
| 20010328 | 0.0179 | -49.8 | -20.7 | -26.2 | ||||
| 20010331 | 0.0189 | -47.8 | -19.5 | -22.0 | ||||
| 20010402 | 0.0197 | -55.0 | -26.6 | -29.0 | ||||
| 20010403 | 0.0200 | -56.2 | -24.4 | -26.7 | ||||
| 20010428 | 0.0285 | -49.4 | -20.6 | -22.4 | -37.9 | -60.7 | ||
| 20010521 | 0.0364 | -58.2 | -22.7 | -26.8 | -44.5 | -73.0 | -13.4 | -40.2 |
| 20010605 | 0.0416 | -57.2 | -21.8 | -24.0 | -12 | -47.6 | ||
| 20010613 | 0.0444 | -50.0 | -25.2 | -28.6 | ||||
| 20010704 | 0.0516 | -59.9 | -23.8 | -27.7 | -51.0 | -92.0 | -14.0 | -50.9 |
| 20010812 | 0.0650 | -56.3 | -24.2 | -27.1 | -51.9 | -104.0 | -15.8 | -65.6 |
| 20010909 | 0.0747 | -57.1 | -24.0 | -28.0 | -55.8 | -110.0 | -16.4 | -69.1 |
| 20011006 | 0.0839 | -59.9 | -23.9 | -28.0 | -59.7 | -112.5 | -17.9 | -79.0 |
| 20011122 | 0.1001 | -58.2 | -24.3 | -27.8 | -15.6 | -90.0 | ||
| 20011226 | 0.1119 | -61.4 | -25.1 | -29.6 | -15.8 | -94.3 | ||
| 20020403 | 0.1458 | -58.5 | -25.3 | -31.2 | -62 | -125.6 | -21.6 | -108.5 |
| 20020630 | 0.1761 | -56.7 | -26.6 | -30.3 | -65 | -131.8 | -21 | -126.5 |
| 20020717 | 0.1820 | -58.4 | -27.1 | -31.9 | -64.7 | -135.2 | -20.3 | -131.0 |
| 20030524 | 0.2893 | -63.1 | -23 | -26.1 | -76.7 | -148.8 | -24.2 | -170.6 |
As a measure of the influence of dust emission on the spectra, we give the equivalent widths of prominent emission lines estimated from the observed spectra in Table 3. The 1 errors are of the EW for the He i line at 1.945 m. For the rest of the lines they are . Assuming that the fluxes within the emission lines did not change, it is evident from the EWs of those in the 1.25–1.28 m region that dust formation began between 2001 January 3 and March 26 (orbital phases 0.989 and 0.017). At the time of the 2001 March 26 spectrum, light curves from previous cycles predict contributions (relative to the total flux) by dust emission of 22 in J, 55 in H and 76 in K, i.e. dust-to-wind ratios 0.28, 1.2 and 3.2. These are a strong function of wavelength within the bands, e.g. rising from 0.24 at 1.16 micron to 0.32 at 1.28 micron. This is consistent with infrared light curves from previous cycles (W90), which predict dust emission with a steeply rising spectrum having at phase 0.017 a flux ratio of 0.28 to the stellar wind in the band. The EWs of the 1.166-m feature are harder to interpret, partly bcause of increased scatter on their measured strengths and partly because dust emission at this wavelength is about two-thirds that at 1.25 m (from the model fit to the photometry at this phase in W90). Also, as can be seen in Fig. 1, the slope of the continuum of the spectrum taken in 2001 March 31 is much flatter than that taken on January 2. By the time of the 2003 May observation, when the light curves predict that the dust emission contribution to the total flux had fallen to 10 per cent in the band and below 5 per cent in and bands owing to the cooling of the dust, the slope in the region had returned to that before dust formation. The and spectra show the change in continuum caused by variable amount of dilution due to emission from the dust. The region shows a nearly flat spectrum during 2001 April when the dust emission was at maximum at these wavelengths, and the spectra became steeper when the dust became cooler. The equivalent widths (Table 3, which includes EWs estimated from the spectrum of Eenens, Williams & Wade (1991), observed in 1988 with UKIRT and CGS2) of six of these lines are plotted as a function of orbital phase in Fig. 5. This shows the effect of the dilution due to the thermal emission from the dust and the dust cooling. There is a phase lag in the rise of equivalent width with wavelength. This is due to the cooling of the dust and peak emission from the dust shifting to higher wavelengths due to cooling.

4 The 1.083-m He i line profile
4.1 The absorption component of the profile

The UKIRT high-resolution spectra covering the He i line (2s3S – 2p3P) at 1.083 m, corrected for the line-of-sight velocity of the WC star at the time of observation, are shown in Fig. 6. This line, and its singlet counterpart at 2.058 m, show P Cygni absorption profiles from which wind terminal velocities of –2650 km s-1 (Lambert & Hinkle 1984), –2860 km s-1 (Williams & Eenens 1989) and –2900 km s-1 (Eenens & Williams 1994) have been measured. These velocities are in good agreement with that (–2900 km s-1) derived from the violet edge of the saturated part of the UV C iv P Cygni line profile, , by Prinja, Barlow & Howarth (1990), considered to be a better measure of the terminal velocity than the extreme violet edge of the absorption component, km s-1.
From our high-resolution spectra of the 1.083-m line, we measured , the velocity at the blue edge of this absorption profile where the absorption merges with the continuum, and , the velocity at the maximum of the P Cyg absorption with respect to the line centre. Two vertical lines are drawn in Fig. 6, at the line centre and at v = 2840 km s-1, which is the on 2000 December 25/26, before the periastron passage. Table 4 lists the and measured from the high resolution spectra. The errors in these velocities are within 30 km s-1. The core velocities, , are consistent with the measurements of and show a smooth variation across the periastron passage, as can be seen well in Table 4 and Fig.6. The variations in observed in the He i line profile are unlikely to be caused by any He i absorption profile in the wind of the O star. The inset in Fig. 4 shows the spectrum of BS 6736 (9 Sgr), an O4 V((f)) star (Walborn 1972), observed with CGS4 in 2001 June. The spectrum of 9 Sgr does not show any significant absorption at this wavelength. We therefore assume that the observed He i absorption occurs in the WC wind material.
As in the UV resonance line profiles, the values of are greater than , showing a maximum value of 3320 km s-1 in 2000 October and 2001 March and slightly less ( 3250 km s-1) in 2000 December and 2003 May. These velocities are close to that measured from the UV profiles ( 3200 km s-1) by Prinja et al. and most probably reflect observation of one or both of the stars through turbulent material near the wind-collision zone.

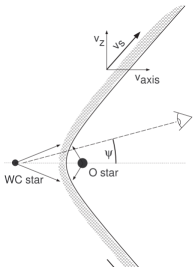
The depth of the P-Cygni absorption component varies considerably, being greater in the 2001 March and 2003 May spectra than in the 2000 October and December spectra. We interpret this in terms of variation of wind material in the sightline to the underlying stellar continuum, which is provided by both the WC7 and O4-5 stars. The greatest absorption was observed in the 2001 March spectra, when our sightline to both stars passed through the He-rich WC stellar wind. This is illustrated in Fig. 7, showing the configurations of the WR 140 system at the epochs of the 1.083-m spectra. This sketch is in the plane of the orbit; the sightline is from the negative-Y direction and at an angle to the plane of , where is the orbital inclination. On the other hand, the absorption was very much smaller in the 2000 October spectrum. At this phase, the system was nearly at conjunction and we expect the sightline to the O4-5 star to pass through its solar-composition wind (Fig. 7). The configuration in the plane of the axis passing through the two stars and the sightline at the time of the 2000 October observation is shown in Fig. 8. The relatively low He i absorption seen at this phase implies that the angle between the sightline and the axis passing through the two stars is small enough that we observe both stars mostly through the O-star wind, which we assume to provide significantly less He i absorption than the WC wind. Some He i absorption occurs in the WC wind before it hits the interaction region and some in the latter, where turbulence probably accounts for the slightly higher observed at this phase. To interpret the variation of the He i absorption, we must compare the angle , which depends on the orbital elements and phase, with the geometry of the wind interaction region.
Both sketches show the contact discontinuities separating the winds. These are defined as the surfaces where the ram pressures of the stellar winds balance, and depend on the wind-momentum ratio
| (1) |
| UTDate | Phase | vedge | vabs | sub-peak | PCyg | ||||
| (yyyymmdd) | (km/s) | (km/s) | blue edge11footnotemark: 1 | red edge11footnotemark: 1 | central vel.11footnotemark: 1 | flux | abs. | ||
| (km/s) | (km/s) | (km/s) | (W m-2) | EW | |||||
| 20001013 | 0.960 | 1.96 | 3316 | 2860 | -210522footnotemark: 2 | -526 | -1284 | 3.3 e-1433footnotemark: 3 | 2.4 |
| 20001225/6 | 0.986 | 3.99/4.06 | 3254 | 2840 | -216722footnotemark: 2 | -58 | -1056 | 8.4 e-1433footnotemark: 3 | 2.0 |
| 20010318 | 0.014 | 3.99 | 3327 | 2790 | -674 | +2521 | +1060 | 13.1 e-14 | 6.1 |
| 20010331 | 0.019 | 3.31 | 3315 | 2790 | -1080 | +2674 | +801 | 13.2 e-14 | 5.8 |
| 20030524 | 0.289 | 0.61 | 3254 | 2720 | 0. | 5.2 | |||
| 11footnotemark: 1 velocity with reference to the central wavelength of the WR HeI emission line | |||||||||
| 22footnotemark: 2 upper limit - the real blue edge will be bluer than this | 33footnotemark: 3 lower limit | ||||||||
The surface wraps around the star having the lower wind momentum, the O star, on account of its lower mass-loss rate. It has a bow towards the WC star and tends towards a ‘cone’ on the other side of the O star. Where the orbital motion is slow compared with the stellar wind, the surface is symmetric about the axis joining the WC and O stars. In the case of WR 140, this holds for most of the orbit, except near periastron, when the orbital motion is great enough to cause the interaction region to trail behind the axis at large distances from the stars (Fig. 7). Here, we are concerned with absorption in the winds, which occurs close to the stars, and will ignore the azimuthal ‘twisting’ of the interaction regions. Analytical formulae for the form of the contact discontinuity are given by Eichler & Usov (1993) and Cantó, Raga & Wilkin (1996). For comparison with the angle , we use the opening semi-angle of the ‘cone’ given by Eichler & Usov (1993)
| (2) |
The angle is given by
| (3) |
where is the true anomaly and the argument of periastron. We used the value of determined by Marchenko et al. (2003) and their orbital elements to calculate for each observation. Only the inclination, , is unknown.
Setia Gunawan et al. (2001) derived from the red-shifted absorption components the C iv and Si iv resonance lines observed in an IUE spectrum observed at phase 0.01 and near inferior conjunction (O star behind) on their orbital elements. The new orbital elements of Marchenko et al., however, make a significant difference to the expected configuration of the binary system, which is shifted to about 45∘ after conjunction at the time of this crucial IUE observation, so that it no longer usefully constrains the inclination. Accordingly, we calculated for a range of inclinations for the phase of each observation.
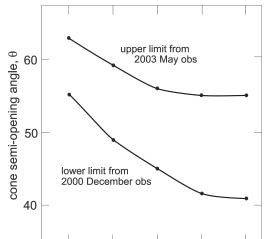
The strong absorption in 2001 March and weak absorption in 2000 October do not greatly constrain , but the intermediate observations, on 2000 December 25 and 26 and 2003 May, are particularly valuable. The December spectra concur in showing an absorption feature as weak as that in the October spectrum, indicating that we were still observing the O star through the O star wind. This allows us to set a lower limit on the ‘cone’ angle , which increases with falling inclination. This is illustrated in Fig. 9. Soon after the December observations, the contact discontinuity between the winds swept through our sightline, which then passed through the WC stellar wind, accounting for the high absorption observed in the 2001 spectra when the ‘cone’ was directed away from us. By the time of the 2003 observation, the He i absorption was still strong, indicating that the ‘cone’ edge had not yet crossed our sightline, setting an upper limit on , again depending on the inclination (Fig. 9).
Thus, is fairly tightly constrained, and our observations rule out values around (Eichler & Usov) derived from the wind-momentum ratio, , given by the mass-loss rates and terminal velocities from W90. This implies that the momentum of the O star wind had been underestimated or that of the WC star overestimated. There is little scope for changing the values for the two stars, which come from observations. The mass-loss rate for the O star () was adopted from average values (Prinja et al.) while that of the WC star was derived from the 5-GHz flux density at radio minimum, with allowance for the contribution from the wind of the O star. We cannot rule out a three-fold higher mass-loss rate for the O star but note that the value adopted by W90 is supported by recent determinations ( for the O4 V((f*)) star HD 303308 and for the O5 V((f)) star HD 15629, Repolust, Puls & Herrero 2004). We therefore believe that the WC star’s mass-loss rate was overestimated because its wind is clumped. A clumped wind with a volume filling factor (Dessart et al. 2000) would have mass-loss rate a factor lower, yielding and . This is consistent with the limits set by our He i observations, and will be adopted here.
4.2 The emission component of the He i line
The He i line at 1.083 m is a very good tracer of colliding-wind phenomena in massive binaries (Stevens & Howarth 1999). It forms in the asymptotic region of the WR wind and thus it becomes sensitive to wind interactions which can be observed from additional spectroscopic features on its normally flat top. Eenens & Williams (1994) observed a flat-topped 1.083 m He i-line profile from WR 140 with UKIRT and CGS2 at a resolution of on 1990 June 20 (corresponding to orbital phase = 0.66) although sub-peaks were observed from some other WC stars. Re-observation of WR 140 with UKIRT on 1991 October 19 ( = 0.83) confirmed the absence of structure on the flat top of the 1.083-m line profile. Yet, by = 0.96, the phase of our first high-resolution () UKIRT observation, a conspicuous sub-peak had appeared at the short-wavelength end of the profile (Fig. 6). We interpret the appearance of this new emission feature in the intervening as evidence of increased interaction of the WC and O type winds as the stars moved closer to each other in their orbit. Between phases 0.83 and 0.96, the separation of the stars decreased from to , so that the density of undisturbed winds having an density distribution would have increased by a factor of .
The next high-resolution UKIRT spectra observed on 2000 December 25 and 26 show the sub-peak to have strengthened by a factor of (Table 4). Corroboration of the presence of the sub-peak comes from the Mt. Abu -band spectra (Fig. 2) observed on December 21–23. The sub-peak was still present on the short-wavelength end of the profile on 2001 January 2–3 (Fig. 2), after which WR 140 was too close to the Sun for us to observe. When WR 140 was again observable in 2001 March, both the UKIRT high-resolution and the Mt. Abu spectroscopy showed that the sub-peak had shifted to the red end of the profile. We can also track the sub-peak in the -band UKIRT spectra (Fig. 1): the sub-peak is visible at the red end of the profile in the 2001 April–July spectra (apart from June 13, which has poor S/N), weakening, broadening and moving back to the centre of the profile in the August–November spectra. It may still be present in the subsequent spectra, which do not show flat-topped profiles. By the time of our next high-resolution spectrum, in 2003 May (Fig. 6), the profile was flat-topped and the sub-peak had gone. The structure on the 1.083-m He i profile is present for only a small fraction of the period, but apparently a larger fraction than the structures analagous to our sub-peaks on the 5696-Å C iii and 5896Å He i lines observed by Marchenko et al.
Marchenko et al. found that the strengths of the structures on the 5696-Å C iii and 5896Å He i lines varied with separation of the binary components more steeply than the dependency expected. We have fewer measurements, but it seems that the 1.083-m behave similarly. As noted above, the flux in the sub-peak increased by a factor between our 2000 October and December observations while the reciprocal separation, , increased by a factor of 2.05. These spectra were observed before dust formation began and were calibrated with lower resolution spectrum and photometry. The flux calibration of the 2001 March spectra, observed when there was a contribution from heated dust to the continuum, is less certain, being based on a magnitude, , taken for these phases from the J band light curve of W90 and corrected for the thermal emission from the dust. But it seems that the flux in the sub-peak is stronger still in 2001 March.
The movement of the sub-peak is readily understood, qualitatively at least, in terms of the changing orientation of the wind-collision zone with orbital motion, especially around the time of periastron passage. Fig. 7 shows the configuration of WR 140 with the WC star at the origin and the O star in its relative orbit at the orbital phases of the high-resolution UKIRT spectra. The shock cone, wrapped around the O star, is also shown. The observer is in the negative Y direction (i.e. the line of nodes is parallel to the X axis). The high resolution UKIRT spectra of the 1.083 m He i line are overplotted on this diagram to demonstate the evolution of the sub-peak on the He i line. Its position shifted in accordance with the motion of the components and the associated orientation of the shock cone with respect to the observer, and intensity, with the separation between the components.
We can develop a simple model assuming that the emitting material flows along a thin shell defined by the contact discontinuity, but recognise that real wind collisions are turbulent, full of instabilities and much more complicated (e.g. Walder & Folini 2002, Folini & Walder 2002). In Fig. 8, showing a view of the configuration of the system in 2000 October, the shaded area shows the compressed wind material flowing in a thin shell along the contact discontinuity. Cantó et al. (1996) have given a formula for the wind velocity as a function of position on the surface as it accelerates from near the stagnation point between the stars to reach an asymptotic value on the asymptotic region of the contact discontinuity, defined by subtended at the WC star in the notation of Cantó et al., approximated by the ‘cone’ of opening semi-angle in the discussion in the previous section. We can resolve into components parallel () and perpendicular () to the axis of symmetry. Emission by material flowing in this shell at any particular phase would have radial velocities in the range:
| (4) |
where for that phase come from Eqn 3. We do not know where along the surface the emission arises from. If the material near the stagnation point is shock-heated to K, it seems reasonable to assume that the He recombination occurs down-wind and that the emission arises from material on the asymptotic or ‘cone’ region of the surface, where the velocity has reached its asymptotic, constant value. This becomes analogous to the thin shell model of Lührs (1997) and Hill, Moffat & St-Louis (2002) except that, instead of solving for the cone angle and flow velocity, we will adopt the value of derived above and determine the flow velocity following Cantó et al. (eqn 29) from the terminal velocities of the WC and O stars (2860 km s-1 and 3100 km s-1 respectively, W90)
From these, we derived velocity components km-1 and km-1 for our surface, which corresponds to . We use these and Eqn 4 to model the variation of the RV of the centre and extent of the emission from the thin shell as a function of phase for different values of the inclination. This is shown for and in Fig. 10, where the models are compared with the observed velocities of the centre and extent measured from our high-resolution UKIRT spectra.
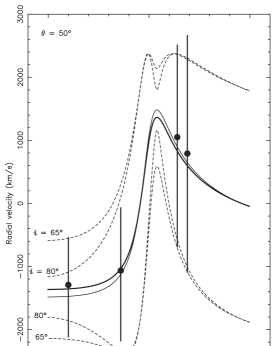
The agreement is very encouraging: the simple models successfully explains the movement of the centre of the line and reasonably approximate its width. From comparision with the October observation, we suggest that the orbital inclination is close to . The discrepanicies at the blue edges of the pre-eclipse sub-peaks are expected since we are not able to measure accurately the ‘real’ blue edge of the sub-peak before the periastron passage since it overlaps the steep, P-Cygni absorbed, region of the profile, which also results in an under-estimation of the flux in the subpeak during these phases. Given the uncertainties, we have not attempted a formal solution for inclination. Tests showed that the model is not very sensitive to in the range set by the absorption components (Fig. 9).
5 Discussion
The flux in the sub-peak (Table 4) on the He i profile is a significant source of cooling for the shock-heated material, exceeding the 2–6 keV X-ray flux ( Wm-2) observed with EXOSAT near the time of the 1985 periastron passage (W90) or the 1–10 keV flux ( Wm-2) observed with ASCA by Koyama et al. (1994) in 1993 June, shortly after the following periastron passage.
Koyama et al. (1994) also noted that their X-ray flux was not significantly different from that observed with Ginga in 1987 (Koyama et al. 1990), at a phase when the orbital separation was times that of their 1993 observation. They pointed out that this, and the EXOSAT results, showed no convincing evidence that the X-ray flux above 2 keV, which should be relatively unaffected by interstellar or orbitally modulated circumstellar extinction, varied systematically with orbital separation. This was in contrast to the -dependence expected theoretically for the X-ray luminosity of WR140 (Stevens, Blondin & Pollock 1992), on the basis that the shocked winds were close to adiabatic because the cooling time of the shocked X-ray emitting material was long compared with the characteristic flow time.
This discrepancy was studied further with additional ASCA data by Zhekov & Skinner (2000) and Pollock, Corcoran & Stevens (2002). Both studies sought to adjust the orbital elements of WR 140 derived by W90 to recover the -dependence for the X-ray fluxes, either reducing the eccentricity to or bringing forward T0 by 0.025P (72 days). The proposed lower eccentricity is effectively ruled out by confirmation of the high eccentricity in the more recent orbital solutions by Setia Gunawan et al. () and Marchenko et al. (). From the variations of the 1.083m He i line profile observed around the periastron passage (Figs 1, 2 and 6), we see that the sub-peak remained blue shifted until 2001 January 2 and had moved to the red end of the profile by March 18. If we are correct in interpreting this movement as a change of the orientation of the wind-collision region moving with the stars in their orbits, then quadrature and periastron passage must have occurred after January 2. This is consistent with the predictions of T0 of 2001 February 20 (W90) or February 6 (from elements by Marchenko et al.) but rules out the 72-day shift to December 10 proposed by Zhekov & Skinner. (Setia Gunawan et al. also proposed moving T0 forward, by 104 days. relative to the elements of W90, but with a relatively large uncertainty, 117 days, which does not constrain our solution.)
We propose instead that the X-ray flux departs from a -dependence because the shocked WC wind is not totally adiabatic during periastron passage as a consequence of significant additional cooling in the He i sub-peak.
6 Conclusions
Infrared spectroscopy of WR 140 during and after its 2001 periastron passage showed dilution of the emission lines consistent with the formation of circumstellar dust between 2001 January 3 and March 26, phases 0.989 and 0.017. The He i 1.083-m line showed a strong P-Cygni profile. Variation of the strength of the absorption component measured from high-resolution spectra was interpreted in terms of the passage of different parts of the colliding wind structure in our line of sight to the two stars. This allowed us to set fairly tight limits on the opening half angle of the ‘cone’ modelling the interaction region: . This, in turn, indicated a wind-momentum ratio , signifcantly higher than the found from the mass-loss rates and terminal velocities of the WC7 and O components. We suggested that the mass-loss rate of the WC7 star, derived from the 5-GHz flux density at radio minimum was overestimated because the wind is clumped.
At phases () close to periastron passage, the normally flat-topped emission component of the 1.083-m line showed the appearance of a sub-peak which moved from the blue to the red end of the profile during periastron. The evolution of the position and width of the sub-peak were found to be reasonably conistent with the flow of the emitting material along the surface of the interaction region modelled by a cone having . The maximum radiative flux in the sub-peaks is greater than the 1–10 keV X-ray flux at periastron and is a significant source of cooling of the shocked WC wind. We suggest that the shocked WC wind is not totally adiabatic near periastron, thereby accounting for the departure of the X-ray flux from the previously expected -dependence and, as suggested by Marchenko et al., allowing dust formation.
Acknowledgments
We would like to thank UKIRT Service Observing program for obtaining some of the spectra of WR 140. UKIRT is operated by the Joint Astronomy Centre, Hilo, Hawaii, on behalf of the U.K. Particle Physics and Astronomy Research Council. Mt. Abu observatory is operated by the Physical Research Laboratory, Ahmedabad, India, funded by the Dept. of Space, Govt. of India. We also would like to thank the staff members of UKIRT and Mt. Abu observatories, who helped us with data collection at various stages of this monitoring campaign. WPV would like to thank Andrew J. Adamson for his help and support for this work. We also thank Sean Dougherty and referee Paul Crowther for many valuable comments and suggestions.
References
- (1) Cantó J., Raga A. C., Wilkin F.P., 1996, ApJ, 469, 729
- (2) Dessart L., Crowther P. A., Hillier D. J., Willis A. J., Morris P. W., van der Hucht K. A., 2000. MNRAS 315, 407
- (3) Eenens P. R. J., Williams P. M., 1992, MNRAS, 255, 227
- (4) Eenens P. R. J., Williams P. M., 1994, MNRAS, 269, 1082
- (5) Eenens P. R. J., Williams P. M., Wade R., 1991, MNRAS, 252, 300
- (6) Eichler D., Usov V. 1993, ApJ, 402, 271
- (7) Folini D., Walder R., 2002, in: A. F. J. Moffat & N. St. Louis (eds) Interacting Winds from Massive Stars, ASP Conference Series Vol. 260, p. 605
- (8) Hill G. M., Moffat A. F. J., St-Louis N., 2002, MNRAS 335, 1069
- (9) Koyama K., Kawada M., Takano S., 1990, PASJ, 42, L1
- (10) Koyama K., Maeda Y., Tsuru T., Nagase F., Skinner S., 1994, PASJ, 46, L93
- (11) Lambert D. L., Hinkle K. H., 1984, PASP, 96, 222
- (12) Lührs S., 1997, PASP 109, 504
- (13) Marchenko S. V., Moffat A. F. J., Ballereau D., Chauville J., Zorec J., Hill G. M., Annuk K., Corral L. J., Demers H., Eenens P. R. J., Panov K. P., Seggewiss W., Thomson J. R., Villar-Sbaffi A., 2003, ApJ, 596, 1295
- (14) Monnier J. D., Tuthill P. G., Danchi W. C., 2002, ApJ, 567, L137
- (15) Panov K. P., Altmann M., Seggewiss W., 2000, A&A, 355, 677
- (16) Panov K. P., Dinko D., 2002, IBVS 5177
- (17) Pollock A. M. T., Corcorna M. F., Stevens I. R., 2002, in: A. F. J. Moffat & N. St. Louis (eds) Interacting Winds from Massive Stars, ASP Conference Series Vol. 260, p. 537
- (18) Prinja R. K., Barlow M. J., Howarth I. D. 1990, ApJ, 361, 607
- (19) Repolust T., Puls, J., Herrero, A., 2004, A&A 415, 349
- (20) Setia Gunawan D. Y. A., van der Hucht K. A., Williams P. M., Henrichs H. F., Kaper L., Stickland D. L., Wamsteker W., 2001, A&A, 376, 460
- (21) Stevens I. R., Howarth, I. D. 1999, MNRAS, 302, 549
- (22) Stevens I. R., Blondin J. M., Pollock A. M. T., 1992, ApJ, 386, 265
- (23) Vreux J.-M., Andrillat Y., Biémont E., 1990, A&A, 238, 207
- (24) Walborn N. R., 1972, AJ, 77, 1972
- (25) Walder R., Folini, D., 2002, in: A. F. J. Moffat & N. St. Louis (eds) Interacting Winds from Massive Stars, ASP Conference Series Vol. 260, p. 595
- (26) Williams, P. M. 1995, in: K. A. van der Hucht & P. M. Williams (eds.), Wolf-Rayet Stars: Binaries, Colliding Winds, Evolution, Proc. IAU Symp. No. 163 (Dordrecht: Klewer), 335
- (27) Williams P. M., Eenens P. R. J., 1989, MNRAS, 240, 445
- (28) Williams P. M., van der Hucht K. A., van der Woerd H., Wamstecker W. M., Geballe T. R., Garmany C. D., Pollock, A. M. T. 1987, in: Instabilities in Luminous Early Type Stars, Lamers H. J. G. L. M., de Loore C. W. H. (eds.), Reidel, Dordrecht, p. 221
- (29) Williams, P. M., van der Hucht, K. A., Pollock, A. M. T., Florkowski, D. R., van der Woerd, H., Wamstecker, W. M. 1990, MNRAS, 243, 662 (W90)
- (30) Zhekov, S. A., Skinner, S. L. 2000, ApJ, 538, 808