Using the X-ray Emission Lines of Seyfert 2 AGN to Measure Abundance Ratios
Abstract
We measure the metal abundance ratios in the X-ray photoionized gas located near the narrow line region of a sample of Seyfert 2 AGN. The high-resolution X-ray spectra observed with the Chandra high- and low-energy transmission grating spectrometers are compared with models of the resonant scattering and recombination emission from a plasma in thermal balance, and with multiple temperature zones. The abundance ratios in the sample are close to the Solar values, with slight over-abundances of N in NGC 1068, and of Ne in NGC 4151. Our X-ray spectral models use fewer degrees of freedom than previous works.
Motivation. Our goal is to use X-ray abundance measurements to cross-calibrate with the optical spectra of quasars. These optical spectra are used to measure the star formation history of the early Universe.[1]
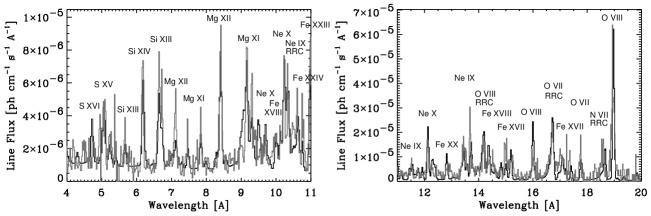
To Determine the Abundance Ratios, we fit the Seyfert 2 spectra with models of photoionized plasmas, and then search for deviations in the data from Solar abundances, as shown in Fig. 1. The fluxes of radiative recombination continuum (RRC) features and the radiative recombination (RR) forbidden lines depend little on radiation transfer effects, so they are the most reliable abundance indicators. At low continuum optical depths, the recombination emission flux scales linearly with abundances. Our model allows us to fit the RRC and RR fluxes by accounting for the broad ionization distribution in the plasma.
X-ray Emission Line Model. We model a photoionized plasma in ionization equilibrium and thermal balance with a grid of zones, each with ionization parameter (in c.g.s. units). The XSTAR plasma code yields the charge state distribution of each zone.[2] In order to calculate the recombination emission, we use the photoelectric cross sections from Ref. \refcitevernery, and the recombination rates calculated with the HULLAC atomic code,[4] provided by Ref. \refciteliedahl. To calculate the resonance line fluxes, we use the oscillator strengths from Ref. \refciteverner. We assume the ionizing spectrum of a radio-quiet quasar,[7] with an X-ray power-law and high-energy exponential cutoff. We assume a power-law distribution of column density as a function of , so , with a free parameter.[9] The advantages of this model are that 1) it provides a simple fit to the ionization distribution, 2) it has only five free parameters, instead of the several dozen parameters in other models,[8] and 3) it uses accurate atomic data.
Conclusion. The abundances in NGC 1068, NGC 4051, and NGC 4507 do not deviate much from the Solar values. Nitrogen is over-abundant by a factor of in NGC 1068, and neon is over-abundant in NGC 4051. There are no signatures of starburst activity. Further work is needed to quantify the systematic and statistical errors, and to compare with optical spectra.
References
- [1] Hamann, F. & Ferland, G. 1999, ARA&A, 37, 487
- [2] Kallman, T.R. & McCray, R. 1982, ApJ, 50, 263
- [3] Verner, D. A. & Yakovlev, D. G. 1995, A&AS, 109, 125.
- [4] Klapisch, M. et al. 1977, Opt. Soc. Am., 61, 148.
- [5] Liedahl, D. A. (private communication, 2001).
- [6] Verner, D. A., Verner, E. M., and Ferland, G. J. 1996 Atomic Data Nucl. Data Tables, 64, 1.
- [7] Elvis, M. et al. 1994, ApJS, 95, 1
- [8] Kinkhabwala, A. et al. 2002, ApJ, 575, 732
- [9] Jimenez-Garate, M. A. et al. 2002, ApJ, 578, 391