Extinction Effects in Spiral Galaxy Rotation Curves
Abstract
Observations show that the slope of the inner part of the H/[NII] rotation curves of disk galaxies is depressed by extinction: at fixed luminosity, the observed slope is in fact seen to depend on the disk inclination to the line of sight. Using a simple extinction model, we are able to reproduce well the observed trends. The model assumes an exponential distribution, both in the radial and directions, identical for star–forming regions and dust. Fits to the data are optimized by varying the scale height and scale length of absorbers, as well as the disk’s central optical depth , as seen face–on. The observations indicate that disk central opacity increases with total luminosity. Model fits for the most luminous galaxies (brighter than in the I band) yield , near m. The large uncertainty on the inferred value of is due to the poorly known characteristics of the distribution of absorbers in the disk, as well as to the likelihood of strong departures from an exponential radial distribution near the galaxy centers.
1 Introduction
Scattering and absorption by interstellar dust depresses the observed flux of galaxy disks at optical and infrared wavelengths. While the magnitude of the effect has been disputed, there is no doubt that the effect is strongly dependent on the inclination of a disk to the line of sight. A number of techniques have been used in observationally deriving extinction laws (see for example the volume edited by Davies and Burstein 1995, the review by Calzetti 2001 and Masters, Giovanelli & Haynes 2003 for details). Goad and Roberts (1981) first discussed a kinematical technique which we briefly describe as follows.
Let be the rotational velocity of an axially symmetric disk at the distance from its center and be a set of Cartesian coordinates in the plane of the disk. If the disk is thin and its symmetry axis is inclined by an angle to the line of sight, the observed component of velocity which intercepts the disk at is
| (1) |
where accounts for non–circular motions and the axis is oriented along the disk’s apparent major axis. The observed rotation curve, as derived for example from a long–slit H spectrum positioned along the major axis, will depart from the prescription given by Eqn. 1 as due to seeing, instrumental resolution, averaging across the slit width, the finite thickness of the disk and extinction occurring within the disk itself. As a realistically thick disk approaches the edge–on perspective, lines–of–sight along the major axis sample regions of increasingly broad range in , yielding a velocity distribution with a peak velocity contributed by parcels of gas asymmetrically distributed with respect to : if extinction is important, only foreground parts of the disk contribute to the emission and the factor depresses the velocity distribution observed at . Goad & Roberts noted how this tapering effect may, in opaque edge–on disks, yield observed rotation curves resembling solid–body behavior, independently of the true shape of . Bosma et al. (1992) tested this technique on two edge–on systems, NGC 100 and NGC 891. They compared HI synthesis and H observations and concluded that the disk of NGC 100 is transparent, while in the case of NGC 891 they could not exclude the possibility of extinction in the inner parts of the disk. Their conclusions were however strongly influenced by the limited spatial resolution of the HI data. Prada et al. (1994) compared long–slit spectra of NGC 2146 in the optical and near IR and reported evidence for extinction in the inner parts of the galaxy. More recently, Giovanelli & Haynes (2002, hereafter GH02) applied the same technique in a statistical fashion, detecting clear evidence for the effect of extinction at 0.66 m. Using a sample of more than 2000 H rotation curves, they found that the opacity in the inner disks of spiral galaxies is luminosity dependent, in a manner previously found by purely photometric means (Giovanelli et al. 1995; Tully et al. 1998). The observational data of GH02 are corroborated by the detailed radiative transfer calculations of Baes et al.(2004), which also obtain dramatic increases in the apparent inner scale length of rotations curves as disks approach the edge–on perspective.
In this report, we use a simple model for the dust gas distribution in spiral disks, in order to reproduce the findings of GH02 and in so doing to obtain quantitative inferences on the characteristics of the disk opacity. In Section 2 we summarize the observational results that are to be modelled. In Section 3 we describe the disk model to be fitted to the data, while the best fit parameters are discussed in Section 4. In Section 5 we present our conclusions. Throughout this work, distance dependent quantities are scaled according to a Hubble parameter km s-1 Mpc-1 .
2 Rotation Curve Shape and Disk Inclination
GH02 fitted H/[NII] rotation curves of spiral galaxies with the parametric model
| (2) |
where scales the amplitude of the rotation curve, yields a scale length for the inner steep rise, and corresponds to the slope at large . In their Table 1, for different luminosity classes as measured in the I–band they list mean values of , and of the ratio between and the scale length of the disk light for relatively face–on systems. In their Figure 1, for each luminosity class the dependence of on disk inclination is shown. For a given luminosity class, with increasing , remains at first constant; as approaches , starts increasing, the rate of increase being larger for more luminous systems. In the latter, at high inclination has values more than double the values observed at low inclination. The inclination dependence was interpreted as due to the increase in the opacity of spiral disks with inclination, while the luminosity dependence was attributed to a combination of increased disk size and higher interstellar medium metallicities in the more luminous systems. By contrast, the outer slope is unaffected by disk inclination.
3 Disk Extinction Model
As done by other authors who have studied disk extinction models (e.g (Byun et al. 1994; Xilouris et al. 1999; Misiriotis et al. 2000), we assume that the emissivity per unit volume is produced in the disk by a distribution of isotropic emitters which is exponential both in the radial direction in the plane of the disk, and in the direction perpendicular to it, so that
| (3) |
where and are respectively the scale length and the scale height, and we ignore the effects of clumpiness and azimuthal variations. We will need to distinguish between scale lengths and scale heights of stars, dust and H–emitting regions, respectively referred to by subscripts “*”, “d” and “”. We will assume that the dust distribution in the disk is exponential both in and , with scale length and scale height of the dust as those of the H light at m. That assumption greatly simplifies the analysis; it is justified since the light distribution in our case is that of the H produced in star forming regions, which is likely to mimick that of dust clouds. It is however a simplistic assumption, which cannot fully reproduce the more complex characteristics of the distribution of star–forming regions in galaxies. We use it here because of its simplicity, and discuss later some of its possible limitations. The absorption coefficient per unit volume for an exponential distribution can thus be written as
| (4) |
The optical depth at the disk center, when seen face–on, is then , while the optical depth as a function of the spatial coordinate along the line of sight is . For a randomly oriented disk, the optical depth to any parcel of emitting gas at location is fully specified once , , and are given. The disk’s intrinsic axial ratio for each component, , is related to the apparent ratio between minor and major radii and the inclination to the line of sight via
| (5) |
which is needed to relate the model to the observations, for GH02 show the inclination dependence of the rotation curve shape by plotting vs. . GH02 derived axial ratios from I–band surface photometry, a band for which the light originates in late disk stars; the of that light is very likely to be significantly larger than that of the dust and of the star–forming regions. In Giovanelli et al. (1994,1995) they derived a value of of 0.13 for the I–band. The largest data sets of H surface photometry are those of Ryder & Dopita (1994) and Koopmann, Kenney & Young (2001). Ryder and Dopita have compared stellar and H scale lengths, showing the latter to be significantly larger than the former; from their figures 4 and 5, we infer , where the stellar scale length corresponds to the I–band.
The contribution to the observed flux along a given line of sight by a parcel of gas at location is proportional to . The H line profile along a given line of sight through the disk will be , where is mapped onto the line of sight velocity, given a rotation curve . In analogy with the measurement practice by which the rotation curve of a disk is extracted from a slit positioned along the disk major axis, in our model we assign to each line of sight the velocity corresponding to the peak of the simulated H line profile.
We use the model as follows:
-
•
Given a disk galaxy luminosity class, we obtain an “unextincted” rotation curve of the type described by Eqn. 2, using the average values of the structural parameters as given in Table 1 of GH02.
-
•
We select a set of disk parameters , — the same as for the H light — and and build an “observed” rotation curve, that takes into account the effects of extinction as produced by the adopted disk model. We then measure in the thus modified rotation curve.
-
•
By progressively changing the inclination angle of the disk, we obtain a curve that describes the change of with , which we compare with the observed data as shown in Figure 1 of GH02. In order to show the dependence with in the observed data, we use the Eqn. 5.
-
•
The comparison between model and data is optimized via the minimization of
(6) where is the i point of the data to be fitted, and is its associated uncertainty. The procedure yields a best fit of unconstrained values for , and , or best fit values of any of those parameters, when the others are constrained. Since GH02 express the disk inclination in terms of the axial ratio of the starlight in the I–band, we use Eqn. (5) with to obtain .
4 Model Fitting Results
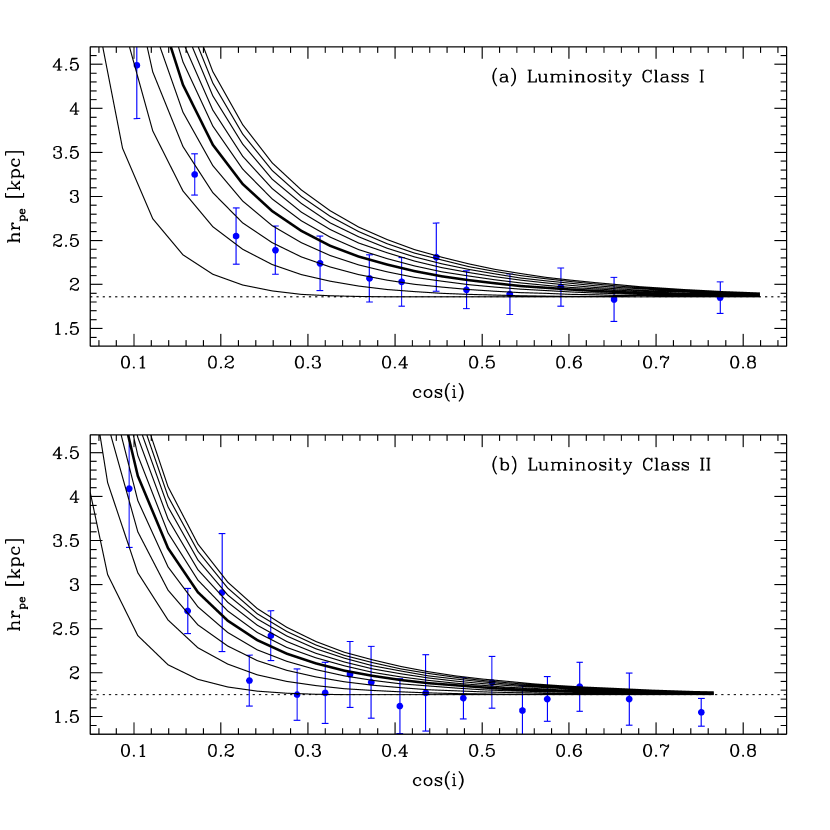
The GH02 analysis of rotation curves separates the available sample in six luminosity classes. The statistically more significant trend of with inclination takes place for the two brightest luminosity classes: Class I includes galaxies with and Class II includes galaxies with . The trends in with inclination are shown by the data points in Figure 3. The average stellar scale lengths in the I band are respectively kpc and kpc, for Classes I and II, as given by Haynes et al. 1999. Here, we restrict our analysis to those two classes. For the less luminous classes, extinction is small, the inclination dependence of is marginal or nonexistent and the value of that would be derived is unreliable.
Figures 1 and 2 show simulated rotation curves, as obtained using our disk extinction model, Eqn. 2 and the parameters listed in Table 1 of GH02, for the two luminosity classes of interest. In Figure 1, the “unextincted” rotation curve for Lumnosity Class I, normalized by a factor is shown as a thick line in each of the two panels. In panel (a), the effect of changing the disk inclination is shown, with thin lines exhibiting rotation curves for values of between and , , at a fixed value of , for kpc and , plotted versus the radial distance in units of the stellar scale length . In panel (b), for the same values of and , the effect of varying the central disk optical depth is shown, whereby for a fixed inclination of , the values for , are shown in the corresponding curve. Figure 2 displays the analogous model curves for Luminosity Class II, for which we have assumed kpc and . In all panels, the intersection of the horizontal dashed line and the rotation curve identifies the corresponding value of for that curve. Note how even for disks of moderate opacity, the value of the rotational velocity within a few scale lengths from the center can be drastically altered by extinction, in the case of highly inclined and luminous systems.
Figure 3 shows the GH02 data on the variation of with inclination, and the corresponding model trends as derived from our disk extinction model, for varying values of (1 to 10, ). In each case, and are the same values used in Figures 1 and 2. The models plotted with a thick line correspond to .
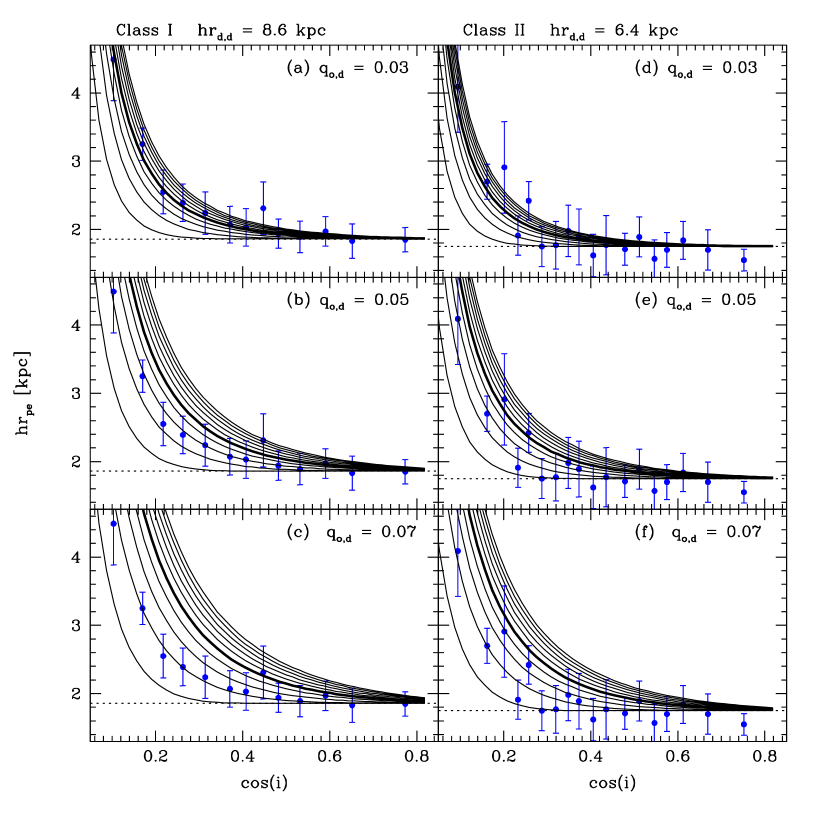
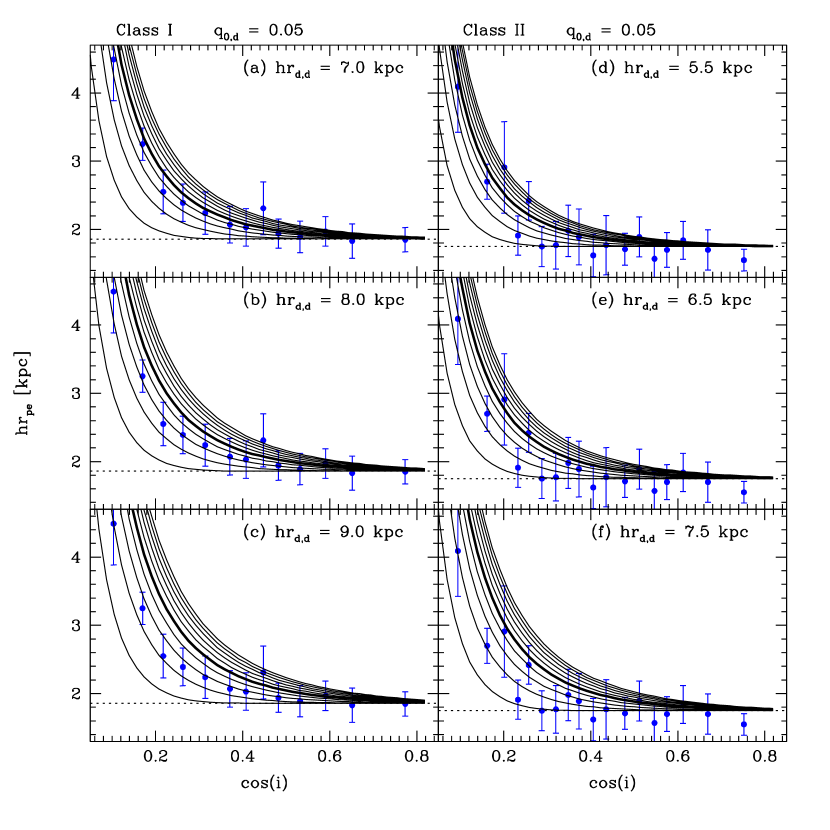
In order to verify the variance in the best fit value produced by different values of the assumed , Figure 4 shows the data for the two luminosity classes and, separately, simulated vs. relations for between 1 and 10 and for (panels a, d), 0.05 (panels b, e) and 0.07 (panels c, f). Similarly, Figure 5 shows the variance introduced by different assumptions on the dust disk scale length : for , the model curves were computed for kpc (panel a), 8.0 kpc (panel b), and 9.0 kpc (panel c) for Luminosity Class I, and 5.5 kpc (panel d), 6.5 kpc (panel e) and 7.5 kpc (panel f) for Luminosity Class II. For given , disk inclination and , a higher value of implies that extinction along a given path length involves a wider interval of disk radii, thus resulting in a more “smeared” rotation curve (i.e. longer ). Similarly, for given , disk inclination and , a longer dust scale length also implies that extinction along a given path length involves a wider interval of disk radii, thus a longer . Both effects are seen in the simulations.
Unconstrained fits of the type described by Equation (6) can yield simultaneously values for , and . However, values of and are not independent: lengthening the disk will obviously reduce its axial ratio. We can thus maintain and/or fixed and obtained constrained fit values for for each Luminosity Class. What is a reasonable range of values for and ?
While photometric measurements provide a fair assessment of the mean and variance in the value of for a given luminosity class (the scatter about the observed mean values is approximately 0.08 in ), the distribution in disk intrinsic axial ratios is quite uncertain, for is a difficult quantity to measure and even its mean value for a given type of galaxy relies on poorly constrained statistical inferences from the observed distribution of axial ratios and from a few observations of edge–on systems. The mean value of was adopted by Giovanelli et al. (1994) for the I band. The extreme disk population of star forming regions and dust should be significantly thinner than that of the solar–type disk stars contributing most of the light at I band. Ryder & Dopita (1994) give a comparison between and , which we assumed to be the same as . No equally accessible comparison between and is available. In Table 1, we give estimates of obtained assuming the tabulated values for and , based on the Ryder & Dopita (1994) data and heuristic assumptions on the dust layer intrinsic axial ratio. The error assigned to this determination is based on a combination of (a) the standard error propagation analysis derived from the impact of the GH02 data quality, (b) uncertainty in the conversion of to , estimated to be 20% on the basis of the Ryder & Dopita data, and (c) uncertainty in the value of , assumed to hover between 0.035 and 0.06 for both Luminosity Classes. The largest source of uncertainty is clearly that deriving from . An additional source of uncertainty is introduced by the often–seen departures from an exponential form, in the radial distribution of H especially near the centers of galaxies: a cursory inspection of the Ryder & Dopita and the Koopmann et al. samples indicates that about half of galaxies exhibit a cusp in the H distribution, within the inner 1–2 kpc. This region coincides with that within which is measured. Thus, values of inferred with the assumption that the radial distribution of H, and thus of dust, is exponential throughout the disk may underestimate the opacity of the inner regions of the disk and overestimate it in the outer regions. While it is clear that extinction plays a role in affecting the shape of the inner parts of H rotation curves of bright spirals, the technique outlined in this paper for its measurement requires higher quality estimates of the distribution of absorbers than currently available, for to be pinned down to better than within a factor of 2 or so.
| Lum Class | (kpc) | (kpc) | ||
|---|---|---|---|---|
| I | 4.3 | |||
| II | 3.2 |
5 Conclusions
A simple model, whereby dust and HII regions are distributed exponentially in both the radial and directions, with equal scale height and scale length, can reproduce the observed variation in the inner slope of H/[NII] rotation curves of disk galaxies. The effect is due to internal extinction. For reasonable values of the ratio between scale height and scale length, the model can constrain central disk opacities for the most luminous galaxies, in which the effect of extinction is the strongest. However, pinning down the exact value of central opticall depth of the disk at 0.66 m is difficult, due to uncertainty in the form of the distribution of absorbers. If H and the absorbers have scale length about 1.9 times that of the I band starlight and scale height to scale length ratio of , we infer central optical depth of disk, in the face–on perspective of , for galaxies brighter than in the I band. However, the uncertainty in the radial and –distributions of absorbers constrains the inferred values of to an uncertainty no better than a factor of 2. For less luminous spiral galaxies, extinction becomes progressively less important, and the model cannot usefully constrain the disk opacity.
References
- Bos (1992) Bosma, A, Byun, Y., Freeman, K.C. & Athanassoula, E. 1992, ApJ 400, L21
- (2) Baes, M., Davies, J.I., Dejonghe, H., Sabatini, S., Roberts, S., Evans, R., Linder, S.M., Smith, R. & de Blok, W.J.G. 2003, MNRAS, 343, 1081
- (3) Calzetti, D. 2001, PASP 113, 1449
- Byun, Freeman & Kylafis (1994) Byun, Y.Y., Freeman, K.C. & Kylafis, N.D., 1994, ApJ 432, 11.
- (5) Davies, J.I. & Burstein, D. 1995, editors: The Opacity of Spiral Disks, NATO ASI Series vol. 469, Kluwer:Dordrecht
- Giovanelli et al. (1994) Giovanelli, R. Haynes, M., Salzer, J., Wegner, G., Da Costa, L., & Freudling, W., 1994, AJ 107, 2036
- Giovanelli et al. (1995) Giovanelli, R. Haynes, M., Salzer, J., Wegner, G., Da Costa, L., & Freudling, W., 1995, AJ 110, 1059
- Giovanelli & Haynes (2002) Giovanelli, R. & Haynes, M. 2002, ApJ 571, L107 (GH02)
- Goa (1981) Goad, J. & Roberts, M.S. 1981, ApJ 250, 79
- (10) Haynes, M., Giovanelli, R., Salzer, J., Wegner, G., & Freudling, Da Costa, L., W., Herter, T., Vogt, N.P. 1999, AJ 117, 1668
- (11) Koopmann, R.A., Kenney, J.D.P. & Young, J. 2001, ApJS 135, 125
- (12) Masters, K.L., Giovanelli, R. & Haynes, M.P. 2003, AJ 126, 158
- Misiriotis et al. (2000) Misiriotis, A., Kylafis, N.D., Papamastorakis, J., & Xilouris, E.M., 2000, A&A 353, 117
- (14) Prada, F., Beckman, J.E., McKeith, C.D., Castles, J. & Greve, A. 1994, ApJ 423, 35
- (15) Ryder, S.D. & Dopita, M.A. 1994, ApJ 430, 142
- Tul (1988) Tully, R.B., Pierce, M.J., Huang, J.S., Saunders, W., Verheijen, M. & Witchalls, P. 1998, AJ 115, 2264
- Xilouris et al. (1999) Xilouris, E.M., Byun, Y.I., Kylafis, N.D., Paleologou, E.V. & Papamastorakis, J., 1999, A&A 344, 868