Molecular hydrogen as baryonic dark matter
Abstract
High-angular resolution CO observations of small-area molecular structures (SAMS) are presented. The feature-less structures seen in the single-dish measurements break up into several smaller clumps in the interferometer map. At an adopted distance of 100pc their sizes are of order a few hundred AU, some of which are still unresolved at an angular resolution of about . The clumps have a fractal structure with a fractal index between 1.7 and 2.0. Their kinetic temperature is between 7 K and 18 K. Adopting standard conversion factors masses are about 1/10 for individual clumps and densities are higher than 20000 cm-3. The clumps are highly overpressured and it is unknown what creates or maintains such structures.
Received: 02 Mar 2004 - Accepted: 19 Mar 2004
1 Introduction
Measurements of the 3K microwave background in connection with big-bang nucleosynthesis have impressively shown that most of the matter in the universe is in some unknown non-baryonic form and only 16% is baryonic in nature (Spergel et al., 2003), of which only a small part has been detected so far (Turner, 1999). According to gravitational lensing experiments less than 25% of the unseen baryonic matter in our Galaxy can be in form of massive compact halo objects (Afonso, 2003). An interesting alternative is molecular hydrogen (Pfenniger & Combes, 1994; Gerhard & Silk, 1996; Walker & Wardle, 1998), because at most temperatures in the interstellar medium it cannot be observed directly, but only through secondary tracers such as carbon monoxide, CO. Pfenniger & Combes (1994) have proposed that most of the dark matter in the outskirts of our Milky Way could be in form of cold molecular gas with a fractal structure. Basic building blocks in their model are so-called clumpuscules with sizes of about 100AU and Jupiter mass ( M☉).
Clumpuscules should form in the fragmentation process of an interstellar cloud initiated by efficient cooling. Thus they should exist throughout the Galaxy. In the outer region of the Galaxy they are hard to detect, because due to their low metallicity, thus low CO abundance, and low kinetic temperature they emit only very low intensities, only slightly above the 3K cosmological background. In the inner Galaxy conditions are more favourable to detect them in CO lines, but here it is impossible to isolate individual clumpuscules due to overcrowding in normal molecular gas. The best location to detect individual clumpuscules is at high galactic latitudes far away from known molecular clouds.
Good candidates for such structures are the small-area molecular structures (SAMS) which were recently detected in a region with very low extinction in the CO and lines (Heithausen, 2002). In the low-angular resolution data they appeared as unresolved clouds with full widths at half maximum below 1 arcmin. Adopting normal conditions one can show that such structures cannot survive very long in the interstellar radiation field. In this Letter I will present high-angular resolution observations of the SAMS, which show that they are composed of tiny molecular clumps, which with respect to their structural properties resemble the molecular clumpuscules proposed by Pfenniger & Combes (1994) as bayonic dark matter candidate, however are warmer and probably less massive.
2 Observations
To further resolve the SAMSs high angular resolution data of one of the structures described by Heithausen (2002) were obtained simultaneously in the CO and line using the IRAM Plateau de Bure interferometer near Grenoble in the French Alps. SAMS2 was observed between January and October 2003 with the 6 15m telescopes in the C and D configuration. The three-point mosaic covers an area of with an angular resolution of at 115 GHz and with an angular resolution of at 230 GHz. The final spectral resolution is 0.1 km s-1 at 115 GHz and 0.2 km s-1 at 230 GHz, respectively.
3 Results
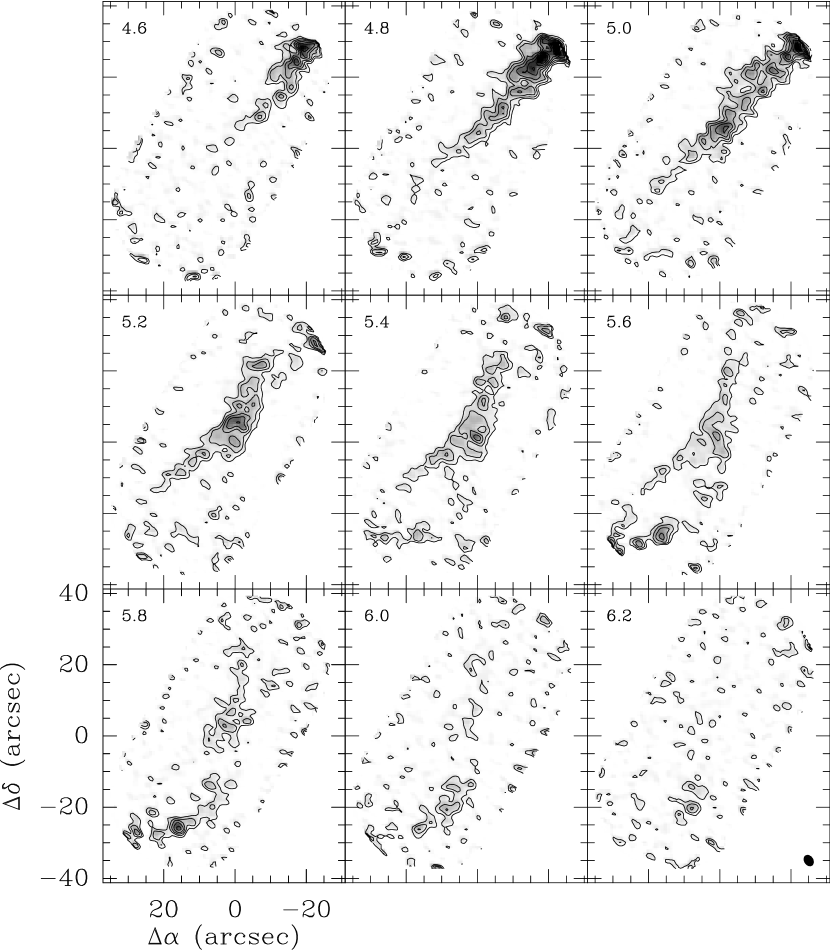
The resulting channel maps of SAMS2 in the CO () transition are displayed in Figure 1. The 2 featureless structures seen in the single-dish map split up in the interferometer map into a smaller filamentary structure composed out of even smaller clumps. Some of the clumps are unresolved even in the high-angular resolution map. In order to derive physical parameters for the most intense structures the data set was decomposed into gaussian shaped clumps using the GAUSSCLUMP algorithm developed by Stutzki & Güsten (1990). Table 1 lists the fitted values of the relative positions, and , radii, amplitudes, velocities and line widths. The radii listed are geometric means of the full-widths at half maximum of a 2-dimensional gaussia, fitted to the intensity distribution. They have been deconvolved for the interferometer resolution; Peak temperature and density have been corrected for this effect. Mass and average density are derived adopting a distance of 100pc and assuming a CO to H2 conversion factor of cm-2 (K km s, i.e. the galactic value (Hunter et al., 1997). Note that the uncertainties in these assumptions allow only an order of magnitude estimate.
The total mass of all structures in the map correspond to 1.8 , consistent with the value from the single dish data derived using the same assumptions. The fact that the total flux of the single dish observations is completely recovered with the interferometer implies that there is not much structures on larger scales because with the setup chosen the interferometer is only sensitive to structures below an angular resolution of or to linear structures of below 2600AU at the adopted distance. The most intense clumps listed in Table 1 account for 0.6 with individual masses of less than 1/10 The fractal index, , of the structure is thus
| (1) |
similar to that found for galactic molecular clouds (Falgarone et al., 1991); here and correspond to the different angular scales and and are the masses of identifiable objects at those scales. Note that because the fractal index depends only on the ratios of masses and sizes it is independent on actual distance and the way the mass is determined.
The line width of the individual structures is about 0.4 km s-1, a factor 2 lower than that seen in the lower angular resolution map. This difference results from a monotonous velocity gradient of 1 km s-1 over a distance of only 6000 AU. This enormous gradient is ten times higher than that observed for most other molecular clouds and their embedded cores (Goodman et al., 1993; Großmann & Heithausen, 1992). It implies that the structures are dynamic objects far from static equilibrium. This aspect was predicted for clumpuscules by Pfenniger & Combes (1994), because due to their inhomogeneous fractal structure clumpuscules should collide frequently which prevents them from collapsing to Jupiter like objects.
All the structures seen in the CO () transition are also detected in the CO () transition, however due to athmospheric conditions with a lower signal-to-noise ratio. The ratio of the integrated line intensities of the two transitions is . Under the assumption of optically thick lines the excitation temperature is K using the values from Table 1. It provides a good estimate for the kinetic temperature. The linewidth of the individual clumps (s. Tab. 1) is much larger than the thermal linewidth indicating the possibility of further substructure as also indicated in the maps (s. Fig. 1). The clumps are highly overpressured; with K cm-3 they exceed the average interstellar pressure (Jenkins et al., 2001) by at least 1 to 2 orders of magnitude. This raises the question how such structures can form or survive if not stabilized by their own gravity.
4 Discussion
In recent years molecular hydrogen has been detected in the diffuse interstellar medium directly via absorption-line measurements towards many distant quasars (Jenkins et al., 2003; Richter et al., 2003). Such observations, which trace mainly warm gas with low column densities, show that H2 is wide spread in the Galaxy even outside star-forming regions. They however provide only little information on the spatial structure of the clouds. The emission-line observations presented here for the first time disclose that molecular clouds in the diffuse interstellar medium are fractally structured. The building blocks of such clouds are low mass clumps or clumpuscules with sizes of order hundred AU. Due to the high uncertainty in mass and density it is impossible to judge whether these clumps are stabilized by their own gravity. The mass determination is based on conditions as for an average molecular cloud in the galactic plane, which may not hold at such small scales. Further excitation studies of the clumps are required to solve this issue.
It is interesting to note that the clumps have the same radial velocity as the surrounding atomic gas (Heithausen, 2002) and are within the range of velocities for the molecular gas in the Ursa Major cirrus clouds (De Vries et al., 1987) which are a few degrees away from the clumps. This means that tiny molecular clumps are possibly a natural constituent of the diffuse interstellar medium, however not recognized as such so far. They can form or survive even in regions with low column densities. From 12CO and 13CO observations of molecular gas in translucent clouds the existence of small scale structure down to a few hundred AU has been inferred (Falgarone et al., 1998); the observation presented here indicate that such structures are possibly intrinsically linked to the formation process of molecular clouds.
Whether or not fractally structured clouds similar to the ones described here could account for all the missing baryonic dark matter in our Galaxy is hard to determine. To be consistent with the ray background denser and more massive clumps than described in this Letter are predicted by models, which explain the missing baryonic mass with molecular clumpuscules (De Paolis et al., 1999; Kalberla et al., 1999). Due to their small sizes and their narrow line widths both, the hypothetic dark matter clumpuscules and the clumps described here, are notoriously hard to detect unless they form small clusters and thus fill at least some part of the beam of a larger telescope. With small telescopes used to survey the Galaxy they are undetectable due to the low beam filling; high angular resolution and high sensitivity observations are needed for detection. Such clouds thus provide an ideal means to hide matter from the observer.
References
- Afonso (2003) Afonso, C., Albert, J.N., Andersen, J., et al., 2003, A&A 400, 951.
- De Paolis et al. (1999) de Paolis, F., Ingrosso, G. Jetzer, P., Roncadelli, M., 1999, ApJ 510, L103.
- De Vries et al. (1987) de Vries, H.W., Heithausen, A., Thaddeus, P., 1987, ApJ 319, 723.
- Falgarone et al. (1991) Falgarone, E., Phillips, T.G., Walker, C.K., 1991, ApJ 378, 186.
- Falgarone et al. (1998) Falgarone, E., Panis, J.F., Heithausen, A., et al. 1998, A&A 331, 669.
- Gerhard & Silk (1996) Gerhard, O., Silk J., 1996, ApJ 472, 34.
- Goodman et al. (1993) Goodman, A.A. Benson, P.J., Fuller, G.A., Myers, P.C., 1993, ApJ 406, 528.
- Großmann & Heithausen (1992) Großmann, V., Heithausen A., 1992, A&A 264, 195.
- Heithausen (2002) Heithausen, A., 2002, A&A 393, L41.
- Hunter et al. (1997) Hunter, S.D., Bertsch, D.L., Catelli, J.R., et al., 1997, ApJ 481, 205.
- Jenkins et al. (2001) Jenkins, E.B., Tripp, T.M., 2001, ApJ Suppl. 137, 297.
- Jenkins et al. (2003) Jenkins, E.B., Bowen, D.V., Tripp, T.M., et al., 2003, AJ 125, 2824.
- Kalberla et al. (1999) Kalberla, P., Shchekinov, Y.A., Dettmar, R.-J., 1999, A&A 350, L9.
- Pfenniger & Combes (1994) Pfenniger, D. & Combes, F., 1994, A&A 285, 94.
- Richter et al. (2003) Richter, P., Wakker, B.P., Savage, B.D., Sembach, K.R., 2003, ApJ 586, 230.
- Spergel et al. (2003) Spergel, D.N., Verde, L., Peiris, H.V., et al., 2003, ApJ Suppl. 148, 175.
- Stutzki & Güsten (1990) Stutzki, J. & Güsten, R., 1990, ApJ 356, 513.
- Turner (1999) Turner, M.S., 1999, PASP 111, 264.
- Walker & Wardle (1998) Walker, M., Wardle, M., 1998, ApJ 498, L125.
Facilities: PdB.
| # | Radius | Mass | Density | |||||
|---|---|---|---|---|---|---|---|---|
| (′′) | (′′) | (AU) | (K) | (km s-1) | (km s-1) | () | (cm | |
| 1 | -22.2 | 28.4 | 290 | 10.5 | 4.8 | 0.46 | 0.073 | 66000 |
| 2 | -18.6 | 25.0 | 410 | 7.6 | 4.8 | 0.39 | 0.089 | 39000 |
| 3 | -12.8 | 21.3 | 630 | 4.0 | 4.8 | 0.42 | 0.118 | 17700 |
| 4 | -1.8 | 6.2 | 820 | 3.8 | 5.0 | 0.52 | 0.240 | 17400 |
| 5 | 0.0 | 1.2 | 410 | 4.1 | 5.4 | 0.36 | 0.045 | 19500 |
| 6 | 15.9 | -26.1 | 160 | 14.8 | 5.8 | 0.49 | 0.033 | 84000 |
Note. — Adopted distance 100pc; adopted cm-2 (K km s. Offsets are relative to , . The radius has been deconvolved from the instrumental resolution; temperature and density are corrected for this effect.