Discovery of a supernova associated with GRB 031203: SMARTS Optical-Infrared Lightcurves from 0.2 to 92 days
Abstract
Optical and infrared monitoring of the afterglow site of gamma-ray burst (GRB) 031203 has revealed a brightening source embedded in the host galaxy, which we attribute to the presence of a supernova (SN) related to the GRB (“SN 031203”). We present details of the discovery and evolution of SN 031203 from 0.2 to 92 days after the GRB, derived from SMARTS consortium photometry in I and J bands. A template type Ic lightcurve, constructed from SN 1998bw photometry, is consistent with the peak brightness of SN 031203 although the lightcurves are not identical. Differential astrometry reveals that the SN, and hence the GRB, occurred less than pc (3 ) from the apparent galaxy center. The peak of the supernova is brighter than the optical afterglow suggesting that this source is intermediate between a strong GRB and a supernova.
1 Introduction
Since the discovery of GRB afterglows, the evidence for a physical connection between gamma-ray bursts (GRBs) and core-collapse supernovae (SNe) has mounted (see reviews by van Paradijs, 1999; Mészáros, 2001). Particularly compelling were observations of lightcurves and broadband photometry of SN-like features embedded in GRB afterglow light (see Bloom, 2003). Recently, spectroscopic evidence (Stanek et al., 2003; Hjorth et al., 2003; Kawabata et al., 2003) confirmed that GRBs are produced in the death of massive stars (Woosley, 1993). To date, SN signatures have been reliably found in only a few GRBs (see Bloom 2003) necessitating the search for and the study of new GRB-related SNe.
GRB 031203 triggered the IBIS instrument onboard the Integral satellite on 3 December 2003 at 22:01:28 UT (Gotz et al., 2003), leading to quick discoveries of X-ray (Campana et al., 2003) and radio afterglows (Frail, 2003; Soderberg, Kulkarni, & Frail, 2003). Spectroscopy of the host galaxy coincident with the radio transient yielded a redshift of (Prochaska et al., 2004), likely the redshift of the burst itself. The low redshift (second only to the unusual GRB 980425) of GRB 031203 presents a rare opportunity to create a well-sampled SN lightcurve using modest aperture telescopes. We began our observations of the field 5 hours after trigger and continued monitoring periodically for several months. We reported our discovery of an increase in brightness of the aperture magnitude of the host, and suggested the emergence of a supernova was responsible (Bailyn et al., 2003). Hereafter, since the explosion date of the SN is likely that of the GRB, we designate the SN associated with GRB 031203 as “SN 031203”. Monitoring of the SN by other groups has now confirmed the presence of SN 031203 both photometrically (Bersier et al., 2004) and spectroscopically (Tagliaferri et al., 2004).
In this paper we present optical and infrared data obtained with the SMARTS 1.3m telescope and ANDICAM instrument between 0.2 and 92 days after the detection of GRB 031203. Observations and data reduction are reported in section 2. Section 3 describes the aperture photometry and image subtraction carried out on this data. The resultant evidence of a SN associated with GRB 031203 is presented. A comparison between this SN and SN 1998bw is made in section 4.
2 Observations and Data Reduction
Observations commenced at 4 December 2003 3h00m UT, approximately 5 hours after the Integral detection of the long-duration (20 sec) GRB 031203 (Gotz et al., 2003) and follow-up imaging continued for the next 3 months. Data were obtained using the ANDICAM instrument mounted on the 1.3m telescope at Cerro Tololo Inter-American Observatory (CTIO).111http://www.astronomy.ohio-state.edu/ANDICAM This telescope is operated as part of the Small and Moderate Aperture Research Telescope System (SMARTS) consortium.222http://www.astro.yale.edu/smarts The ANDICAM detector consists of a dual-channel camera that allows for simultaneous optical and IR imaging. The Fairchild 447 2048 2048 optical CCD has a 63 63 field of view, while the Rockwell 1024 1024 HgCdTe “Hawaii” IR Array has a 24 24 field of view. Both optical and IR images are double-binned in software to give an optical pixel scale of 0.27 arcsec/pixel and an IR pixel scale of 0.37 arcsec/pixel. While standard optical integrations are underway, the ANDICAM instrument allows IR images to be “dithered” by the slight adjustment of three tilt axes of an internal mirror.
As GRB 031203 was at low Galactic latitude and thus subject to high extinction, only I-band data were obtained in the optical. J-band data were obtained simultaneously. A combination of 7 telescope re-points and 5 internal dithers were used to obtain 7 separate 360-second I-band images and 35 separate 60-second J-band images per data set. Standard reduction was performed on the I-band images, including overscan bias subtraction, zero subtraction and flat fielding. The 7 I-band images were then aligned and averaged to produce a single master I-band frame.
IR flats were taken at two different sky brightnesses. Flats with a “bright” sky level were median combined to produce a bright flat frame, and flats with a “dim” sky level were median combined to produce a dim flat frame. The master flat field was produced by subtracting the dim flat frame from the bright flat frame. Each J-band image was divided by the normalized master flat field. Five sky frames were then produced, one for each dither position. Each sky frame was formed by median combining sets of 7 images taken at a given dither position. Median combining produced star-free sky frames since each of the 7 images at that dither position were taken at a slightly different telescope position. Corresponding sky frames were subtracted from each image with rescaling to compensate for changes in brightness. Finally, all 35 sky-subtracted images were aligned and averaged to produce a single master J-band frame.
3 Data Analysis
The discovery of SN 031203 (Bailyn et al., 2003) was made noting a differential brightening in the aperture magnitude about the apparent host from day 0.2 to day 8.3. We have analyzed the full dataset using both aperture photometry and image-subtraction photometry and find that both methods give consistent results for the SN lightcurve.
3.1 Aperture Photometry
Seeing-matched aperture photometry of the host galaxy of GRB 031203 (Prochaska et al., 2004) was performed. The seeing was matched to a FWHM of . The relative magnitude of the host was determined by comparison with 12 on-chip, non-variable, “standard” objects. The aperture radius used was 19 in I and 26 in J and was chosen to enclose all light from the galaxy significantly above the sky background level. Relative magnitudes were converted to apparent magnitudes by comparison, on photometric nights, with the 8 Landolt standard stars in the field of Rubin 149 (Landolt 1992) for the I-band images, and with the Persson IR standard stars T832-38078, LHS2397a, P9106, and P9150 (Persson et al., 1998) for the J-band images.
The resultant lightcurves are shown in Figure 1. Both lightcurves clearly reveal the rise and then decay of a supernova, with a peak between 26 and 34 days. The apparent magnitude of the host galaxy without the SN component is in I and in J. At peak, the SN increased the total brightness of the galaxy by mag in I and mag in J. Thus the combined light reddens as it approaches maximum brightness. While GRB afterglow is described by an achromatic power-law decay, color-evolution has been associated with the emergence of a SN component from the afterglow of GRBs, including GRB 030329 (Bloom et al., 2004).
The uncertainty in these measurements is determined from the statistical fluctuation in the measured magnitudes of a non-variable object with a brightness similar to that of the host galaxy. The relative error is 0.03 magnitudes in I and 0.06 magnitudes in J. A number of larger errors (0.09 mag) in J are due to technical problems that resulted in master J frames produced from fewer than 35 individual J images. Telescope movement glitches and a malfunction in the IR array also rendered several IR data sets unusable and hence only 23 data points are determined in J while 31 data points are determined in I. An additional uncertainty of 0.07 magnitudes in I and J exists in the transformation of relative to apparent magnitudes.
3.2 Image Subtraction Photometry
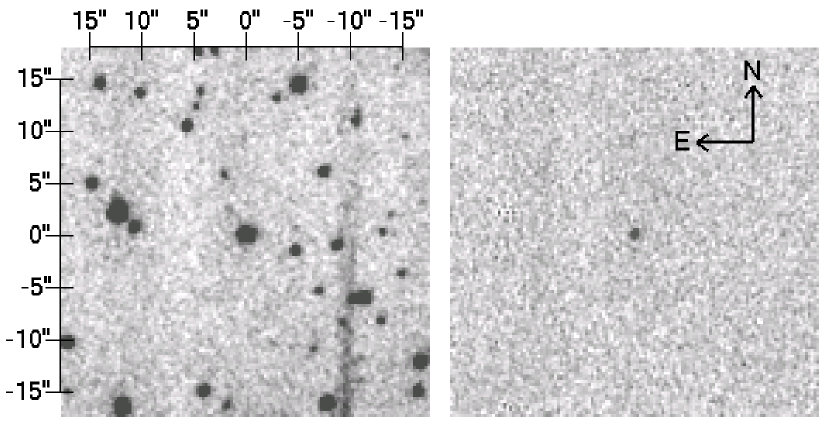
Spatially variable kernel-convolved image subtraction was carried out on the I-band images using ISIS (Alard 2000). The reference frame that was used for subtraction was formed from the 5 I-band images taken more than 50 days after the GRB, when the SN had faded. The residual light from the SN near peak brightness is clearly evident in the subtracted images. Figure 2 is a “before and after” example of a typical result of this image subtraction.
The centroid of the light from the supernova after subtraction of the galaxy is arcseconds west and arcseconds south of the center of the host galaxy. The position of the SN is, therefore, consistent with the center of the host galaxy. At the distance of the host galaxy, one arcsecond is kpc in projection, with ( km s-1 Mpc-1). Thus the SN (and by extension the GRB) occurred within 300 pc (3 ) of the apparent host center. Only GRB 970508 occurred closer to the host center (Bloom, Kulkarni, & Djorgovski, 2002).
4 Comparison with SN 1998bw
As the SN associated with GRB 031203 is reminiscent of SN 1998bw, a comparison of their lightcurves is in order. SN 1998bw was observed at a lower redshift and without significant background contribution from its host galaxy. The Galactic extinction-corrected lightcurve of SN 1998bw (Galama et al., 1998) must, therefore, be shifted from to and must also be added to the light of the host galaxy of GRB 031203.
Transforming the lightcurve of SN 1998bw requires a k-correction, stretching, and dimming due both to the change in luminosity distance and to extinction. Wavelengths emitted between the R and I-bands at are redshifted into the observed I band. The lightcurve of SN 1998bw at a wavelength between the R and I-bands is simply determined by averaging its R and I-band magnitudes. This simple k-correction is justifiable as the brightness of SN 1998bw was almost identical in these two bands, so it can be assumed that the SN’s SED was fairly flat in this wavelength region.
Given the small change in redshift, the wavelength stretching due to redshift only dims SN 1998bw by 0.1 mag. The largest dimming is due to the change in luminosity distance (). Assuming a cosmology of , and , then Mpc and Mpc. The increase in luminosity distance results in 5.6 magnitudes of dimming. SN 1998bw is additionally dimmed by 1.4 mag due to the line of sight Galactic extinction toward the host galaxy of GRB 031203. This value is determined from the Galactic reddening of toward the host galaxy (Prochaska et al., 2004) and assuming the Galactic extinction curves of Cardelli, Clayton, & Mathis (1989). This calculation assumes that both SN have undergone a similar amount of host galaxy extinction, and, therefore, no attempt is made to correct for such extinction. The last step is to add the light of the host galaxy, assuming the host galaxy has an I magnitude of 19.21.
Despite the uncertainties inherent to the above procedure, once SN 1998bw is shifted into the host galaxy of GRB 031203 only an additional 0.02 magnitudes has to be added to its lightcurve for its peak to match that of SN 031203. Figure 3 shows this lightcurve as a solid line overlaid on the lightcurve of SN 031203. Clearly SN 1998bw peaks earlier than SN 031203. However, stretching the lightcurve of SN 1998bw makes the decline much too long compared to our data. The dotted line in Figure 3, for example, shows a stretch of 1.7, chosen to make the highest points coincide. The problems with the decline are clear; indeed, no combination of stretch and offset of the SN lightcurve fits the data. This difficulty was not apparent in the data of Thomsen et al. (2004) who had somewhat sparser sampling.
Given the inconsistencies of the template Ic and the ANDICAM data, we cannot exclude the possibility that the brightening source was due to another type of supernova (although Tagliaferri et al. (2004) report spectroscopic evidence of a Ic origin). However, local Ic SNe show a variety of rise and fall timescales as well as a large range in brightness distributions (e.g. Mazzali et al., 2002) so the differences may simply be inherent in the GRB-related SNe. To be sure, one of the more puzzling emergent trends in GRB-related SNe is why the peak brightnesses of the SNe should be so similar ( mag) (Zeh, Klose, & Hartmann, 2004; Bloom et al., 2004), yet the lightcurves differ substantially. Since the peak brightness scales roughly as the mass of the synthesized 56Ni (whereas the timescale depends on the mass of the ejecta and the explosion energy — Nomoto et al., 2003), this trend may point to a regularizing mechanism for 56Ni synthesis in SN-GRBs perhaps related to the apparent regularization of energy release in the prompt burst phase (Frail et al., 2001).
We note that there is scant evidence for the existence of the afterglow itself. The peak luminosity of the SN is, therefore, greater than that of the afterglow just a few hours after the GRB. This is in stark contrast to GRB 030329 in which the afterglow after 5 hours was over 5 magnitudes brighter than the peak of the supernova (Lipkin et al., 2003). It is interesting to note that the fluence of the GRB itself (corrected for luminosity distance) was over 3 orders of magnitude larger in the case of GRB 030329 than GRB 031203 (Ricker, 2003; Hurley et al., 2003). This may suggest that there is a large population or perhaps a continuum of events intermediate between GRBs and SNe. If so, Swift may reveal a population of faint GRBs whose late-time optical lightcurves are dominated by a supernova, as is the case reported here.
References
- Alard (2000) Alard, C. 2000, A&AS, 144, 363
- Bailyn et al. (2003) Bailyn, C., van Dokkum, P., Buxton, M., Cobb, B., & Bloom, J. S. 2003, GRB Circular Network, 2486
- Bersier et al. (2004) Bersier, D., et al. 2004, GRB Circular Network, 2544
- Bloom (2003) Bloom, J. S. 2003, (astro-ph/0303478)
- Bloom et al. (2004) Bloom, J. S., van Dokkum, P. G., Bailyn, C. D., Buxton, M. M., Kulkarni, S. R., & Schmidt, B. P. 2004, AJ, 127, 252
- Bloom, Kulkarni, & Djorgovski (2002) Bloom, J. S., Kulkarni, S. R., & Djorgovski, S. G. 2002, AJ, 123, 1111
- Campana et al. (2003) Campana, S., Tagliaferri, G., Chincarini, G., Covino, S., Fugazza, D., & Stella, L. 2003, GRB Circular Network, 2478
- Cardelli, Clayton, & Mathis (1989) Cardelli, J. A., Clayton, G. C., & Mathis, J. S. 1989, ApJ, 345, 245
- Frail et al. (2001) Frail, D. A., et al. 2001, ApJ, 562, L55
- Frail (2003) Frail, D. A. 2003, GRB Circular Network, 2473
- Galama et al. (1998) Galama, T. J., et al. 1998, Nature, 395, 670
- Gotz et al. (2003) Gotz, D., Mereghetti, S., Beck, M., Borkowski, J., & Mowlavi, N. 2003, GRB Circular Network, 2459
- Hjorth et al. (2003) Hjorth, J., et al. 2003, Nature, 423, 847
- Hurley et al. (2003) Hurley, K., et al. 2003, GRB Circular Network, 2480
- Landolt (1992) Landolt, A. U. 1992, AJ, 104, 340
- Lipkin et al. (2003) Lipkin, Y. M., et al. 2003, (astro-ph/0312594)
- Kawabata et al. (2003) Kawabata, K. S., et al. 2003, ApJ, 593, L19
- Mazzali et al. (2002) Mazzali, P. A., et al. 2002, ApJ, 572, L61
- Mészáros (2001) Mészáros, P. 2001, Science, 291, 79
- Nomoto et al. (2003) Nomoto, K., Maeda, K., Mazzali P. A., Umeda, H., Deng, J., Iwamoto, K. 2003, (astro-ph/0308136)
- Persson et al. (1998) Persson, S. E., Murphy, D. C., Krzeminski, W., Roth, M., & Rieke, M. J. 1998, AJ, 116, 2475
- Prochaska et al. (2004) Prochaska, J. X., et al. 2004, (astro-ph/0402085)
- Ricker (2003) Ricker, G. R. 2003, IAU Circ., 8101
- Soderberg, Kulkarni, & Frail (2003) Soderberg, A. M., Kulkarni, S. R., & Frail, D. A. 2003, GRB Circular Network, 2483
- Stanek et al. (2003) Stanek, K. Z., et al. 2003, ApJ, 591, L17
- Tagliaferri et al. (2004) Tagliaferri, G., et al. 2004, GRB Circular Network, 2545
- Thomsen et al. (2004) Thomsen, B., et al. 2004, (astro-ph/0403451 )
- van Paradijs (1999) van Paradijs, J. 1999, Science, 286, 693
- Vietri & Stella (1998) Vietri, M. & Stella, L. 1998, ApJ, 507, L45
- Waston (2004) Waston, D., et al. 2004, ApJ submitted
- Woosley (1993) Woosley, S. E. 1993, ApJ, 405, 273
- Zeh, Klose, & Hartmann (2004) Zeh, A., Klose, S., Hartmann, D. H. 2004, (astro-ph/0311610)