1]IASF-CNR, Sezione di Bologna, Via Gobetti 101, 40129 Bologna (Italy) 2]Center for Astrophysics and Space Sciences, University of California at San Diego, La Jolla, CA 92093, USA 3]CEA Saclay, DSM/DAPNIA/SAp (CNRS FRE 2591), 91191, Gif–sur–Yvette Cedex, France 4]INTEGRAL Science Data Centre, Chemin d’Ecogia 16, 1290 Versoix, Switzerland 5]Université de Paris VII, Fédération APC, 2 place Jussieu, 75251 Paris Cedex 05, France 6]Harvard–Smithsonian Center for Astrophysics, 60 Garden Street, Cambridge, MA 02138, USA
HIGH ENERGY EMISSION FROM IGR J16320-4751
Abstract
IGR J was re–discovered by IBIS/ISGRI on board INTEGRAL in early February 2003 during the observation of the black hole candidate 4U (PI Tomsick). This source, already observed by ASCA and BeppoSAX, belongs to the class of heavily absorbed objects ( cm-2) that populate some arms of the Galaxy. Soon after the rediscovery by IBIS/ISGRI, the source was observed by XMM-Newton: the arcsec position found with XMM allowed ones to find the most likely infrared counterpart. We present here the reanalysis of the high energy emission from IGR J detected by IBIS/ISGRI, including the spectral and temporal characteristics. We also present a reanalysis of the XMM-Newton and optical/IR data.
keywords:
X–rays: binaries; X–rays: individuals: IGR J16320-47511 Introduction
IGR J was serendipitously discovered on February 1.4, 2003 UT, with the IBIS/ISGRI detector (Ubertini et al. 2003, Lebrun et al. 2003) on board the INTEGRAL satellite during the AO1 observation of the black hole candidate 4U (PI Tomsick). The coordinates (J2000) were and , with an uncertainty of (Tomsick et al. 2003a). A quick archival research allowed ones to find immediately the X–ray counterpart in the ASCA catalog, as the source AX J (Sugizaki et al. 2001). IGR J is therefore apparently located in the Norma Arm of the Galaxy, an active star forming region distant from the Sun about kpc (Georgelin & Georgelin 1976, Russeil 2003).
A Target of Opportunity request (ToO) with XMM-Newton was immediately activated and it found one single source inside the error circle of ISGRI. The coordinates (J2000) were and with an uncertainty of (Rodriguez et al. 2003a). In this reduced error circle it was possible to identify two reliable infrared counterparts in the 2MASS catalog (Tomsick et al. 2003b).
A preliminary analysis of the XMM-Newton observation, together with the identification of the infrared counterpart was presented in Rodriguez et al. (2003b). Here we present a reanalysis of the INTEGRAL AO1 observation, together with a reanalysis of the XMM-Newton ToO data.
2 data analysis
INTEGRAL observed the Norma region from 1 February 2003 to 5 February 2003 UT for an elapsed time of ks and with the dither pattern . The screening, reduction, and analysis of the IBIS/ISGRI data have been performed by using the INTEGRAL Offline Scientific Analysis (OSA) v. 3 (Goldwurm et al. 2003a), available to the public through the INTEGRAL Science Data Centre111http://isdc.unige.ch/index.cgi?Soft+download (ISDC).
2.1 Imaging
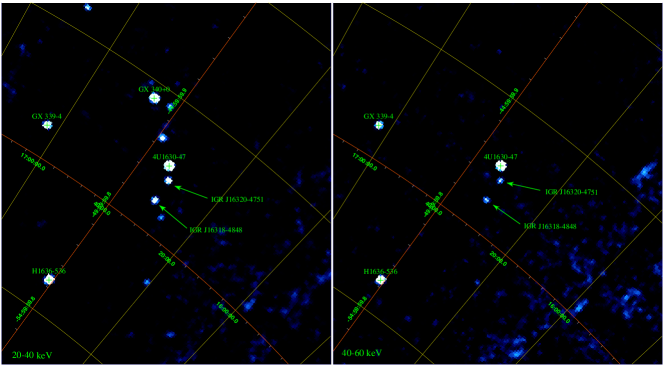
An initial analysis was performed by deconvolving the ISGRI shadowgrams to obtain images. IGR J was detected in the imaging pipeline in the energy bands keV (signal–to–noise ratio ) and keV (). The mosaic images are shown in Fig. 1. Given the present uncertainties in the validation of the software for the off–axis sources, it was adopted the same procedure described by Goldoni et al. (2003). We divided the count rate of IGR J by the count rate of the Crab in a similar off–axis angle, extracted from the calibration observations. We added a of systematic error, to take into account the residual fluctuations in the count rate (cf Goldwurm et al. 2003b). The calculated flux is erg cm-2 s-1 and erg cm-2 s-1, in the energy bands keV and keV respectively. No significant detection was recorded at higher energy.

2.2 Timing
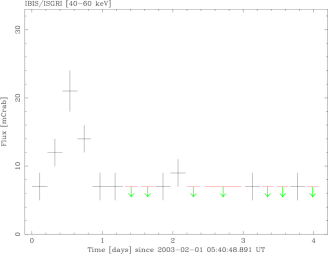
IGR J was detected in most of the individual ScWs with . Therefore, to study the variability of the source it was decided to rebin the lightcurve so that each time bin contains 8 ScW, corresponding approximately to ks. The obtained lightcurve shows a clear outburst at the time of the discovery, plus some other periods with a certain variability (Fig. 2). During the outburst, the flux in the band keV raised from about mCrab to mCrab (Fig. 2, left). The time scale of the variations occurs on s or even more. A similar behaviour is clearly seen in the keV energy band (Fig. 2, right).
Since in a coded–mask instrument the brightest sources in the field of view (FOV) can – under certain conditions – significantly affect the detection of the other nearby sources, we investigated also the time variability of the three brightest sources in the FOV, namely 4U, 4U, and GX. All the analysed sources display different variability patterns and therefore we conclude that the variability of IGR J is genuine.
2.3 Spectral extraction
To extract the spectrum of the whole observation and also during the outburst we used both the spectral extraction pipeline and the results from the image analysis, to perform a check of the results. This is necessary to take into account that IGR J is located in a crowded region, with at least two nearby sources (4U and IGR J), and therefore the different approach in the deconvolution of images and extraction of spectra (see Goldwurm et al. 2003a for a full explanation of the algorithms) could generate results not always consistent each others.
For the spectral extraction pipeline we rebinned the latest RMF matrix from the original channels to channels, by putting all the channels above keV into the last channel of the rebinned matrix. The remaining channels in the range keV were grouped in bin of about keV in size. This approach has been selected to emphasize the energy range keV and to have enough statistics to perform the test in the spectral fit with xspec (v 11.3). Nonetheless, the source is faint and does not allow a fit with multiple component models. We decided to fit with a simple power law model to measure if there is hardening/softening during the outburst.
The spectrum of the whole observation has , with a flux of about erg cm-2 s-1 in the energy band keV, consistent with the results from the imaging analysis. Also in the spectral extraction pipeline no flux is detected for energies greater than keV.
The spectrum extracted during of the outburst (bins 2-4 in Fig. 2) has the photon index varying from to , therefore slightly harder than that of the whole observation, with a peak flux of erg cm-2 s-1 in the keV energy band.
During the “normal” activity, investigated only with the imaging pipeline, IGR J is barely detected in the energy band keV (Fig. 2, right), with the exception of the outburst.
The hardness ratio (not shown), calculated by using the fluxes in the two energy bands ( keV and keV), is in agreement with the results of the spectral extraction pipeline, and confirms the softness of the source during almost the whole observation.
3 data analysis

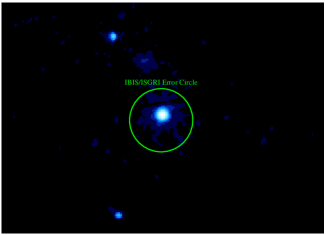
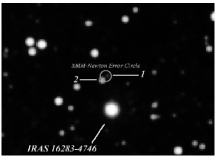
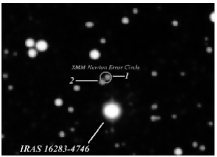
XMM-Newton observed IGR J as a Target of Opportunity (ToO) from 4 March 2003 UT to 5 March 2003 UT, with an elapsed time of about ks. Due to soft-proton flares, the effective exposure was about ks, but sufficient to clearly identify (uncertainty ) the X–ray counterpart at coordinates (J2000) and (Rodriguez et al., 2003a,b; see Fig. 3). An early analysis of the XMM-Newton data (ToO) were published in Rodriguez et al. (2003b). The lightcurve in the ks clean from soft–proton flares showed a time variability on time scales of s, while the spectrum was found to be harder than that of ISGRI, fitted with an absorbed power law with photon index and cm-2 (, d.o.f.). The unabsorbed flux in the keV energy band was erg cm-2 s-1. We refer the reader to the paper by Rodriguez et al. (2003b) for more details.
For the present work, we decided to reanalyze the XMM-Newton data to extract the better spectrum. We used still the XMM SAS v. 5.4.1 software to process and screening the data and the same procedures described in Rodriguez et al. (2003b). We adopted a different procedure only to extract the spectrum. Since the source is bright enough to be clearly visible still in the flared image, we avoided the selection of a time region not affected by soft-proton flares, and we extracted directly from the contaminated image the source plus background counts from a circular region centered on IGR J with radius of . Therefore, we extracted the background from another circular region with radius , and close to the source. We performed the background (now including the soft–proton flares) subtraction directly in xspec.
We succeeded to save ks from the elapsed time of ks, with a loss of only ks (to be compared with the loss of ks of the early analysis). We found that the best fit model is still an absorbed power law with and cm-2 (, d.o.f.), consistent with the results of the early analysis (see Fig. 4). The unabsorbed flux in the keV energy band is erg cm-2 s-1.
We note that there are some interesting features between and keV, and particularly some hints for emission lines of the iron complex, between and keV. The addition of a thermal plasma model (mekal model in xspec) with a temperature keV is able to reproduce some of these features, and particularly the emission lines of the iron complex. However, this model is statistically required only at confidence level. A simple gaussian emission line at keV and width keV is required at %. Further observations are required to better constrain the nature of this excess.
| Source 1 | |
|---|---|
| Catalog | Magnitude |
| 2MASSa | |
| 2MASSa | |
| 2MASSa | |
| Source 2 | |
| USNO B1b | n.a. |
| USNO B1b | |
| USNO A2b | |
| GSC 2.2c | |
| USNO CCD ACd | |
| USNO B1b | |
| USNO B1b | |
| USNO A2b | |
| GSC 2.2c | |
| USNO B1b | |
| DENISe | |
| 2MASSa | |
| DENISe | |
| 2MASSa | |
| 2MASSa | |
| DENISe |
-
a
Two Microns All Sky Survey (2MASS) Point Source catalog, Cutri et al. (2003).
-
b
US Naval Observatory Catalog A2, Monet et al. (1998). US Naval Observatory Catalog B1, Monet et al. (2003). For the latter, B and R magnitudes are taken from two types of plates and referenced with subscripts 1 and 2: (1) Palomar Observatory Sky Survey (POSS) I, (), with emulsion sensible at the wavelengths nm; (2) POSS II (), sensible at nm.
-
c
Guide Star Catalog 2.2.
-
d
US Naval Observatory CCD Astrograph Catalog (UCAC, http://ad.usno.navy.mil/ucac/). UCAC magnitude is in the wavelenght band nm, between V and R bands.
-
e
DEep Near Infrared Survey (DENIS) of the southern sky (DENIS Consortium 2003, http://cdsweb.u-strasbg.fr/denis.html).
4 Optical/Infrared Counterparts
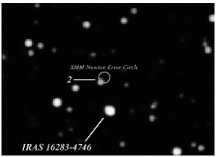
With the improved position given by XMM-Newton, it became possible to look for the counterparts at other wavelengths, specifically in the optical/infrared bands (Tomsick et al. 2003b). Two sources have been found in the Two Microns All–Sky Survey (2MASS): the first, labelled 1 in Fig. 5, could also be the most probable counterpart. The infrared colours along the line of sight (, , for the extinction due to the Galactic absorption ) suggesting an excess perhaps due to the presence of hot plasma or circumstellar dust, consistent with the findings of the X–ray analysis. Specifically, the source 1 is not detected in the band, with an upper limit of . Concerning the source 2, there are detections in other catalogs: a summary of the optical/infrared detections is shown in Table 1. It is worth noting that the source 2 is classified as a non-star object, that may be either galaxies or blended objects, in the Guide Star Catalog 2.2222http://www-gsss.stsci.edu/gsc/GSChome.htm. Indeed, it appears slightly elongated with an eccentricity of and a semimajor axis of pixels.
5 Discussion and Conclusions
In the present work we confirmed and extended the results obtained by Rodriguez et al. (2003b). The nature of IGR J is not clear yet and, even though the most probable hypothesis is a Galactic X–ray binary, the possibility of an extragalactic object cannot be completely ruled out. The source appears to be intrinsically absorbed, with an one order of magnitude greater than the Galactic absorption along the line of sight. Also the infrared observation suggests an excess due to circumstellar plasma or dust along the line of sight. The X–ray spectrum could support the hot plasma solution, but the confidence level is not enough (only ) and should be confirmed with further observations with much more statistics. Therefore, the picture of a high–mass X–ray binary (HMXRB) with a compact object accreting through winds appears to be very likely for IGR J. The winds could also be the source of obscuration, wrapping up the compact object.
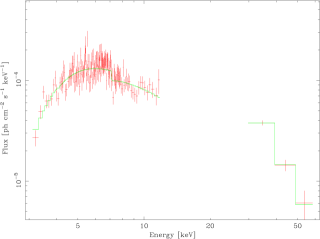
The nature of the accreting object is not clear as well: the strong differences in the photon index in the energy bands keV and keV could be due to changes in spectral states, thus suggesting a black hole. On the other hand, the drop of emission for energies greater than keV is common in neutron stars. Although, the INTEGRAL and XMM-Newton are not simultaneous, we tried a simultaneous fit (Fig. 6). The best fit model (, ) is an absorbed power law with exponential cutoff (cutoffpl model in xspec), typical of accreting neutron stars (see, e.g. White et al. 1983). The photon index is , the column density cm-2, and the cutoff energy keV. The scaling constant applied to the ISGRI spectrum is . We stress that the observations were not simultaneous and the source is strongly variable. Therefore, this fit should be taken with extreme care.
Another possibility, given the low luminosity in both bands ( erg/s in the keV energy band, and erg/s in the keV band) if the source is located in the Norma Arm ( kpc), is that we are observing the emission from a jet. In this case, we could make the hypothesis that the change in the photon index could be due to a break, because of a change in the mechanism of cooling of electrons.
The key question in the study of this source is therefore the spectral variability. An approved coordinated INTEGRAL and XMM-Newton observation to be performed by next August should give us sufficient data to disentangle these hypotheses.
Acknowledgments
Based on observations obtained with INTEGRAL, an ESA mission with instruments and science data centre funded by ESA Member States (especially the PI countries: Denmark, France, Germany, Italy, Switzerland, Spain), Czech Republic and Poland, and with the participation of Russia and the USA. Based on observations obtained with XMM-Newton, an ESA science mission with instruments and contributions directly funded by ESA Member States and the USA (NASA). This research has made use of data obtained from the High Energy Astrophysics Science Archive Research Center (HEASARC), provided by NASA’s Goddard Space Flight Center, and of data products from the Two Micron All Sky Survey, which is a joint project of the University of Massachusetts and the Infrared Processing and Analysis Center/California Institute of Technology, funded by the National Aeronautics and Space Administration and the National Science Foundation.
LF acknowledges the Italian Space Agency (ASI) for financial support.
References
- [] Cameron L.M., 1990, A&A 233, 16
- [] Cutri R.M., Skrutskie M.F., van Dyk S., et al., 2003, 2MASS All–Sky Catalog of Point Sources. University of Massachusetts and Infrared Processing and Analysis Center, (IPAC/California Institute of Technology)
- [] Georgelin Y.M., Georgelin Y.P., 1976, A&A 49, 57
- [] Goldoni, P., Bonnet–Bidaud, J.M., Falanga, M., & Goldwurm, A., 2003, A&A 411, L399
- [] Goldwurm A., David P., Foschini L., et al., 2003a, A&A 411, L223
- [] Goldwurm, A., Gros, A., Goldoni, P., et al., 2003b, IBIS/ISGRI Instrument Specific Software Scientific Validation Report, v. 1.0
- [] Lebrun F., Leray J.-P., Lavocat P., et al., 2003, A&A 411, L141
- [] Monet D.G., Bird A., Canzian B., et al., 1998, U.S. Naval Observatory Flagstaff Station (USNOFS) and Universities Space Research Association (USRA) stationed at USNOFS.
- [] Monet D.G., Levine S.E., Casian B., et al., 2003, AJ 125, 984
- [] Rodriguez J., Tomsick J.A., Foschini L., et al., 2003a, IAUC 8096
- [] Rodriguez J., Tomsick J.A., Foschini L., et al., 2003b, A&A 407, L41
- [] Russeil D., 2003, A&A 397, 133
- [] Sugizaki et al., 2001, ApJS 134, 77
- [] Tomsick J.A., Lingenfelter R., Walter R., et al., 2003a, IAUC 8076
- [] Tomsick J.A., Rodriguez J., Goldwurm A., et al., 2003b, IAUC 8096
- [] Ubertini P., Lebrun F., Di Cocco G., et al., 2003, A&A 411, L131
- [] White N.E., Swank J.H., Holt S.S., 1983, ApJ 270, 711