Optical Imaging and Spectroscopy of the Edge-On Sbc Galaxy UGC 10043: Evidence for a Galactic Wind and a Peculiar Triaxial Bulge
Abstract
We present new optical imaging and spectroscopy of the peculiar, edge-on Sbc galaxy UGC 10043. Using the WIYN telescope, we have obtained , , and H+[N ii] images, together with DensePak integral field spectroscopic measurements of the stellar Ca ii infrared triplet and the H and [N ii] lines from the ionized gas. The imaging observations show that the inner bulge of UGC 10043 () is elongated perpendicular to the galaxy major axis. At larger , the bulge isophotes twist to become oblate and nearly circular, suggesting the bulge is triaxial. The bulge shows no clear evidence for rotation about either its major or minor axis. The inner, southwestern quadrant of the bulge is girdled by a narrow dust lane parallel to the minor axis; unsharp masking reveals that this minor axis dust lane may be part of an inner polar ring, although we find no unambiguous kinematic evidence of orthogonally rotating material. The stellar disk of UGC 10043 has a rather low optical surface brightness [23.2 mag arcsec-2], a small scale height ( pc for Mpc), and a mild integral sign warp. A dusty, inner disk component that appears tilted relative to the outlying disk is also seen. The H and [N ii] emission lines in UGC 10043 resolve into multiple velocity components, indicating the presence of a large-scale galactic wind with an outflow velocity of 104 km s-1. H+[N ii] imaging reaffirms this picture by revealing ionized gas extended to 3.5 kpc in the form of a roughly biconical structure. The [N ii]/H line intensity ratio increases with increasing distance from the plane, reaching values as high as 1.7. Unlike most galaxies with large-scale winds, UGC 10043 has only a modest global star formation rate ( yr-1), implying the wind is powered by a rather feeble central starburst. We discuss evolutionary scenarios that could account for both the structural complexities of UGC 10043 and its large-scale wind. The most plausible scenarios require a major accretion or merger event at least a few Gyr ago.
1 Background
UGC 10043 is a nearby galaxy (33.4 Mpc; see Table 1) that has been classified as an Sbc spiral seen almost directly edge-on (e.g., de Grijs & van der Kruit 1996). However, recent high-resolution Hubble Space Telescope () images obtained through and filters (mid-ultraviolet and -equivalent bands) by Windhorst et al. (2002) highlighted some morphological peculiarities of this object, including an extremely thin disk that appears very dim in the mid-ultraviolet, a bulge with prolate isophotes, and a narrow dust lane running parallel to the minor axis.
Vertical elongation is not a common feature of spiral bulges (e.g., Bertola, Vietri, & Zeilinger 1991). Indeed, most bulges are significantly flattened by rotation, and many appear “disky”, with scale heights only slightly larger than their host disks (e.g., Kormendy 1993). A notable exception is the case of certain early-type spirals where “orthogonally decoupled bulges” have been recently discovered (Bertola et al. 1999; Sarzi et al. 2000; Corsini et al. 2003; see also Arnaboldi et al. 1993; Reshetnikov, Faúndez-Abans, & de Oliveira-Abans 2002). Another class of galaxies displaying vertically elongated inner components are the polar ring galaxies (e.g., Whitmore et al. 1990), although in this latter case, the “prolate bulge” is actually an S0 or similar galaxy, whose rotation is orthogonal to an orbiting ring or disk of stars and gas (see the review by Sparke 2002).
A common trait of both the orthogonally decoupled bulge systems and the polar ring galaxies is that both classes of objects contain a structural component whose angular momentum vector is roughly parallel to the major axis of the host galaxy. This in turn suggests these systems could not have formed from the collapse of a single protogalactic cloud, but instead have undergone a “second event” after a precursor of the system was significantly evolved (e.g., Schweizer, Whitmore, & Rubin 1983; Bertola et al. 1999; Bournaud & Combes 2003). Another group of objects belonging to the class of “multi-spin galaxies” are the minor-axis dust lane ellipticals. These are observed to have modest rings of gas and dust orbiting about their short axis (e.g., Hawarden et al. 1981; Bertola 1987; Oosterloo et al. 2002). The peculiar minor axis dust lane of UGC 10043 causes its bulge to bear an interesting resemblance to these latter systems, while its elongated bulge and massive stellar disk suggest a more extreme version of these systems, and a possible link to the polar ring or orthogonally-decoupled bulge galaxies.
Polar rings, orthogonally decoupled bulges, and minor axis dust lanes are all relatively rare, but these systems are nonetheless of considerable interest from a galaxy evolution perspective. For example, the ability to measure the kinematics of a galaxy along two orthogonal axes permits unique constraints on the shape of the potential and of the dark matter halo (e.g., Tohline, Simonson, & Caldwell 1982; Sackett & Sparke 1990; Sparke 1996; Reshetnikov & Sotnikova 1997). Multi-spin galaxies serve as important evidence that there is no single recipe for the formation of a disk+spheroid system, and demonstrate that such galaxies are likely to be built and modified by a variety of processes—all of which need to be accounted for in a complete picture of galaxy formation. In addition, we now have significant observational evidence that “second events” have played a key role in the evolution of nearly all massive galaxies (e.g., Freeman & Bland-Hawthorn 2002 and references therein). However, because the conditions required to form a stable, multi-spin galaxy from an accretion or merger event are rather restricted, these systems provide particularly important laboratories for exploring how initial conditions and the properties of the participating galaxies influence the outcome of these episodes. Studies of multi-spin galaxies may therefore provide important clues on the roles accretion and minor mergers played in shaping a much wider array of observed galaxy types (e.g., Bettoni & Galletta 1991).
The morphological similarities between UGC 10043 and certain multi-spin galaxies strongly suggest a relationship to these objects, and imply that UGC 10043 has had a rather different formation history from “prototypical” Sbc galaxies such as the Milky Way or NGC 891. To investigate this possibility further, we have obtained new optical imaging and spectroscopic observations of UGC 10043. This paper describes the analysis of these data, and uses them as a first step toward building a picture of the evolutionary history of this galaxy.
2 Imaging Observations and Photometric Calibration
Some basic properties of UGC 10043 are summarized in Table 1. The imaging observations of Windhorst et al. (2002) comprised only very short exposures covering a small field-of-view (). Therefore we have used the Mini-Mosaic Camera (Mini-Mo) on the WIYN111The WIYN Observatory is a joint facility of the University of Wisconsin-Madison, Indiana University, Yale University, and the National Optical Astronomy Observatory. telescope at Kitt Peak to obtain new imaging and photometry of UGC 10043 in order to permit a more detailed morphological and photometric study.
The Mini-Mo images were obtained on 2001 April 16 through Harris and filters, and a narrow-band (72Å) filter (W016), centered at 6620Å and transmitting the redshifted H+[N ii] emission. Exposure times were 750 seconds in , 1000 seconds in , and 1200+800 seconds in H.
Mini-Mo consists of two thinned SITe 40962048 CCDs separated by a small () gap. The plate scale is /pixel and the field-of-view is . Each of the CCDs is read out by two amplifiers whose mean gain and readout noise are 1.4 ADU-1 and 5.5, respectively.
Reduction of the images was performed in IRAF222IRAF is distributed by the National Optical Astronomy Observatories, which is operated by the Associated Universities for Research in Astronomy, Inc., under cooperative agreement with the National Science Foundation. utilizing tasks within the ‘mscred’ package. Flatfielding was accomplished using a median of several dome flats obtained in the appropriate filter. In all filters, small gain variations led to flatfield gradients of order 2% across the two quadrants of the CCD containing UGC 10043. These gradients were reduced to 1% by means of two-dimensional, second order Legendre polynomial fits to the image.
The Mini-Mo and observations were acquired under dark, photometric conditions with seeing of for the image and for the image. For the and observations, photometric calibration and conversion to a standard system was performed by observing sets of standard stars from Landolt (1992) at three different airmasses (1.1, 1.2, and 1.5). The photometric solution is summarized in Table 2.
Photometry of UGC 10043 was performed through elliptical apertures after removing cosmic rays, foreground stars, and bad CCD columns. The results are presented in Table 1. The photometric errors were computed following Matthews & Gallagher (1997) and also include the scatter in the photometric solution. The apparent magnitudes were corrected for Galactic foreground extinction following Schlegel, Finkbeiner, & Davis (1998). The resulting apparent magnitudes in Table 1 agree to within errors with those published in the Third Reference Catalogue of Bright Galaxies (; de Vaucouleurs et al. 1991) and by Pohlen (2001; ).
Seeing during the narrow-band (H+[N ii]) observations was . The two narrow-band exposures were averaged, and cosmic rays were removed by hand in the vicinity of UGC 10043. Continuum subtraction was performed using the -band image, after convolving it with a Gaussian to match the seeing of the narrow-band images. An H luminosity for UGC 10043 was estimated using the -band calibration and the Harris and W016 filter transmission curves. [N ii]/H=0.43 was assumed (see Section 5.3), yielding erg s20% (uncorrected for internal extinction or underlying stellar absorption).
3 Imaging Results: Optical Properties and Morphology of UGC 10043
The WIYN -band image of UGC 10043 is presented in Figures 1a & 2, while Figure 1b shows a + composite image. These images highlight with improved signal-to-noise several of the features visible in the images of Windhorst et al. (2002), and also showcase several new features.
3.1 The Disk of UGC 10043
While its size and mass are typical for Sbc spirals (Table 1), a number of characteristics differentiate UGC 10043 from most Sbc spiral galaxies viewed edge-on. First, the disk component of UGC 10043 is strikingly thin for a galaxy of this Hubble type. To estimate the disk scale height, we extracted light profiles from the -band image in 15-pixel-wide strips perpendicular to the major axis at locations =45′′ southeast and northwest of the galaxy center. These locations were chosen to minimize contamination from dust clumps and bright H ii regions. Fitting exponential functions to these light profiles over the interval , we derive an estimate of the global disk scale height of (395 pc), with the values found for the two extracted strips differing by only 3%. After correction to the same distance scale, this value is in good agreement with the -band determination of de Grijs & van der Kruit (1996; 41210 pc) but slightly smaller than the value determined in the -band by Pohlen (2001; 453 pc). Such a global disk scale height is roughly a factor of two smaller than typical global values measured for the disks of Sb-Sbc spirals (e.g., Wainscoat et al. 1989; de Grijs 1998; Pohlen et al. 2000), but is comparable to the old thin disk scale height of the Milky Way (Chen et al. 2001; Siegel et al. 2002) and of many Sd spirals (e.g., de Grijs 1998).
Appropriate corrections for internal extinction in UGC 10043 are rather uncertain. The UGC 10043 disk is clearly dusty, although outside the inner 30′′, the dust appears to be highly clumped, and does not form a continuous dust lane; hence the amount of dust may vary considerably with radius (see also Section 3.3.1). Furthermore, a significant fraction of the galaxy light comes from the bulge component (see below) where the dust content may be significantly different. Using the prescription of Tully et al. (1998), whereby the internal extinction of a galaxy is estimated based on its rotational velocity, we derive total internal extinctions of =1.47 and =1.02 mags, assuming =70 km s-1 Mpc-1, km s-1 (see Table 1 and Section 6), and =7.5 (the -band disk axial ratio at the observed 25 mag arcsec-2 isophote). From this we estimate for UGC 10043 total absolute magnitudes of and , and a -band luminosity .
It has been found for galaxies of a given dynamical mass that the thinnest disks tend to be of the lowest surface brightness (e.g., Gerritsen & de Blok 1999; Bizyaev & Mitronova 2002). Consistent with this, the thin disk of UGC 10043 is of rather modest brightness in the and bands despite its edge-on geometry (Figure 3). This cannot be attributed solely to dust extinction, as the disk also appears very faint in the -band (see Figures 3.16 & 4.16 of Windhorst et al. 2002). By extrapolating the disk light profile to small , we estimate a central disk surface brightness 21.2 mag arcsec-2, consistent with the estimate of Pohlen (2001). Deprojected to face-on (assuming ), and corrected for internal extinction (assuming a simple foreground screen), this corresponds to 23.2 mag arcsec-2. This value is characteristic of very late-type, low surface brightness spirals, but is 1.5-3.0 magnitudes fainter than values typical for “normal” Sb-Sc galaxies (e.g., de Jong 1996a; Tully & Verheijen 1997).
Finally, we draw attention to one additional feature of the UGC 10043 disk: the slight “integral sign” warp of its outer disk (Figure 2). While stellar warps are rather common in late-type disks, they become increasingly rare in galaxies with significant bulge components (Pitesky 1991; Reshetnikov & Combes 1998).
3.2 The Bulge of UGC 10043: Evidence of Triaxiality, Geometric Decoupling, and a Possible Inner Polar Ring
Even a casual inspection of UGC 10043 quickly reveals that its disk is not its only intriguing feature; its bright bulge is also unusual in that its inner isophotes appear distinctly prolate (Figure 1a & b), while the outer isophotes are nearly circular (Figure 2). The high surface brightness of the bulge compared with the adjacent disk regions, together with its unflattened shape and comparatively large vertical extent, lend the impression of a structurally distinct entity, as opposed to a dynamically hotter extension of the disk. Furthermore, on the southwest side of the midplane, a distinct dust structure is visible perpendicular to the disk, and bisecting the bulge along the direction of the apparent minor axis. As noted in the Introduction, this dust structure is reminiscent of those seen in minor axis dust lane elliptical galaxies with orthogonally rotating gas (e.g., Bertola 1987), and thus hints at the presence of material with misaligned angular momentum (although this has yet to be confirmed kinematically; see Section 5).
3.2.1 Non-Parametric Bulge Decomposition
In order to better quantify the shape of the UGC 10043 bulge and estimate its total luminosity, we performed a non-parametric decomposition of the -band image by fitting a series of ellipses to the bulge region. Semi-major axes of the ellipses ranged from =1′′-20′′. The regions along the midplane most affected by dust were masked during the fitting ( for ; - for , plus a -wide swath along the minor-axis dust lane). The position angle, ellipticity, and center of each ellipse were allowed to vary freely, except for , where the center was kept fixed. For the fits are rather uncertain owing to significant contamination from dust and disk light.
Using a two-dimensional model generated from the ellipse fits, we estimate the total magnitude of the bulge component of UGC 10043 to be (assuming dust extinction within the bulge itself is negligible). After correcting the residual disk light for internal extinction, this yields a bulge-to-disk ratio B/D0.3.
Further details from the bulge fitting are summarized in Figure 4. The fits indicate that within the inner 15′′ (), the UGC 10043 bulge isophotes have a prolate shape, with ellipticity decreasing with increasing , from for to =0.11 at = (Figure 4). Beyond , the next fitted isophote underwent an abrupt position angle shift of 98∘; the position angles of the successive outlying isophotes then became closely aligned with the disk position angle of , and were oblate and roughly circular (=0.02-0.24, with increasing systematically with ). These isophote shifts suggest the bulge of UGC 10043 is inherently triaxial (see Mihalas & Binney 1981; Bertola, Vietri, & Zeilinger 1991).
In the lower panel of Figure 4, we plot as a function of ellipse semi-major axis, the dimensionless parameter , where A4 is a Fourier coefficient that characterizes the deviation of the fitted ellipses from a true elliptical shape (see Bender, Döbereiner, & Möllenhoff 1988). Following the convention of Bender et al. (1988), negative values indicate “boxy” (rectangular-shaped) isophotes, while positive values indicate “disky” (leaf-shaped) isophotes. The A4 values inside are poorly constrained and have been omitted from the figure. In UGC 10043, a transition from boxy to disky isophotes mirrors the decrease in ellipticity observed over the interval . The maximum value occurs just beyond this, near . Beyond , the isophotes show a roughly constant value of 0.1%. Note that while disky bulge isophotes elongated along the major axis are quite common (e.g., Kormendy 1993), disky isophotes elongated perpendicular to the major axis are not (e.g., Bertola et al. 1991), and suggest the possible existence of an embedded structure. However, the diskiness of the isophotes suggests that any embedded structure could not be a bar seen with its long axis along the line-of-sight, since such a feature would be expected to instead appear boxy and flattened (Combes et al. 1990; Merrifield 1996). If the UGC 10043 bulge harbors a bar, it would therefore need to be oriented perpendicular to our line-of-sight, and be tumbling about its long axis—a situation that seems dynamically improbable.
3.2.2 Unsharp Masking
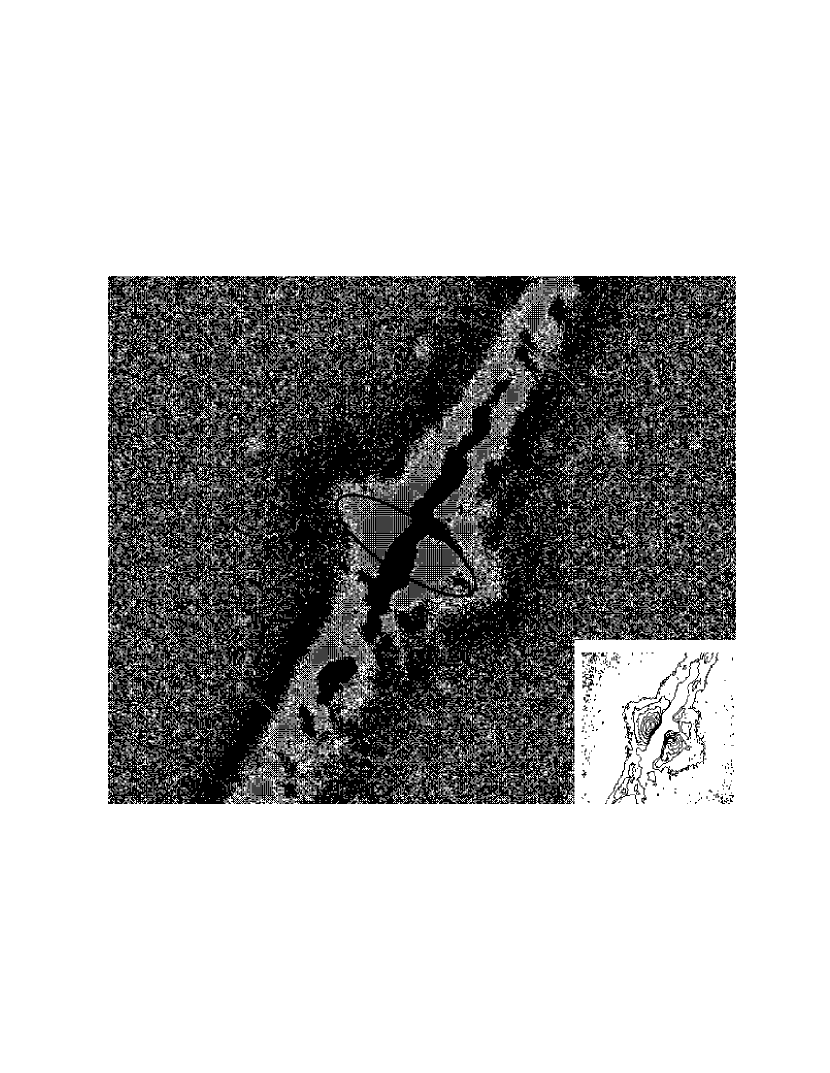
Subtraction of the bulge model derived in Section 3.2.1 from the original image revealed hints of additional complex structure. Therefore, to further probe the underlying structure of the bulge, we employed the technique of unsharp masking (see Erwin & Sparke 2003 and references therein). One type of unsharp mask can be produced simply by subtracting a smoothed version of an image from the original. In our case, we subtracted from the -band frame a version of the image that had been smoothed using a Gaussian with =10 pixels. A portion of the resulting mask is shown in Figure 5.
Figure 5 unveils a rather intriguing structure: a possible ring or annulus of material oriented roughly orthogonally to the main disk. An unsharp mask made from the -band image appears nearly identical. As seen in Figure 5, the apparent ring forms a continuation of the minor axis dust lane prevalent in the continuum images (Figure 1a). In order to estimate the size and orientation of this ring-like structure, we have fitted it by eye using an ellipse. The geometry of our fitted ellipse suggests an approximate inclination of (assuming the structure is intrinsically circular and has an intrinsic thickness of one-tenth its diameter), and a position angle of (a misalignment of 8∘ from a perfectly polar orientation). The diameter of this ellipse (2.5 kpc) implies the ring would lie comfortably inside the bulge of UGC 10043. The apparent ansae of the ring correspond to the locations where the fitted bulge isophotes abruptly change position angle and ellipticity, and show their maximum “diskiness” along the minor axis direction (see Figure 4). If real, this ring-like structure may be related to the so-called “inner polar rings” now identified in several nearby galaxies (Reshetnikov, Hagen-Thorn, & Yakovleva 1995; Eckart & Downes 2001; Karataeva et al. 2001; Sil’chenko 2002; Corsini et al. 2003). We estimate the apparent ring structure to have a surface brightness roughly 13 times lower than the adjacent bulge light. To estimate its luminosity, we summed the flux along the southeastern arc, where bulge and disk contamination are minimized. Extrapolating this value around the full ring diameter yields , or .
The dusty arc that appears to form part of the inner ring structure in UGC 10043 would necessitate that the ring contain dusty, optically thick material, and suggest its origin might be due to the accretion of metal-enriched material from a companion or infalling dwarf. However, a problem for the inner polar ring scenario is the absence of an obvious continuation of the minor axis dust arc to the northeastern portion of the galaxy, as would be expected from a continuous, orbiting ring. One possible explanation is that the ring is inhomogeneous, with the dustiest material confined to discrete clumps. Ultimately the inner ring hypothesis will require kinematic confirmation. As we describe in Sections 5.1.1 & 5.2, the spectra we have obtained so far do not have sufficient spatial resolution and signal-to-noise for this purpose.
Lastly, we draw attention to the inset shown in Figure 5, as it highlights yet another interesting and unusual feature of the UGC 10043 bulge—namely its appearance of being “inserted” into the disk rather than forming a smooth, continuous extension of the disk light. This contrast is strengthened by a comparison with images or contour plots of other edge-on spirals with prominent bulges (e.g., de Grijs & van der Kruit 1996; Howk & Savage 1999; Pohlen et al. 2000). As discussed below, this distinction may offer another important clue to the formation history of UGC 10043 (Section 7).
3.3 Neighbors to UGC 10043
Several additional galaxies of significant angular size are visible within the field-of-view of the Mini-Mosaic images of UGC 10043. One of the most interesting of these is a very faint, uncatalogued dwarf at a position , (roughly =+84′′, ), with =22.1 and =21.2 (see Figure 2). This extremely diffuse and low surface brightness object ( mag arcsec-2) has the relatively smooth and featureless morphology typical of dwarf spheroidal (dSph) galaxies. It does not appear to be a detached fragment from the outer disk of UGC 10043 itself, as it is located in the anti-direction of the disk’s warp, and has a somewhat redder observed color () compared with the outer disk regions (0.7-0.8; see Section 3.3.1). No H emission was detected from this object in our narrow-band imaging observations (Section 3.4), so we have no quantitative constraint on its redshift. However, little or no ionized gas is expected in a dSph system, and its color and mean surface brightness are consistent with typical objects of this class (e.g., Jerjen, Binggeli, & Freeman 2000); assuming this galaxy lies at the same distance as UGC 10043, its linear diameter (1.1 kpc) and absolute magnitude () are also as expected for a dSph. As dSphs are typically satellites to larger galaxies, this object is a strong candidate for a physical companion to UGC 10043.
Four other galaxies with sizes 30′′ were also visible in the WIYN frames. One of these is MCG +04-37-035, at a projected distance of from UGC 10043. For it we measure and magnitudes of =16.21 and =15.36, respectively (uncorrected for internal extinction). MCG +04-37-035 is also clearly detected in our continuum-subtracted H+[N ii] image (Section 3.4), implying that it has a recessional velocity in the range 970-4250 km s-1 (the wavelength range transmitted by the narrow-band filter), and thus could also be physically associated with UGC 10043. This galaxy has a rather low surface brightness with a few small, brighter star-forming knots superposed. Its disk structure is somewhat irregular, but with hints of rudimentary spiral arms.
A third galaxy in the field was catalogued by the 2MASS survey333http://www.ipac.caltech.edu/2mass, as 2MASX J15485842+2151508. It lies at a projected distance of from UGC 10043. MCG +04-37-038, seen from UGC 10043, is catalogued as a galaxy triplet; however, this designation is puzzling, as the WIYN image clearly shows only a single galaxy encompassing the positions of all three of the supposed members of the grouping. Lastly, we find a previously uncatalogued galaxy at a position , . This latter object, as well as 2MASX J15485842+2151508, and MCG +04-37-038, all have similar angular sizes (), and no clear evidence of line emission detected in the H+[N ii] image. This suggests all three are background objects and may be part of a single galaxy group.
3.3.1 Color Map
A color map of UGC 10043 is presented in Figure 1c. This map reveals several features that provide further clues to the evolutionary history of the galaxy.
As seen in the images shown in Figure 1a & b, UGC 10043 forms a stark contrast to many other dusty, edge-on disks with prominent bulges (i.e., Hubble types Sb-Sbc; e.g., IC 2531: Wainscoat, Freeman, & Hyland 1989; NGC 891, NGC 3628: Howk & Savage 1999). For example, UGC 10043 does not exhibit a well-defined dust lane along its full radial extent, but only at small projected radii. This is reaffirmed in the color map, where we see no color signature of a dust lane outside the inner 30′′ of the galaxy (compare the color maps of edge-on Sb-Sbc spirals presented by Wainscoat et al. 1989; de Grijs et al. 1997). This suggests that the bulk of the dust in UGC 10043 is confined to the inner several kiloparsecs of the galaxy. This impression is reinforced by the composite image shown in Figure 1b, although part of this effect may come from the dust being more readily visible in projection against the bright bulge light.
A radial color gradient of 1.2 mags is observed along the midplane of UGC 10043, between the center and the edge of the disk, with reaching its minimum observed values of 0.7-0.8 near (Figure 6). Radial color gradients (where the disk becomes bluer with increasing galactocentric radius) are common in the disks of galaxies, and arise from a combination of stellar population and metallicity gradients (e.g., de Jong 1996b). If interpreted directly, the large observed color gradient in the UGC 10043 disk would suggest that either the disk built up slowly with time, and/or that significant viscous evolution has not taken place, perhaps owing to a low surface density (e.g., Firmani, Hernandez, & Gallagher 1996; but cf. Bell 2002). Unfortunately, radial color gradients become far more difficult to interpret in edge-on galaxies (e.g., Matthews & Wood 2001), and three-dimensional radiative transfer modeling together with imaging at additional wavebands will be needed to disentangle the influences of dust reddening and contamination from bulge light on the color gradient observed in UGC 10043.
Vertical color gradients in galaxy disks also provide important clues to their evolutionary histories, as they can unveil the presence of multiple disk components with different mean stellar compositions and ages (and hence different characteristic velocity dispersions), as well as evidence of past dynamical heating (e.g., Just, Fuchs, & Wielen 1996; Matthews 2000; Dalcanton & Bernstein 2002, but cf. de Grijs & Peletier 2000). Vertical color gradients are clearly visible in UGC 10043. Outside the bulge region (), the disk appears bluer near =0 than at higher , implying a concentration of the youngest stars toward the midplane (Figure 7). Within the bulge region itself, significant variations in color are also visible, with a gradient of 1.0 mags observed along the minor axis over the interval (Figure 8). These bulge color gradients appear to arise from a combination of projection effects, dust reddening, and stellar population differences between the disk and the inner and outer bulge. A steep, narrow, blue dip is seen in the minor axis color profile near (roughly wide), corresponding to the intersection of the major axis dust lane. Skirting this are much redder regions with observed colors as red as 2.4; these latter values are 0.8 magnitudes redder than the reddest dust-corrected colors of old, composite stellar populations (Caldwell & Rose 1997), and imply significant reddening from dust must be occurring to -heights at least from the midplane.
To explain the complex distribution of colors in the central regions of UGC 10043, we propose the following picture: near =0, dust within the disk located at intrinsically small is sufficiently optically thick that from our viewing angle, the bulge light is entirely occulted at and wavelengths, and we see only the bluer, outer disk light projected in front of it. As the optical depth of the inner disk drops with increasing , the bulge light at slightly higher is able to reach us, but only after being substantially reddened. Given the relatively small scale height of the disk, beyond , the bulge light is likely to be minimally contaminated. On the southwest side of the midplane, the bulge light near the minor axis is further reddened by the perpendicular dust structure discussed above (see Section 3, Figure 1a & b). Finally, beyond the color gradient on both sides of the bulge appears to flatten off to a fairly uniform value of 1.4. The modest color gradient that is observed over the interval [0.3] is similar to radial color gradients observed in the bulges of other Sbc galaxies (Balcells & Peletier 1994), and may be due to a modest stellar population/metallicity gradient. Interestingly, no abrupt color shifts are seen corresponding with the isophote position angle shifts discussed in Section 3.2.
One additional noteworthy feature of Figure 1c is the color structure of the inner disk regions, where we see evidence that the inner disk () is tilted relative to the outlying disk by roughly 3-5∘ (note the regions appearing as green and yellow in Figure 1c). Further evidence that this component is intrinsically tilted comes from the observation that the apparent midpoint of the major axis dust lane (presumed to arise from dusty material at small or intermediate ) does not lie on a straight line with respect to an extrapolation of the midplane from the outer disk regions (see Figures 1a & b). Typically, the presence of a tilted inner disk structure is difficult to infer in an edge-on galaxy due to projection and optical depth effects. However, other examples of this phenomenon are seen in the Milky Way (e.g., Liszt & Burton 1980; Sanders, Solomon, & Scoville 1984), the polar disk galaxy NGC 4650A (Gallagher et al. 2002), and the edge-on S0/Sb spiral NGC 5084 (Zeilinger, Galletta, & Madsen 1990). One possible origin for these types of tilts has been proposed by Ostriker & Binney (1989); they suggest that a continual slewing of the galactic potential due to infalling material could produce both inner-disk tilts, as well as outer-disk warps (see also Debattista & Sellwood 1999).
3.4 Narrow-Band Imaging
A continuum-subtracted H+[N ii] image of UGC 10043 is presented in Figure 1d. A smooth component of ionized gas is visible throughout the UGC 10043 disk, together with a number of brighter H ii complexes. In the outer disk regions, the scale height of the H emission appears smaller than that of the -band continuum emission, and the diffuse component is rather weak. On the northwestern tip of the disk, line emission is seen extended down to (2 kpc) from the midplane, tracing the stellar warp (see Section 3.1 and Figure 2). The southeastern side of the disk exhibits somewhat less emission at large galactocentric radii than the northwestern side, but two moderately bright H ii regions are found displaced roughly 7′′ (1.1 kpc) from the plane, together with a few faint patches of diffuse emission; these emission regions trace the outer envelope of the southeastern edge of the stellar warp.
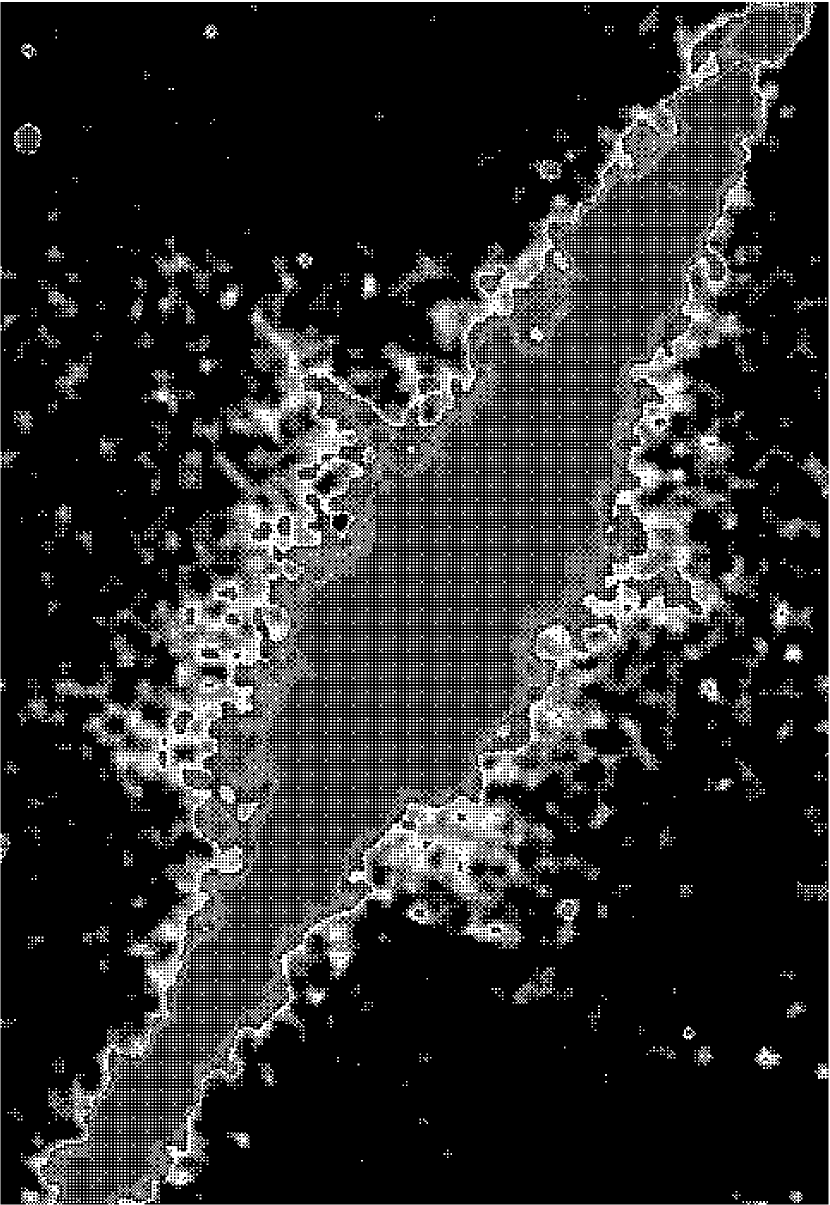
The most striking feature of Figure 1d is the structure of the emission in the central regions of UGC 10043. The ionized gas layer appears noticeably thicker in the inner 30′′ (5 kpc) of the galaxy, as traced by both the -extent of H ii complexes and the more smoothly distributed component. Moreover, faint, diffuse emission can be traced as far as (3.2 kpc) above and below the plane (at 2.5), forming a roughly biconical or “hourglass”-shaped structure. To further highlight the morphology of this low surface brightness, vertically-extended emission, we have convolved the image shown in Figure 1d with a Gaussian with =2.5 pixels, yielding in a FWHM resolution of . The resulting image is shown in Figure 9.
“Hour-glass”-shaped distributions of ionized gas with size scales of a few kiloparsecs or more are a hallmark of galaxies possessing large-scale galactic winds (e.g., Heckman, Armus, & Miley 1990; Lehnert & Heckman 1996; Veilleux & Rupke 2002). Figure 19 of Heckman et al. (1990) shows a cartoon sketch of the geometry of such a wind. These types of biconical winds are believed to be powered by a combination of multiple supernovae and stellar winds within regions of intense, centrally-concentrated star formation. The supernovae and stellar winds are expected to create a hot cavity that expands into an ambient halo medium, dragging along disk material (e.g., Suchkov et al. 1994). As we discuss in Section 6, there are several independent pieces of evidence for enhanced nuclear star formation in UGC 10043, albeit somewhat less than typifies most galaxies known to have large-scale winds. Moreover, the spectroscopic observations that we describe in Section 5.2 provide additional confirmation of the presence of expanding or outflowing gas and vertically increasing [N ii]/H ratios in UGC 10043, as expected in the presence of a galactic wind. We further discuss the properties of the wind and the implications for the evolutionary history of UGC 10043 in Sections 5.2 & 7.
4 Spectroscopic Observations and Data Reduction
Gaining further insight into the complex structure of the UGC 10043 system requires kinematic information to complement the imaging studies described above. In order to obtain two-dimensional kinematic measurements of the galaxy, we employed the DensePak integral field spectrograph on the WIYN telescope. DensePak is a fiber spectrograph that consists of ninety-one, 3′′-diameter optical fibers arranged in a 713 array. Five of the array fibers have failed since assembly. The array samples a 45 region on the sky, with separation between fibers. Four additional fibers can be used to obtain simultaneous sky spectra. A more detailed overview of DensePak can be found in Barden, Sawyer, & Honeycutt (1998).
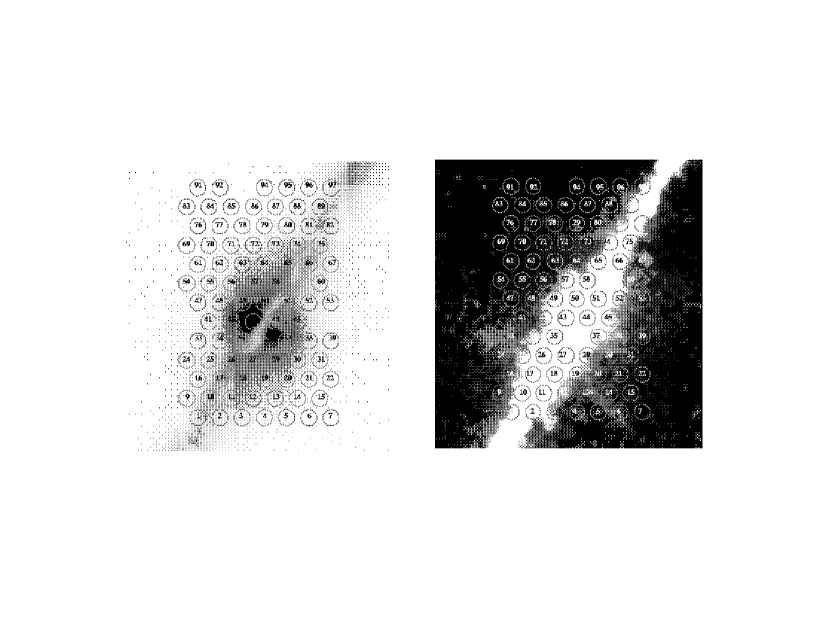
With DensePak we obtained observations of UGC 10043 over the wavelength range containing the redshifted H 6562.8Å and [N ii] 6548.0,6583.4Å lines in order to probe the kinematics of the ionized gas, and over the wavelength range containing the Ca ii infrared triplet (8498.0,8542.1,8662.1Å) in order to measure the stellar kinematics. These spectra were obtained on 2001 April 14 and 15, respectively. Seeing was - during the two nights. On each night, DensePak was positioned on the galaxy visually using the TV acquisition camera, hence the absolute position of the array center is known to an accuracy of roughly a few arcseconds. A position angle of was used for the fiber array (i.e., no rotation), resulting in the long axis of DensePak aligned north-south, and the galaxy major axis lying roughly along the diagonal of the array. The locations of the array fibers during the observations are indicated on -band and H+[N ii] images of UGC 10043 in Figure 10. As seen from this figure, the array sampled the bulge and the inner disk regions of the galaxy.
The DensePak fibers were fed to the Bench Spectrograph Red Camera, which employs a 20482048 T2kC thinned CCD with 24m pixels, a gain of 1.7 ADU-1, and a read noise of 4.3 . For the observations covering the H region, the 860 grating was used in second order, with the G5GG-495 blocking filter. The center wavelength was 6280Å, resulting in a wavelength coverage of 5811-6757Å and a dispersion of 0.461Å (22 km s-1) per pixel. Gaussian fits to unblended night sky lines yielded an estimate of the FWHM resolution of 59 km s-1. For the Ca ii spectra, the 860 grating in first order was used, centered at 8700Å, together with the G2RG-695 filter. This yielded a wavelength coverage of 7543-9701Å and a dispersion of 1.053Å (36 km s-1) per pixel. FWHM resolution, as determined by fitting a Gaussian to several night sky lines, was 86 km s-1.
Several bias and dome flat exposures were taken at the beginning of each night and combined using IRAF. During the H observations, spectra of CuAr lamps were taken regularly throughout the night to provide wavelength calibration. For the Ca ii observations, the copious night sky lines were used for calibration, with wavelengths for the sky lines taken from Osterbrock, Fulbright, & Bida (1997). Total integration times on the galaxy were 31200 seconds in the H + [N ii] region and 41200 seconds in the Ca ii region.
Reduction of the spectra began with the subtraction of overscan and bias levels from all frames. Next, the individual galaxy exposures and comparison lamp exposures were combined and cleaned of cosmic rays using the ‘crclean’ algorithm provided by M. Bershady. The remainder of the reduction, including wavelength calibration, dispersion correction, sky subtraction, and spectral extraction, was performed using the ‘hydra’ package within IRAF. Median dome flat exposures (obtained using a quartz lamp) were used to define the extraction apertures and to correct the spectra for fiber-to-fiber sensitivity variations.
For the H data, sky subtraction was achieved using the four designated sky fibers (see above). For the Ca ii spectra, since the galaxy lines were not detected in a number of the “object” fibers, (see Section 5.1 below), 10 additional line-free fibers were averaged to improve the signal-to-noise of the sky subtraction. RMS dispersions in the final wavelength solutions were 0.026Å (1.2 km s-1) for the H spectra and 0.043Å (1.5 km s-1) for the Ca ii spectra.
5 Analysis of the Spectroscopic Data
5.1 Stellar Kinematics from the Ca ii Triplet
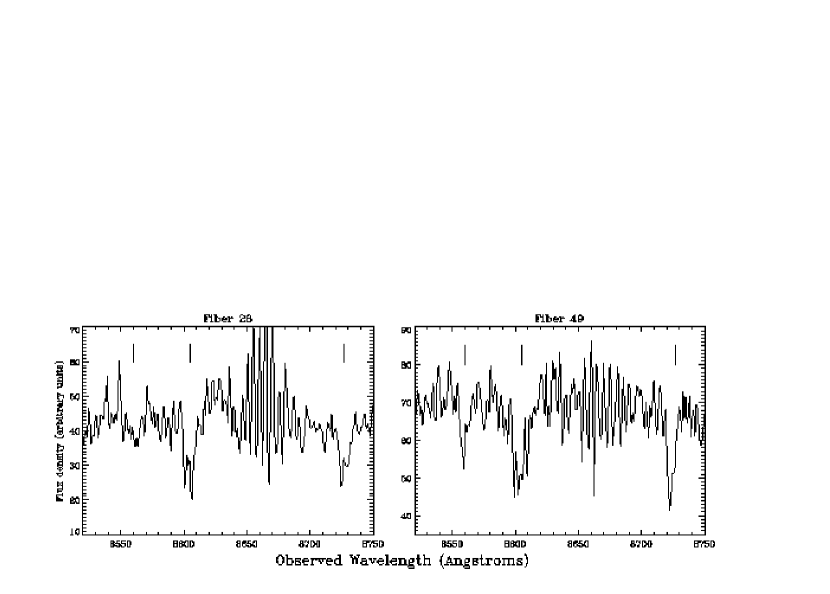
Absorption lines from the Ca ii infrared triplet were unambiguously detected in UGC 10043 in 31 of the 86 working DensePak fibers. The detection of these lines was limited to the bulge and a few points along the disk. Those disk locations where Ca ii was detected correspond with the higher surface brightness “inner disk” region prevalent in the color map of Figure 1c. Some sample Ca ii spectra are shown in Figure 11 to illustrate the typical quality of the data. The Ca ii spectral region is contaminated by numerous telluric OH emission lines as well as the broad atmospheric A-band (O2) emission feature near 7594Å. Residuals of these lines often remained after sky subtraction, making it difficult to determine the continuum levels in this wavelength region with high accuracy. This had little effect on the line centroid measurements, but did add uncertainty to the inferred stellar velocity dispersions (see below). In several of the spectra, the Ca ii lines show hints of being comprised of multiple components (see Figure 11 for an example). This cannot be attributed to night sky emission residuals, as fortuitously, no night sky emission lines overlap with the redshifted Ca ii lines from the galaxy. Where H ii regions are present, nebular Paschen series lines can be present in this region of the spectrum, including three that overlap in wavelength with the Ca ii triplet (see Terlevich et al. 1996); however we see no evidence of lines from this series elsewhere in any of our spectra, suggesting Paschen emission is not causing significant contamination of the Ca ii absorption profiles. Unfortunately, the signal-to-noise of the present data is insufficient to permit well-constrained, multiple-component fits to the individual lines, and higher resolution, higher signal-to-noise data will be needed to confirm if these multiple components are real and to better constrain their physical origin.
In order to derive the stellar kinematics from the Ca ii lines, we cross-correlated the spectra from each fiber against a synthetic template of a zero rotational velocity K1.5 giant from Kurucz (2003), broadened to match the instrumental resolution of the observations. The model template was oversampled and therefore effectively noise-free. In addition to line-of-sight radial velocity measurements, the cross-correlation yielded velocity dispersion measurements from the widths of the correlation peaks (see Section 5.1.2). The errors on each quantity were derived following the prescription of Tonry & Davis (1979), and do not take into account errors arising from possible non-Gaussian shapes of the lines.
The derivation of true rotational velocities in the galaxy would require corrections to the observed velocities for line-of-sight integration effects and asymmetric drift. However, both corrections are expected to be small compared with the size of the formal and systematic errors of the present data, and the uncertainties in the assumptions required for applying these corrections are likely to be comparable to the size of these corrections themselves (see e.g., Whitmore, McElroy, & Schweizer 1987). Therefore for the discussion that follows, we simply utilize the observed, line-of-sight radial velocities. That the asymmetric drift corrections are not large is underscored by the good agreement between the Ca ii velocities and the velocities inferred from the H and [N ii] emission lines at a given (see Figure 19, discussed below).
5.1.1 Ca ii Line-of-Sight Radial Velocities and the Kinematics of the Bulge
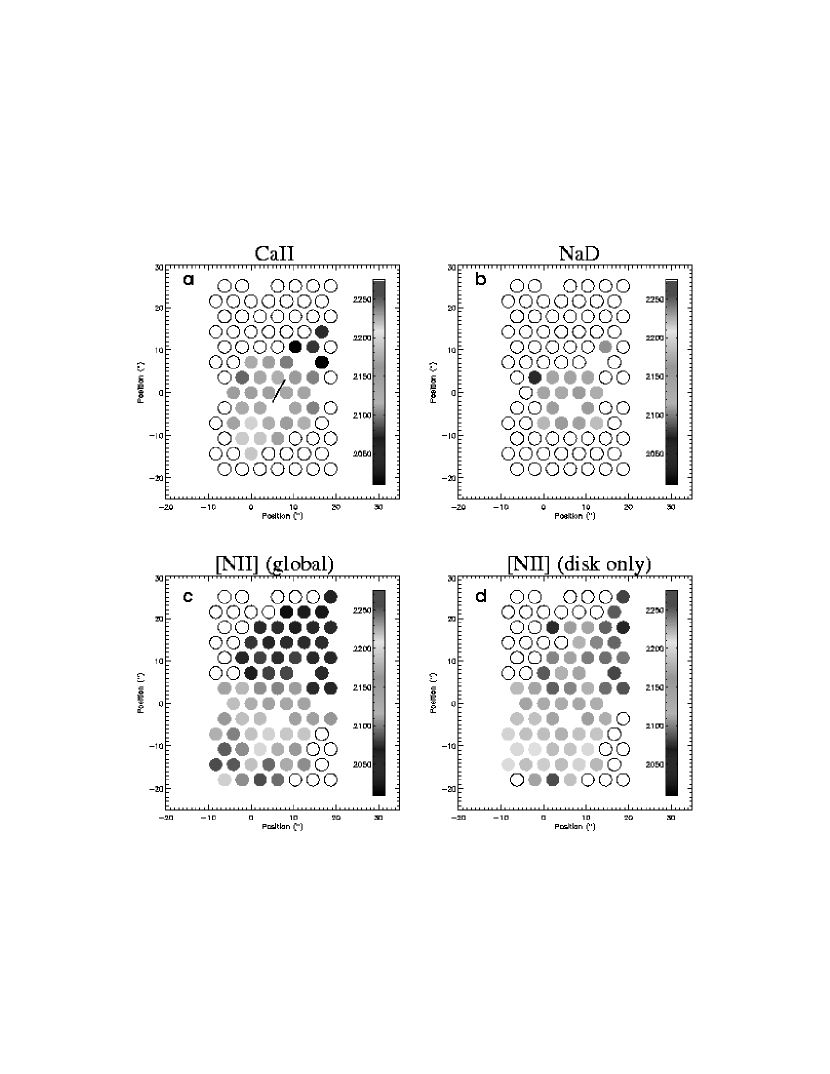
A map of Ca ii line-of-sight radial velocities as a function of fiber position is shown in Figure 12a. Error bars range from 7-20 km s-1 in most cases (23 fibers), but are as high as 20-40 km s-1 in a few fibers.
As seen in Figure 12a, some evidence of a velocity gradient is apparent along the galaxy major axis, indicative of rotation (see also Figure 19, discussed below). The peak Ca ii rotational velocities observed along the fibers closest to major axis are 70 km s-1, and occur at the last measured points near . However, the bulge model derived in Section 3 and the apparent high optical depth in the midplane at small (e.g., Figure 8), both suggest that the two rows of fibers nearest the midplane are likely to be significantly contaminated by disk light (see also Figure 10). This implies that the observed rotation is not necessarily intrinsic to the bulge itself. Indeed at higher -heights (), no evidence of systematic rotation is seen, suggesting the bulge is rotating slowly, if at all, about the galactic pole.
Lack of significant bulge rotation is unusual for a normal Sbc galaxy, where frequently bulge rotation speeds are comparable with those in the adjacent disk (e.g., Kormendy & Illingworth 1982; Kormendy 1993). However, in the case of UGC 10043, it seems congruous both with the lack of significant flattening of the bulge isophotes and with the apparent geometric decoupling between disk and bulge (e.g., Figure 5). In addition, this behavior is consistent with other early-type spirals with orthogonally elongated bulges (Bertola et al. 1999; Sarzi et al. 2000; Reshetnikov et al. 2002; Corsini et al. 2003), as well as with polar ring galaxies, where the “bulge” is of course actually a subsystem rotating orthogonally to the disk plane. Therefore, given the peculiar isophotal structure of the UGC 10043 bulge, a key goal of our spectroscopic measurements was to investigate the bulge kinematics of UGC 10043 perpendicular to the disk in order to search for similar signs of orthogonal rotation.
In Figure 13, we plot the derived radial velocities (relative to ) as a function of -distance for all fibers within where the Ca ii lines were detected (fibers 29,30,35,37,38,41-45,48-50,56). Because of the major axis gradient discussed above, the values near show an intrinsic spread, depending on whether they are measured on the approaching or receding side of . To compensate for the observed scatter and to best emphasize any underlying systematic gradient along the direction, we computed at each value an (unweighted) mean velocity for each group of measurements. Based on these mean values, the data in Figure 13 reveal no evidence for a rotational gradient along the minor axis of UGC 10043.
Unfortunately, the rather coarse spatial sampling provided by DensePak, coupled with the existence of two failed fibers near the center of the array, mean that relatively few fibers sample the bulge of UGC 10043, particularly the inner, vertically elongated region, which is only 15′′ across. As a result, kinematic peculiarities confined to the inner few arcseconds of the bulge () would likely be undetected. Another complication in interpreting the Ca ii data is that, as noted above, a number of the spectra show hints of multiple velocity components that cannot be reliably decomposed due to insufficient signal-to-noise. Nonetheless, the present data seem to rule out any significant global minor axis rotation of either the entire UGC 10043 bulge, or its entire vertically-elongated inner component. This result implies that the peculiar bulge of UGC 10043 is inconsistent with an S0-like galaxy tilted orthogonally to the main disk, and that UGC 10043 is not a classic polar ring galaxy masquerading as an edge-on spiral.
That UGC 10043 is different in several important respects from other kinematically-confirmed polar ring galaxies was already indicated by the imaging data discussed above. An S0-like galaxy would not be expected to show the type of isophote twisting and oblate outer isophotes seen in the bulge of UGC 10043 (Section 3.2.1). In addition, in typical polar ring systems, the central (S0-like) component typically dominates the total light of the galaxy, unlike the case for UGC 10043 (Section 3.2.1). Finally, photometrically there is no evidence that the stellar disk of UGC 10043 is actually a ring or annulus, since we see no sign of edge-brightnening (e.g., Figure 3). The presence of a large-scale galactic wind (Section 5.2), seemingly emulating from the inner disk regions also argues against this picture. Nonetheless, we wish to emphasize that a disk rather than a ring morphology in itself does not exclude the possibility of an evolutionary link with certain types of polar ring galaxies. There is now evidence that some polar “ring” systems, including a prototype of this class, NGC 4650A, actually have a complete or nearly-complete polar disk (e.g., Gallagher et al. 2002; Iodice et al. 2002). Another strong candidate for a “polar disk” galaxy is ESO 603-021, whose peculiar “bulge” shares a number of intriguing structural similarities with UGC 10043 (Arnaboldi, Capaccioli, & Combes 1994; Reshetnikov et al. 2002). Recent numerical work suggests systems like NGC 4650A and ESO 603-021 may have a different formation mechanism from polar ring galaxies with narrow rings (e.g., Bekki 1998; Bournaud & Combes 2003). Moreover, certain similarities between UGC 10043 and ‘polar disk’ galaxies suggest it may provide some important new clues for understanding the origins of these latter systems (see further discussion in Section 7).
As discussed in the Introduction, in addition to the kinematically-confirmed “polar disk” galaxies, a handful of other examples of bona fide disk galaxies are now known that have vertically elongated and/or orthogonally decoupled bulges. However, these systems are distinct from polar disk galaxies in that their entire “bulge” does not exhibit minor axis rotation, but instead it contains a small, orthogonally-rotating inner core, only a few arcseconds across (Bertola et al. 1999; Sarzi et al. 2000; Corsini et al. 2002,2003). One of the first discovered examples of this class is the Sa/Sab galaxy NGC 4698 (Bertola et al. 1999). NGC 4698 is seen at a somewhat lower inclination than UGC 10043 (), but it too exhibits a bright bulge that appears visually elongated in a direction perpendicular to its lower surface brightness, dusty disk (see Sandage & Bedke 1994). A parametric decomposition by Bertola et al. (1999) shows the bulge to be elongated over its full extent (), although orthogonal rotation (with peak amplitude 30 km s-1) is detected only within a small, inner core (). This “core” was later found by Pizzella et al. (2002) to be a nuclear disk. In the preferred interpretation of Bertola et al. (1999), no rotation of the bulge occurs along the disk major axis of NGC 4698. However, as discussed by those authors, an independent, non-parametric decomposition of the galaxy light by Moriondo, Giovanardi, & Hunt (1998) implies much rounder bulge isophotes (=0.08). With this model, a self-consistent picture of the photometry and kinematics would then demand some rotation of the bulge along the major axis, plus an orthogonally rotating core, together with a third central luminous component (see also the discussion in Sarzi et al. 2000). This latter picture appears to be closer to the one emerging for UGC 10043.
Unfortunately, because of the limited spatial resolution of the DensePak data, we cannot yet confirm whether or not UGC 10043 may also have a small (), kinematically decoupled inner core or nuclear disk. The search for the kinematic signatures of such a component using high-resolution longslit spectroscopy will be an important next step both in establishing whether such cores are ubiquitous in galaxies with vertically elongated, non-rotating bulges, and also in uncovering the formation history of these types of galaxies.
Although our Ca ii spectra do not reveal any clear evidence of orthogonal bulge rotation, they do reveal one potentially important clue to the overall bulge structure of UGC 10043 in the form of apparent velocity shifts of 30 km s-1 on either side of the bulge. Although the statistical significance of this effect is only marginal, these velocity shifts have the same sign on both sides of the bulge and are seen to correspond precisely with the photometrically-defined transition between the inner and outer bulge isophotes (Section 3.2.1)—i.e., with the location where the bulge isophotes abruptly change ellipticity and position angle (denoted by arrows in Figure 13). Kinematic signatures of this types are expected in triaxial potentials at the locations where orbits transition from elliptical to circular (e.g., Corsini et al. 2003). This therefore adds possible kinematic evidence to the case for a triaxial bulge in UGC 10043 (see also Section 3.2.1).
5.1.2 Stellar Velocity Dispersions
Stellar velocity dispersions () inferred from the cross-correlation analysis of the Ca ii lines are plotted as a function of fiber number in Figure 14. Typical values are found to lie in the range 100-130 km s-1. Overall, the formal uncertainties on the velocity dispersion measurements are rather large, due to a combination of residual contamination from night sky lines (which adds uncertainty to the continuum level determination), and the fact that line broadening due to random stellar motions in UGC 10043 is small compared to the instrumentally-broadened Ca ii line widths of the K-giant star used as a template for the cross-correlation. We find no evidence of systematic changes in the values as a function of position in UGC 10043, although given the large error bars, the presence of modest vertical or radial gradients in cannot be ruled out.
5.1.3 - and Correlations
Given the complex structure of the UGC 10043 bulge, it is of interest to see how some of its characteristic parameters compare with established relations for spiral bulges and other spheroidal systems. Taking as a representative value of the stellar velocity dispersion the mean value for the 10 points with the smallest error bars (40 km s-1) gives km s-1. As discussed in Section 5.1.1, if we consider only the fibers with (where disk contamination is minimized), our current data show no compelling evidence of significant rotation of the bulge along the galaxy major axis, suggesting km s-1. This implies the UGC 10043 bulge is characterized by a ratio . Adopting a representative value for the outer bulge isophotes of 0.2 (see Figure 4), we can then place the bulge of UGC 10043 on the versus diagram for spheroidal systems. This relation is of interest for spheroidal systems, since under the simple assumption that spheroids are oblate with isotropic velocity dispersions, the virial theorem predicts a fixed relationship between these two quantities. Indeed, the bulk of early-type bulges are seen to adhere fairly closely to this relation (e.g., Kormendy 1993, his Figure 3). However, in the case of UGC 10043, the observed outer-bulge value of would predict a ratio . In contrast, the observed value of places UGC 10043 in the portion of the - plane inhabited by elliptical galaxies rather than bulges (see also Kormendy & Illingworth 1982; Davies et al. 1983).
We can also compare the and values derived for the UGC 10043 bulge with standard (Faber-Jackson) relations. Adopting the -band bulge luminosity determined in Section 3, assuming a mean color for the bulge region of , and assuming internal extinction in the bulge to be negligible, the -band relation for SA0-Sbc bulges derived by Kormendy & Illingworth (1983) predicts a central velocity dispersion of 140 km s-1. Their analogous relation derived from a sample of elliptical galaxies predicts 124 km s-1. The value measured in the center of UGC 10043 (fiber 43) is km s-1—consistent with either prediction to within observational uncertainties.
5.2 Kinematics of the Ionized Gas
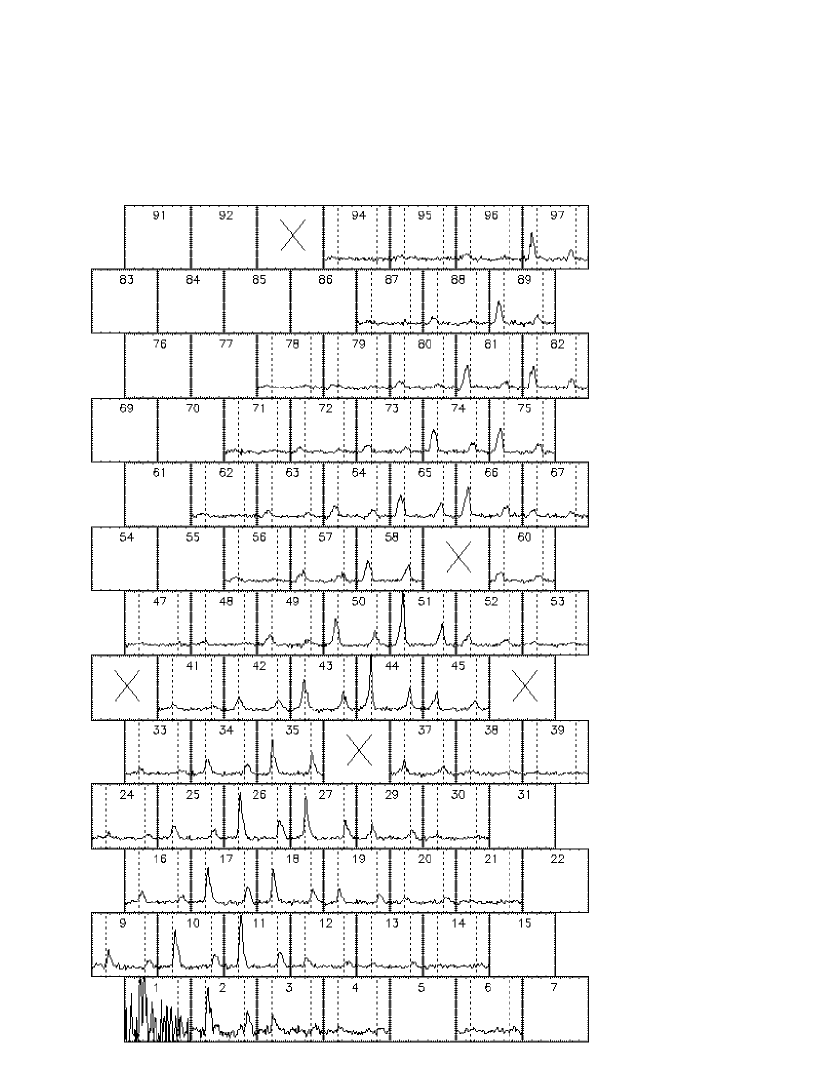
As described above, a second set of DensePak observations of UGC 10043 focussed on the wavelength range encompassing the H and [N ii] emission lines in order to permit an investigation of the kinematics of the ionized gas. Figure 10 shows the adopted positioning of the DensePak array on an H+[N ii] image of the galaxy. In total, H emission was detected (at ) in 68 of the 86 functioning DensePak fibers and [N ii] was detected in 63 fibers.
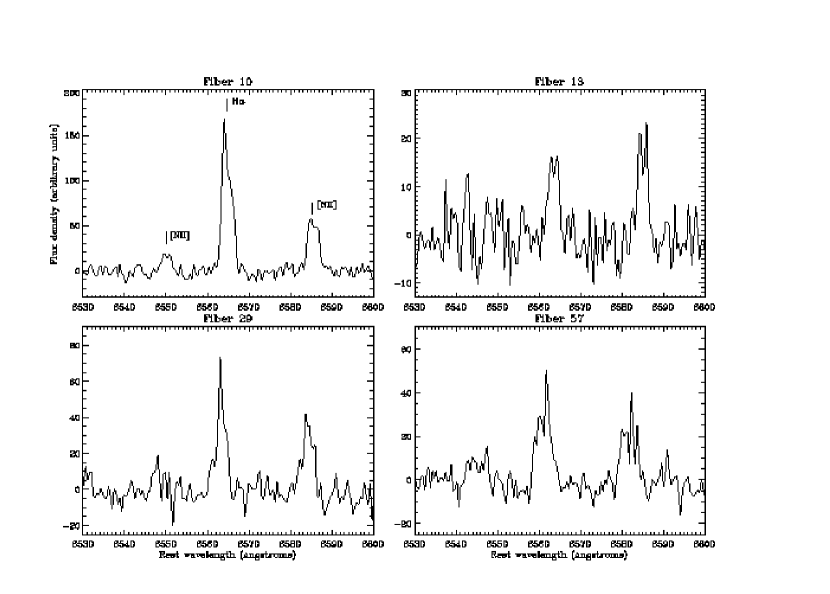
Small portions of the H+[N ii] spectra are plotted as a function of position in Figure 15 in order to give a sense of how the line shapes, widths, and ratios change as a function of location in the galaxy. Larger versions of a few representative spectra are shown in Figure 16. It is evident from these figures that in many cases, both the H and [N ii] lines resolve into multiple velocity components. Complex line profiles are especially prevalent above and below the midplane (e.g., fibers 13, 29, & 57), although a number of the lines observed along the midplane also show hints of complex structures (e.g., fibers 43 & 65). We further discuss the physical implications of the line shapes below.
In order to measure the velocity field traced by the H and [N ii] emission, we fitted Gaussians plus a linear background to the emission lines in each fiber. Owing to the edge-on geometry of UGC 10043, lines-of-sight toward the inner regions of the galaxy intersect material at a wide range of intrinsic galactocentric radii. Consequently, the observed line shapes are not expected to be purely Gaussian, but rather to have a Gaussian envelope on the side of the velocity extremum, plus a tail toward the systemic velocity (see Figures 2 & 3 of García-Ruiz, Sancisi, & Kuijken 2002 for an heuristic illustration). The result is that at small or intermediate , intensity-weighted Gaussian fits will tend to underestimate the true rotational velocities and may produce a rotation curve somewhat shallower than the intrinsic disk rotation curve. However, because of the complex structures of the H and [N ii] line profiles in UGC 10043 and the limited spectral resolution of the current observations, we have not attempted to correct for this effect. This does not affect any of the conclusions that follow.
Initially, we fit only a single Gaussian to each emission line in order to obtain a global impression of the kinematics. No constraints on the widths or relative velocity offsets of the fitted components were imposed. We fitted both lines of the [N ii] doublet to supply a check on wavelength calibration and error estimates, but for the analysis that follows, we use the [N ii] velocities derived for the stronger line in the doublet. Uncertainties on the line centroids were estimated as km s-1, where is the velocity resolution per pixel and is the signal-to-noise ratio of the line. was evaluated by taking the ratio of the peak flux in the fitted line to the spectral rms (evaluated over the line-free portion of the spectrum between roughly 6500-6700Å). Estimated errors for the H velocities range from 3-17 km s-1, with a mean value 9 km s-1; for the [N ii] velocities, errors range from 5-27 km s-1, with a mean of 10 km s-1.
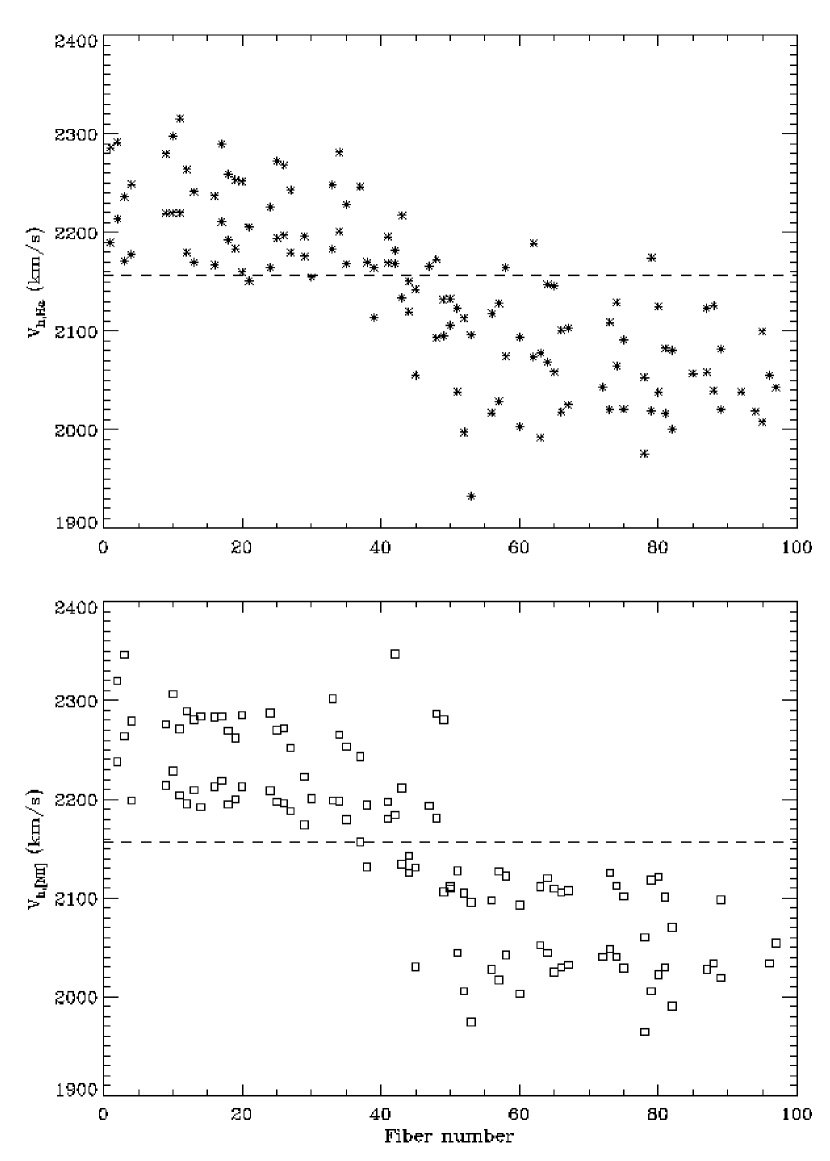
In Figure 12c we plot the [N ii] velocities as a function of position in the galaxy, while in Figure 17 we plot the radial velocities derived from the single-component fits as a function of fiber number for both the H and [N ii] lines. Surprisingly, for many of the fibers plotted in Figure 17, an offset of up to 60 km s-1 is seen between the inferred H and [N ii] velocity centroids. This offset is significantly larger than the expected velocity errors. Furthermore, these velocity offsets cannot be the result of a wavelength calibration error, as both lines of the [N ii] doublet show the same behavior, and their wavelengths bracket that of H. We have verified that no night sky or diffuse interstellar lines are contaminating the H measurements, and that this offset is not the result of residual contamination from underlying stellar absorption in the H line (see Section 5.3). Moreover, both redward and blueward of the systemic velocity, the offset between the H and [N ii] velocities is such that the [N ii] lines lie systematically further from than the H lines, suggesting the origin is likely to be a real, physical effect. Examining the spatial distribution of the velocity offsets, we find that for fibers lying near the disk midplane, the offsets are no more than 10 km s-1, the size of the typical error bars. However, the offsets increase with increasing -height, and reach their most extreme values (60 km s-1) near the northeast and southwest “corners” of the hourglass-shaped distribution of ionized gas highlighted in Figure 9.
Because a significant fraction of the emission line profiles in UGC 10043 appear complex and could not be well-represented by only a single Gaussian (Figure 15 & 16), we performed a second set of velocity measurements to these spectra where we decomposed the lines using two Gaussian components. Once again, no constraints were imposed on the line widths or relative wavelength separations. Based on these two-Gaussian decompositions, we find a mean velocity dispersion for both the H and [N ii] line components of 0.6Å (25 km s-1) after correction for instrumental broadening.
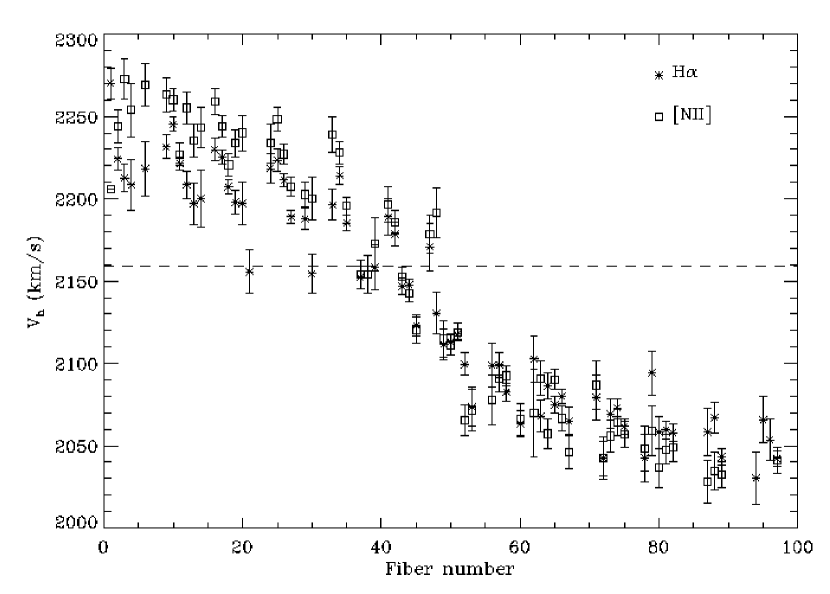
In Figure 18 we have plotted the velocities derived from the two-component decompositions of the H lines (top) and the [N ii] lines (bottom), both as a function of fiber number. It can be seen that the [N ii] lines predominantly decompose into two cleanly separated velocity components, with typical offsets of 70-80 km s-1. The H components show a slightly larger spread of velocities, and in spite of comparable signal-to-noise, these lines do not cleanly decompose into distinct groupings. Part of this difference may be the result of the underlying stellar absorption in the H line, which could introduce additional uncertainties in the H emission line decompositions. However, at a number of locations the H line decompositions show the presence of a velocity component within 20 km s-1 of , whereas no analogous component emerges from the [N ii] fits. With two exceptions, this occurs for fibers either well above or below the midplane (). Interestingly, roughly half of the fibers containing evidence of additional H emission near correspond to the locations where the velocity offset is observed to be the largest based on the one-component Gaussian fits presented in Figure 17. This raises the possibility that the H lines observed at some locations may actually be comprised of three or more distinct components, including one near (which in turn would bias the one- and two-Gaussian decompositions to lower velocities). However, the physical explanation for such a component present only in H is unclear, and this possibility will require investigation with additional high spectral resolution observations.
In light of the trends described above, what are the physical implications of the emission line shapes observed in UGC 10043? For the [N ii] lines, the interpretation is more straightforward than the seemingly more complex H lines. In the case of the [N ii] lines, the velocity component nearer to the systemic velocity (hereafter Component A) follows the pattern expected for the rotation of the underlying disk. We plot the Component A velocities in Figures 12d & 19. For comparison, in Figure 19 we have also overplotted the corresponding velocities derived from the Ca ii lines in Section 5.1.1. Although the stars and the ionized gas in UGC 10043 are not necessarily expected to share the same spatial distribution, at most locations the velocities show good agreement, despite the neglect of asymmetric drift corrections for the Ca ii values.
The peak rotational velocities traced by the [N ii] lines are 80 km s-1 and 85 km s-1 on the two sides of the galaxy, respectively, and occur near the last measured points at . These values are significantly less than the peak rotational velocities inferred from global H i observations ( km s-1; Section 6), implying the rotation curve is still rising throughout the region sampled by the DensePak data.
While Component A of the [N ii] lines traces the underlying disk rotation, the second, higher velocity component of the [N ii] lines (hereafter Component B), presents the expected signature of a large-scale, cylindrically symmetric, biconical wind (e.g., Heckman et al. 1990). The existence of this wind was already suggested by the narrow-band imaging observations presented in Section 3.4, and these new emission line spectra provide firm kinematic confirmation of its existence. Because UGC 10043 is seen so nearly edge-on, it is expected that most lines-of-sight will intersect only a single cone of the wind (see the schematic cartoon in Figure 19 of Heckman et al. 1990), and this is consistent with the observed velocity structure of the lines. The line decompositions also imply that we are primarily seeing emission only from the near sides of the bicones.
Using a combination of the new imaging and spectroscopic data, it is possible to estimate some rough properties of the galactic wind of UGC 10043. From Figure 9, we estimate an opening angle for the wind to be . Assuming the bulk of the ionized gas entrained in the wind is outflowing tangentially along the surfaces of the bicones, the outflow velocity can be expressed as , where is the observed velocity offset between the wind material and the material following the normal galactic rotation at a given position. Taking 80 km s-1 (Figure 18) yields 104 km s-1. Typical outflow velocities for “superwind” galaxies tend to lie in the range 200-1000 km s-1 (e.g., Heckman 2001), whereas the wind speed inferred for UGC 10043 is comparable to the inferred expansion velocity for the weak bipolar wind at the Galactic Center (Bland-Hawthorn & Cohen 2003) and to the high end of expansion velocities measured for supershells in dwarf galaxies (e.g., Martin 1998). UGC 10043 thus appears to have one of the most feeble large-scale, collimated winds presently known. We further discuss the energy budget from massive stars in UGC 10043 in Section 6, and we speculate on a possible triggering mechanism for the wind in Section 7.1.
5.2.1 Minor Axis Kinematics of the Ionized Gas
As discussed in Section 3, the presence of a dust lane along the minor axis of UGC 10043 (which in turn, may be part of an inner polar ring structure) hints at the presence of material in the bulge region whose angular momentum is misaligned relative to that of the disk. Based on the DensePak absorption line spectroscopy we have obtained, no evidence of orthogonal rotation was detected in the stellar component of UGC 10043 (Section 5.1.1). An alternate possibility is that there may be orthogonally rotating material present that is predominantly gaseous, as in the case of minor axis dust lane ellipticals (e.g., Bertola 1987; Sage & Galletta 1993) or the orthogonally-decoupled gas disk in the core of the Sa spiral NGC 2855 (Corsini et al. 2002).
Unfortunately, the search for orthogonally-rotating ionized gas in UGC 10043 is complicated by the large-scale galactic wind, whose kinematic signatures already produce a complex imprint on the line profile shapes. Nonetheless, such a component might still manifest itself in the form of a systematic shift in the intensity-weighted velocities along the direction of the minor axis.
In Figure 20 we investigate the kinematics of the ionized gas along the apparent minor axis of UGC 10043 using the mean velocities derived from single-Gaussian fits to [N ii] lines. As was the case with the stellar Ca ii lines, no evidence for a significant minor axis rotational gradient is apparent (20 km s-1); a similar result is seen in H. We have also examined the two-component line decompositions to search for rotational signatures or other velocity peculiarities associated with the locations of the minor axis dust lane and possible inner polar ring structure, but no unambiguous evidence of orthogonal rotation is seen. We are forced to conclude that although the UGC 10043 imaging data provide tantalizing hints of orthogonally-rotating material in this galaxy, if such a component is indeed present, its kinematic signatures are subtle, and our current spectroscopy does not have sufficient sensitivity and resolution to verify its existence.
5.3 Emission Line Ratios
Although the time-variable throughput of the DensePak fibers prohibits accurate spectrophotometry with this instrument, it is still possible to examine the emission line intensity ratios ([N ii]/H) as a function of position in the galaxy in order to probe possible changes in temperature or ionization state. Owing to the uncertainties inherent in uniquely decomposing the emission lines into multiple velocity components, we do not attempt to determine the line ratios for the individual velocity components from the present data, but concentrate only on the global values.
Before quantifying the [N ii]/H line ratios, it is necessary to account for stellar absorption underlying the interstellar H emission lines. To correct for this effect, we used synthetic galaxy absorption line spectra generated over the wavelength range of our observations. These were produced using the spectral synthesis code of Bruzual & Charlot (2004). The models assumed a Salpeter initial mass function (with lower and upper mass cutoffs of and , respectively), solar metallicity, zero dust reddening, an instantaneous burst of star formation, and an age of 8 Gyr. However, over the wavelength range of interest, and for intermediate age stellar populations, the results are insensitive to metallicity and burst duration. We found models with 3Å resolution to give a good match to the observed widths of the galaxy lines. After appropriately redshifting the model template spectra, we normalized the continuum levels between the models and each spectrum, and then subtracted the suitably scaled template from the data to remove the stellar component.
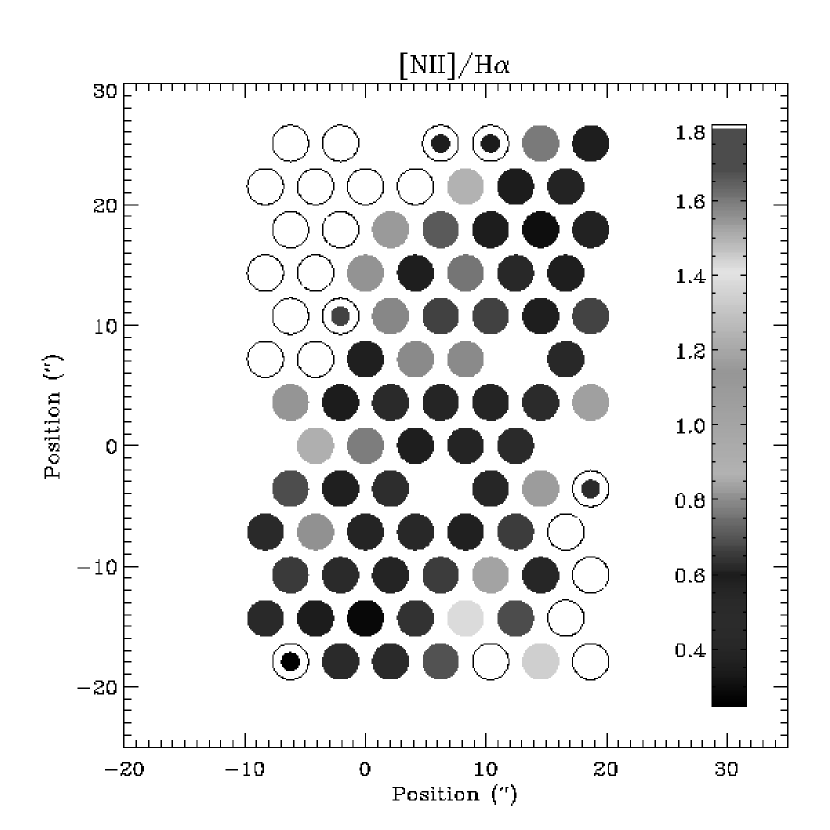
We plot the resulting [N ii]/H line ratios as a function of spatial position in Figure 21. Along the disk of the galaxy, the observed [N ii]/H ratios range from 0.18 (an upper limit) to 0.80, with higher values concentrated towards the central regions. The mean value for the 23 fibers closest to the midplane () is [N ii]/H=0.430.14—very typical of H ii region values (e.g., Miller & Veilleux 2003). Away from the midplane however (), there is a clear trend of increasing [N ii]/H ratios, including 8 fibers where [N ii]/H1.
Similar increases in the [N ii]/H ratio with increasing -height have now been observed in a number of edge-on spiral galaxies, both with and without winds (e.g., Lehnert & Heckman 1996; Rand 1998; Otte, Reynolds, & Gallagher 2001; Miller & Veilleux 2003). However, the physical origin of this effect has been a long-standing controversy. In particular, it has been argued that sources of ionizing heating in addition to photoionization from hot stars (e.g., shocks or turbulent mixing layers) may be required to explain the most extreme line ratios (see Miller & Veilleux 2003 and references therein). For a galaxy with a collimated wind, the generation of the wind involves the expansion of a shell of hot gas into an ambient medium; this in turn is expected to produce a shell of shocked gas (e.g., Chevalier & Clegg 1985). This could seemingly offer a natural explanation for the -dependent line ratios observed in UGC 10043. However, given the relatively low inferred outflow speed for the wind, it is not clear how effective such shock heating would be. In addition, recent photoionization models of disk galaxies that take into account the multiphase nature of the ISM and the hardening of the stellar radiation field with increasing can predict [N ii]/H ratios as high as 1.5 (Bland-Hawthorn, Freeman, & Quinn 1997; Wood & Mathis 2004). In UGC 10043, [N ii]/H1.5 is observed only in one fiber (fiber 14, where [N ii]/H=1.7), so the role of shocks versus photoionization in accounting for the observed line ratios remains unclear. Ultimately, observations of additional emission line diagnostics, coupled with three-dimensional modelling, will be needed to better explore this question.
5.4 Detection of the Na D Lines in UGC 10043
After H, the strongest stellar absorption line expected within the wavelength range covered by the DensePak H+[N ii] spectra is the Na D doublet at 5889.95,5895.92. This doublet is prominent in the spectra of cool stars (particularly K and M spectral classes). However, in many galaxies there can also be a significant interstellar contribution to these lines (e.g., Heckman et al. 2000).
The Bruzual & Charlot models described in Section 5.3 predict that the strength of stellar Na D absorption lines would make them essentially indistinguishable from the noise in the present data. If the mean stellar population is somewhat younger than we have assumed, the lines are expected to be even weaker, while for an older population, any increase in line strength is negligible. Despite these predictions, we detect the Na D doublet in 15 fibers near the center of UGC 10043 (Figure 12b). With one exception, the corresponding fibers lie within the “prolate” region of the inner bulge. Interestingly, in all cases where Na D was detected, these lines appear to be not only deeper, but narrower than predicted by the (purely stellar) Bruzual & Charlot models. This strongly suggests these lines are dominated by an interstellar contribution. Given our viewing geometry of UGC 10043 it is difficult to distinguish whether some of the Na-absorbing gas is associated with the disk of UGC 10043, or whether it is all intrinsic to the bulge region. The velocities of the Na D lines (derived from fitting a Gaussian+background to each component) do not help to distinguish between these possibilities, since they match the velocities of both those of the Ca ii lines (assumed to arise predominantly in the bulge; Section 5.1.1) and Component A of the [N ii] lines (associated with the disk; Section 5.2) to within errors.
6 Radio and Far-Infrared Properties of UGC 10043
In order to estimate the energy budget from massive stars in UGC 10043, as well as understand the conditions in its interstellar medium that made it conducive to forming a detectable large-scale wind, it is of interest to examine the radio and far-infrared properties of the galaxy.
UGC 10043 was observed in the H i 21-cm line by Lewis et al. (1985) and Freudling, Haynes, & Giovanelli (1988), both using single-dish telescopes. The spectrum of Freudling et al. was subsequently reanalyzed by Giovanelli, Avera, & Karachentsev (1997). UGC 10043 exhibits a classic double-horned H i profile characteristic of a rotating disk. The Lewis et al. H i spectrum appears rather asymmetric, but this may be the result of a small pointing error, as the Freudling et al. spectrum shows only a slight asymmetry in the peak flux of the two horns. Both edges of the H i profile are steep and have approximately equal slopes, showing no evidence for any recent perturbations of the outer H i disk. However, the spectrum shows an excess “bump” near the systemic velocity (roughly 100 km s-1 wide and the rms noise), hinting there could be anomalous H i gas in the inner regions of the galaxy.
The maximum disk rotational velocity for a galaxy can be estimated as , where is the global H i linewidth measured at 20% peak maximum and 20 km s-1 accounts for the typical random component of the gas motions. For UGC 10043 this yields 160 km s-1 (see Table 1). The total dynamical mass internal to the last measured point may then be estimated as , where we have assumed =17 kpc.
Using the integrated H i flux from Giovanelli et al. (1997), and assuming the gas is optically thin, the H i mass of UGC 10043 is , and 0.66 (). While the distribution of the H i gas in UGC 10043 is unknown, the shape of the global line profile suggests gas distributed throughout an extended disk, and both the H i mass and the fractional H i content suggest the galaxy has ample raw fuel for star formation and abundant gas-rich material which could become entrained in a wind-driven outflow.
UGC 10043 was detected by IRAS in all four of its bands. According to the NED database, the measured 60m and 100m fluxes are 1.164 Jy5% and 3.453 Jy7%, respectively. Using the definition of Helou et al. (1988), this yields a far-infrared luminosity ergs s-1, integrated between 40-120m (see Table 1). This is roughly an order of magnitude lower than the canonical values found by Lehnert & Heckman (1996) to typify galaxies with superwinds ( ergs s-1). The ratio =0.34 for UGC 10043 is somewhat smaller than the minimum values found by Lehnert & Heckman (1996) in galaxies exhibiting superwinds (0.5), and also falls below the cutoff for so-called “infrared warm” galaxies (0.4; e.g., Lehnert & Heckman 1996). In a global sense, UGC 10043 therefore does not come close to classifying as a starburst galaxy. Indeed, compared with the mean physical parameters for galaxies of various Hubble types tabulated by Roberts & Haynes (1994), UGC 10043 is quite typical of normal Sbc spirals in terms of its H i mass, dynamical mass, and far-infrared luminosity, while its optical luminosity falls somewhat below normal (by roughly a factor of two) giving it a ratio more typical of giant low surface brightness spirals (e.g., Matthews, van Driel, & Monnier Ragaigne 2001).
The 20-cm radio continuum flux of UGC 10043 obtained by the NRAO VLA Sky Survey (NVSS) is =10.60.9 mJy (Condon et al. 1998), making the galaxy consistent with the radio-far-infrared correlation (Condon 1992). Hummel, Beck, & Dettmar (1991) also detected UGC 10043 at 6-cm, measuring =4.50.1 mJy. Together these two measurements imply a steep spectral slope dominated by synchrotron emission (see Condon 1992). The detected radio continuum emission at both frequencies is confined to the inner disk/bulge region of the galaxy. In the NVSS data, the continuum emission is marginally resolved along the -direction, implying a deconvolved size for the emitting region of FWHM. From the 6-cm observations, Hummel et al. (1991) also report a similar -extent (); this is comparable to the angular extent of the wind-emitting region (e.g., Figure 1).
The confinement of the bulk of the radio continuum emission to the inner regions of UGC 10043 is consistent with other evidence for centrally-concentrated star formation, including candidates for dark clouds across the inner 2-3 kpc seen in the optical images (see Figure 1), as well as the mid-ultraviolet imaging data of Windhorst et al. (2002), which when smoothed to increase signal-to-noise, show the inner 15′′ of the bulge region to be the brightest portion of UGC 10043 in the mid-ultraviolet. Note that whereas some bulges are detected in the far-ultraviolet due to UV light from old, low-mass stars, the mid-ultraviolet (center at 3000Å) used by Windhorst et al. primarily traces young (age 1 Gyr) stellar populations. Furthermore, that this UV emission is associated with the bulge rather than the inner disk is suggested by its elongated -distribution. We have verified that this flux does not result from the red leak of the (mid-UV) filter (see Biretta et al. 2000) by folding our Bruzual & Charlot model spectrum (Section 5.3) through the filter’s WFPC2 response function via the STSDAS444STSDAS was developed at the Space Telescope Science Institute. STScI is operated bythe Association of Universities for Research in Astronomy, Inc. for NASA. SYNPHOT package. We find that only 1% of the flux can be due to red leak. Together these findings provide evidence for enhanced nuclear star formation in UGC 10043, while at the same time underscoring that the outer UGC 10043 disk appears of optically low surface brightness owing primarily to a lack of stars rather than to heavy dust obscuration.
Using the radio continuum and far-infrared luminosities, together with the H luminosity from Section 2, we can obtain three estimates of the current total star formation rate (SFR) in UGC 10043. To correct the H luminosity for extinction, we have adopted the mean correction for Sbc spirals found by Kewley et al. (2002) based on measurements of the Balmer decrement (2.6). The formulae of Kennicutt (1998) (for the FIR and H) and Bressan, Silva, & Granato (2002) (for the radio) then yield the following values (assuming a solar abundance and a Salpeter initial mass function):555The FIR estimate assumes (Kewley et al. 2002). Although UGC 10043 adheres to the radio-far infrared flux correlation, the SFRs inferred from the two tracers differ, largely owing to uncertainties in the assumptions regarding the contributions of the thermal versus non-thermal component to the 20-cm flux (see Condon 1992; Bressan et al. 2002). (SFR)1.060.08 yr-1, (SFR)FIR=0.870.03 yr-1, and (SFR) yr-1. Here the uncertainties account for the flux measurement errors only. Interestingly, the H estimate value is nearly a factor of three lower than the other two. This discrepancy is larger than expected solely from the uncertainty in the correction for internal extinction, and would become even more significant if we applied extinction corrections appropriate for an Sd disk (see Kewley et al. 2002). This provides further indirect evidence for optically-obscured star formation in the nuclear regions of the galaxy.
The SFRs implied by the FIR and radio continuum fluxes are very typical of the globally averaged SFRs for Sbc spirals (e.g., Kewley et al. 2002), but are significantly lower than those that typify starburst galaxies with superwinds (e.g., Heckman et al. 1990; Lehnert & Heckman 1996). Nonetheless, as emphasized by Heckman (2001), the criterion for driving a large-scale wind depends far more critically on the SFR per unit area rather than on the globally averaged SFR. Heckman (2001) quotes a SFR per unit area of yr-1 kpc-2 as the rule-of-thumb for powering a superwind. Veilleux (2004) points out that this value is conservatively high, since the production of winds also depends on criteria such as the ages of the stellar energy source and the geometry of the ISM. Nonetheless, taking this as a characteristic value, we find that to reach this threshold in UGC 10043 requires that nearly all of the star formation must be concentrated in a relatively small region (, or 3.6 kpc) near the center of the galaxy. This size is comparable in extent to other star formation tracers, including 20-cm radio continuum, the brightest mid-ultraviolet emission, and the brightest H emission. This size scale also is consistent with the geometry of the wind, as a more extended disk or annulus containing vigorous star formation would tend to produce a thickened disk of ionized gas rather than an organized, biconical wind. As discussed by Elmegreen (1999), intense star formation within a bulge or nuclear disk may have an increased ability to produce disk blowout compared with star formation in other parts of the galaxy, since the higher gas velocity dispersions in these regions tend to decrease the self-regulation of the star formation.
7 Speculations on the Formation History of UGC 10043
Overall, the structural and kinematic complexities of UGC 10043, including its peculiar, vertically-elongated bulge and the presence of a large-scale wind, suggest a complex evolutionary history, most likely requiring a major “second event” (accretion, infall, and/or merging). While these types of processes are now believed to play a general role in galaxy formation, UGC 10043 appears to be part of a special group of disk+bulge systems (that includes the polar ring/disk galaxies and orthogonally-decoupled bulge galaxies) whose formation requires rather specific combinations of conditions (e.g., environment, merger geometry, impact velocity, gas cross-section, dark halo concentration) to account for both the production and maintenance of their current structures. As such, these galaxies uniquely preserve and showcase important clues to their formation histories. And since the parameter space for producing such systems is far more limited than in the more general case, studies of galaxies like these can help to lift some of the degeneracies in our understanding of how a variety of internal and external factors influence the present-day structures and compositions of galaxies. In this context, the unique properties of UGC 10043 make it a particularly important laboratory for testing various classes of evolutionary models. Drawing on relevant theoretical modelling and discussions from the literature, we now sketch some possible formation scenarios for UGC 10043. We outline the strengths and weaknesses of each scenario in hopes of motivating additional observations and numerical modelling to further test and refine these ideas.
7.0.1 Accretion of a Disk around a Naked Spheroid
There is no obvious mechanism by which a disk galaxy with a vertically-elongated bulge could form either by collapse of a single protogalactic cloud, or by secular evolution of an existing disk (e.g., through development of a bar instability). For these reasons, Bertola & Corsini (2002) have suggested that such galaxies are likely to represent cases where disks formed around pre-existing, naked spheroids (see also Binney & May 1996). In this picture, the decoupled, inner bulge cores seen in several such systems would be by-products of the disk-building event (see also Arnaboldi et al. 1993).
Although we do not yet know if it has a decoupled inner core, UGC 10043 offers an important constraint on this type of model, since its stellar disk is thinner, more regular, and more extended than the disks of any of the other spirals in which vertically elongated bulges have been identified (compare Figure 1 with the images in e.g., Sarzi et al. 2000; Reshetnikov et al. 2002). The small scale height of the UGC 10043 stellar disk and the relatively long characteristic dynamical time scales of its outer regions imply it is a dynamically old entity that has not undergone any dramatic heating or perturbations within at least the last few Gyrs (e.g., Reshetnikov & Combes 1997). This is also suggested by the observed vertical and radial color gradients, which are likely to arise from dynamical processes acting over a significant fraction of a Hubble time.
The idea of “dressing a naked spheroid” would seem to account nicely for certain properties of UGC 10043, including the apparent disjointedness of bulge and disk (Section 3), and the similarities of its bulge to an elliptical galaxy (Sections 3.2.1, 5.1.3). In most galaxies, disk-building is also expected to augment an existing bulge (e.g., Kormendy 1993) and may account for the observed bulge color gradient (Section 3.3.1), or perhaps even its triaxial nature. It can be considered a more extreme version of the mechanism believed responsible for the formation of dust lane ellipticals (e.g., Bertola 1987; Sage & Galletta 1993; Oosterloo et al. 2002). Indeed, this type of model has been invoked to explain the origin of the Centaurus A system (e.g., Malin, Quinn, & Graham 1983). However, in stark contrast with UGC 10043, the dusty, minor-axis disk of Centaurus A is dramatically warped and twisted, presumably the result of violent shearing and subsequent precession of the accreted disk (Sparke 1996).
A modified version of the above scenario would be the idea of disk growth around a spheroid having a smaller, pre-existing, gas-poor disk. Variations of this latter picture have been invoked as a means to account for the origin of NGC 5084 (Zeilinger et al. 1992; Carignan et al. 1997), NGC 4550 (Rix et al. 1992), and other examples of S0-like galaxies possessing gas and/or extended disks (Bertola, Buson, & Zeilinger 1992; Reshetnikov & Sotnikova 1997; Kannappan, Jansen, & Barton 2004).
Unfortunately, for the case of UGC 10043, this picture seems to be faced with some challenges. First, the material accreted onto either a naked spheroid or an S0-like galaxy would have to be predominantly gaseous, since any stellar constituent would be dissipationless and unable to cool into a thin layer. In addition, the gas would need to be located predominantly outside the stellar disk of the donor galaxy in order for it to be readily tidally stripped. Numerical simulations show that gas fractions of up to 40% may be readily accreted from a donor provided that the gas is sufficiently extended (Bournaud & Combes 2003). However, the neutral gas content of UGC 10043 () is typical of the gas contents of giant spiral galaxies; this implies that to produce a galaxy as gas-rich as UGC 10043 would require a rather gas-rich predecessor ( to provide for both the current ISM and stellar content), with a weak enough potential such that its gas could be readily stripped by a galaxy of UGC 10043’s mass (). The giant low surface brightness spirals might be a suitable class of donor, but these are relatively rare, at least in the local universe (e.g., Matthews et al. 2001 and references therein).
Another challenge for the accretion scenario is that numerical simulations show that only rings or annuli, not complete disks, are directly formed via accretion (e.g., Rix & Katz 1991; Reshetnikov & Sotnikova 1997; Bournaud & Combes 2003). Therefore subsequent perturbations and viscous evolution would be required to produce radial spreading into a bona fide disk. This process is expected to take a minimum of several orbital periods (i.e., at least several Gyr; Rix & Katz 1991)—although this is not necessarily problematic, given other dynamical arguments for an old age for the UGC 10043 disk. In addition, Rix & Katz (1991) have shown that as an accreted gas disk grows radially, it will also decrease in scale height as it transitions from a pressure-supported to a rotationally-supported regime. This may offer a natural explanation for the observed radial color gradients in UGC 10043. However, in order to produce the thin stellar disk observed in UGC 10043 would seem to demand that significant cooling of the gas disk took place before significant star formation ensued. In addition, in order to avoid strong twisting and differential precession over time, the accreted disk would likely need to be self-gravitating (Sparke 1986). Numerical checks on whether the expected timescales for these various processes could reproduce the observed UGC 10043 disk would be valuable.
An alternate version of the accretion picture is that the UGC 10043 disk was built from multiple dwarf galaxies or subgalactic clumps, much as in the standard hierarchical build-up paradigm for normal disk galaxies. This may offer a natural explanation for the large observed radial color gradient in UGC 10043 (see Section 3.3.1) as well as its tilted inner disk and outer warp (see Sections 3, 3.3.1). Nonetheless, the idea of hierarchical build-up has at least one serious drawback for the case of UGC 10043—namely, how to build such a thin disk without excessively heating it (e.g., Tóth & Ostriker 1992).
Some hope is offered by the recent numerical simulations of Huang & Carlberg (1997) and Valázquez & White (1999), which have shown that while a merging galaxy on a prograde orbit can cause substantial heating and damage to a disk, an interloper on a retrograde orbit will cause far less damage (owing to the weaker coupling between the infalling material and motion in the existing disk), and instead induce a coherent tilt. Heating effects are further lessened if the accreted satellites have small relative masses, and accretion primarily occurs onto the dark halo. However, the accretion of a number of dwarfs of subgalactic clumps would be needed to build a disk as massive as that of UGC 10043, and it is unlikely that every infall event would have occurred on a retrograde orbit or onto the halo. In addition, if the potentials of “naked spheroids” contain two preferred planes (one along the short and one along the long axis), and if this build-up mechanism were effective, we might expect vertically elongated bulges to be observed in a much more significant fraction of present-day Sb-Sc spirals.
7.0.2 Capture
A second possibility is effectively the inverse of the above accretion scenario—namely that the bulge of UGC 10043 may be a secondary structure, acquired well after the disk had formed and settled. The culprit might be a small, gas-poor elliptical galaxy plunging in at a very low impact velocity (less than a few tens of km s-1) along its pole. This is analogous to the mechanism proposed for the formation of collisional ring galaxies, including the bulge-dominated collisional ring galaxies known as Hoag-type objects (Appleton & Struck-Marcell 1996 and references therein).
Interestingly, numerous pure disk (Sd) galaxies with properties nearly identical to the disk of UGC 10043 are known, and many examples can be found in the Flat Galaxy Catalogue of Karachentsev, Karachentseva, & Parnovsky (1993). One example is UGC 825 (Matthews & van Driel 2000; see their Figure 7). UGC 825 is strikingly similar to the UGC 10043 disk not only morphologically (having a “needle-like” disk with a dusty center), but also in terms of surface brightness, luminosity, linear size, rotational velocity, and H i content. Small, compact ellipticals with luminosities similar to the UGC 10043 bulge are also known, although these seem to be relatively rare in the local universe (e.g., Wirth & Gallagher 1984; Nieto & Prugniel 1987).
That a pure disk galaxy might be able to “capture” a bulge has the qualitative appeal of accounting for the appearance of UGC 10043 as a disk galaxy whose bulge has been “inserted” post factum (Figure 5); it could also simultaneously account for several of the unusual properties of the bulge (large vertical extent relative to the disk, triaxial shape, lack of evidence for significant rotation) that imply it could not have formed secularly. Nonetheless, it remains highly questionable whether this process could work at all in practice, as it would seem to require an extraordinary set of circumstances, including a gas-rich disk and a small, compact elliptical present in the same region of space, both on suitable orbits, and possessing an extremely low relative velocity, rarely observed in real galaxy groups. Initially, the victimized disk would be expected to develop a bowl-like shape and ring structures in the stars and gas—neither of which is evident in UGC 10043—although for a collision of roughly equal-mass galaxies, these signatures are expected to diminish significantly after years. (Gerber, Lamb, & Balsara 1996).
Since the bulge and disk of UGC 10043 share the same radial systemic velocity, one further requirement for a “capture” scenario is that the bulge cannot simply be caught in the act of “passing through”. However, Appleton & Struck-Marcell (1996) propose that an intruder might be strongly decelerated via dynamical friction from a massive halo in the target galaxy. Very thin disks such as UGC 825 are expected to possess massive dark matter halos (e.g., Zasov, Makarov, & Mikhailova 1991; Gerritsen & de Blok 1999), although numerical simulations are needed to test whether they could supply sufficient dynamical friction to effectively halt an intruder.
7.0.3 Origin via a Major Merger
Finally, let us consider the possibility that both the bulge and disk of UGC 10043 formed through a single event involving the merger of two moderate mass disk galaxies. This model has been explored by Bekki (1998) as a means of accounting for the origin of polar ring galaxies whose rings are too massive, too gas-rich, and too radially extensive to be readily explained via mass transfer or capture of a dwarf satellite (see also Iodice et al. 2002; Bournaud & Combes 2003). In this picture, a gas-rich “intruder” plummets through its “victim”, leading to the formation of a central S0-like component, a stellar halo, and an orthogonally rotating ring or annulus of gas and stars via a combination of violent relaxation and dissipative processes. To produce a large (10 kpc) disk also requires the victim to be a gas-rich system (Bournaud & Combes 2003).
At least qualitatively, this scenario appears able to account for certain characteristics of UGC 10043. First, this type of event is expected to drive gas to small radii, where it could trigger a nuclear starburst. In addition, it offers a way of accounting for some of the unusual properties of the bulge (vertically elongated isophotes; lack of evidence for major axis rotation). Through dissipative cooling, it also may be able to produce a gaseous structure with very small scale height. Unfortunately, like the scenarios described above, this one too seems to meet with some shortfalls and the uncomfortable requirement of rather specialized initial conditions. As discussed by Bournaud & Combes (2003), to produce a very massive polar disk requires that the victim itself be a very massive, gas-rich disk (with roughly twice that of the resultant system) and quite stellar-poor, so as to not produce an observable stellar halo. Thus the victim would need to be something resembling a giant low surface brightness galaxy. An additional constraint is similar to that cited for the “capture” scenario—namely that to form a disk rather than a ring, the impact speed of the intruder would need to be less than 30-40 km s-1—a rare condition in typical galaxy groups. Neither of these conditions rules out the merger picture, but it does imply that galaxies like UGC 10043 should be quite rare. Another concern is whether such a violent event could reproduce the complex, triaxial bulge structure of UGC 10043 and the significant color differences between bulge and disk. Once again, numerical work is needed to further explore this possibility.
7.1 Origin of the Enhanced Nuclear Star Formation and Galactic Wind
Independent of the details of how UGC 10043 was assembled, another question surrounding this galaxy concerns how it has evolved since formation, and what has led to the production of its large-scale wind and centrally-concentrated star formation. Although most of the types of formation mechanisms described above are predicted to drive gas to the inner regions of the galaxy (e.g., Reshetnikov & Sotnikova 1997; Bournaud & Combes 2003), the gas consumption rate required to feed the wind of UGC 10043 ( yr-1 within the inner few kpc of the galaxy) suggests that the wind is likely to be a transient and recently-triggered phenomenon. Since the dynamically settled appearance of the disk of UGC 10043 suggests it is a relatively old structure, it is therefore not clear that the event that formed the UGC 10043 system is the same one that instigated the current nuclear star formation and wind.
One possible solution to this puzzle may be the mechanism proposed by Wakamatsu (1993). Wakamatsu suggested that if the central component of a polar ring galaxy is sufficiently dense, its oval potential will severely disturb the orbits of the gas at small and intermediate galactocentric radii in the disk, leading to the production of shock waves. He argues that repeated shock waves occurring as the disk rotates would cause loss of orbital energy and angular momentum, and in turn drive gas to the nuclear regions of the galaxy, much in the same manner as an inner bar. While we have shown that UGC 10043 is not a true polar ring (or polar disk) galaxy, its vertically-elongated bulge may nonetheless present a potential similar to the one envisioned by Wakamatsu (1993). Moreover, to match observations of polar ring galaxies such as NGC 4650A, Wakamatsu assumes that the polar “ring” in his model galaxies is actually a disk-like entity, making the overall situation seemingly rather analogous to the UGC 10043 system. Qualitatively his scenario seems to predict certain key traits of UGC 10043: its wind, its dusty inner disk, and possibly the formation of a distinct inner bulge core, although quantitatively the agreement is less good. Typical boundary radii for the shock regions estimated by Wakamatsu are , where is the exponential scale length of the S0 disk (or bulge, in our case). For UGC 10043, exponential fits to the outer bulge isophotes yield 1 kpc, suggesting the shock boundary will extend to roughly 4 kpc. The radial extent of the nuclear star-forming region in UGC 10043 was inferred to be 2 kpc (Section 6), corresponding rather closely with the observed edge of the bulge, but roughly a factor of two smaller than predicted by Wakamatsu’s model. Nonetheless, further investigation of this type of model via numerical modelling would be of interest for exploring the inner gas dynamics of UGC 10043 and other related galaxies.
Another galaxy that may provide a test of link between Wakamatsu’s scenario and the formation of galactic winds is the polar ring galaxy NGC 660 (Alton et al. 2000). NGC 660 is classified as a “superwind” galaxy, and it is also a relatively rare example of a polar ring-like structure surrounding a gas-rich disk galaxy, rather than an early type host, making it a likely environment for the production of shocks. In addition, the morphology of the superwind galaxy NGC 1482 (Veilleux & Rupke 2002) suggests it too may be a related object. To our knowledge, no kinematic or structural decoupling has yet been identified in NGC 1482, but inspection of DSS images reveals hints of a ring or extended disk misaligned with the dust lane of this galaxy. Overall it would seem that the search for galactic wind signatures in other polar ring galaxies or early-type spirals with kinematically decoupled cores and gas-rich disks may yield important clues to the origin of both phenomena.
Finally, we note that if the inner polar ring structure described in Section 3.2.2 is real, its origin is likely to require an additional event independent of the formation of the main galaxy. This would most likely have involved the accretion of a low-mass, gas-rich satellite, and thus serves as another possible source for triggering the nuclear star formation and wind in UGC 10043. For an orbiting inner ring, collisions between gas clouds within the ring and gaseous material in the disk are expected to produce compression to drive molecular gas formation and therefore drive star formation (e.g., Tenorio-Tagle 1981; Galletta 1991). Hot (shock-heated) gas may also be produced in this process (Galletta 1991).
8 Summary
We have presented new, photometrically-calibrated optical imaging (, , and H) and two-dimensional integral field spectroscopy of the unusual edge-on spiral galaxy UGC 10043. The spectroscopy included measurements of both the stellar Ca ii infrared triplet and the H and [N ii] emission lines from the ionized gas. Although UGC 10043 has been previously classified as Hubble type Sbc, our observations have revealed a number of structural and kinematic complexities in UGC 10043 that set it apart from prototypical Sbc spirals.
A non-parametric photometric decomposition of the bulge of UGC 10043 reveals evidence that it is triaxial. Its inner isophotes are prolate (elongated perpendicular to the disk), while the outer isophotes twist to become oblate and nearly circular. The vertical elongation and disky isophote shape of the inner bulge region implies that its triaxiality cannot be readily explained by the presence of a bar. Measurements of the bulge kinematics directly along the midplane () are hindered by dust absorption and contamination from disk light; however at modest distances from the plane (), no evidence for systematic rotation is observed in the stellar Ca ii lines, implying the UGC 10043 bulge is slowly rotating, if at all, along the direction of the disk rotation. The UGC 10043 bulge thus appears more similar to an elliptical galaxy than a typical bulge when placed on the - relation.
One hemisphere of the inner bulge of UGC 10043 is girdled by a narrow dust lane running along the direction of the minor axis. Unsharp masking has provided tentative evidence that this feature may form part of an inner polar ring structure roughly 2.5 kpc in diameter. The presence of vertically-elongated inner bulge isophotes, encircled by this dust lane suggests a component with misaligned angular momentum in this galaxy. However, spectroscopically, we have found no compelling evidence for orthogonal rotation, either in the stellar component or in the ionized gas on scales of . Hence in spite of exhibiting certain morphological similarities to polar ring and polar disk galaxies, UGC 10043 is not a kinematically-confirmed member of this class. Structurally, UGC 10043 appears to be closely related to the recently-discovered class of spiral galaxies with “orthogonally decoupled bulges” (Bertola et al. 1999; Sarzi et al. 2000; Corsini et al. 2003). A hallmark of such galaxies is the presence of a compact, orthogonally-rotating inner bulge core; however, owing to the limited spatial resolution of our current spectra, coupled with heavy dust extinction at small radii, we were unable to establish whether the UGC 10043 bulge may contain an analogous compact (), kinematically-decoupled core. So far, minor axis dust lanes have not been reported in other orthogonally-decoupled bulge systems, and the link between this structure, a possible decoupled inner core, and the overall formation history of the bulge is unclear. One possibility is that the minor axis dust lane formed from the recent accretion of a dwarf satellite and therefore has an origin completely independent of the overall bulge structure. Additional, high spatial resolution spectroscopy is needed to shed further insight onto the above issue. Unfortunately these observations are likely to be challenging due to the strong dust attenuation along the midplane, the requirement for both high spatial and spectral resolution, and the faintness of the possible inner polar structure.
The stellar disk of UGC 10043 also exhibits several interesting properties. It is unusually thin for a galaxy of its Hubble type, with an exponential scale height 395 pc. It also has a low optical surface brightness, and we estimate a deprojected central surface brightness 23.2 mag arcsec-2. While the inner disk regions of UGC 10043 appear to be extremely dusty, dust in the outer disk appears to be sparse and patchy, and dust attenuation alone cannot explain the faint appearance of the disk. The dusty, inner portion of the UGC 10043 disk appears tilted by relative to the outer disk regions. In addition, the outer stellar disk shows a deviation from planarity in the form of a weak, integral sign warp.
Although H, radio continuum, and far-infrared observations all imply a rather low global star formation rate in UGC 10043 ( yr-1), we have uncovered both photometric and spectroscopic evidence for a large-scale galactic wind in this galaxy. Narrow-band H+[N ii] imaging reveals a biconical distribution of ionized gas extending to 3.5 kpc from the plane. The [N ii] emission lines at most locations in the galaxy resolve into at least two distinct velocity components, with a typical separation of 70-80 km s-1. The component closer to the systemic velocity can be ascribed to material following the disk rotation, while the higher-velocity component appears to arise from gas outflowing along the surfaces of the biconical structure. The H line profiles also show line splitting consistent with the wind model, but in many cases, also show hints of an additional velocity component close to the systemic velocity whose origin is unclear. We estimate an outflow speed for the UGC 10043 wind of 104 km s-1. This value is significantly smaller than the outflow speeds of typical “superwind” galaxies, and suggests the wind is powered by a rather weak central starburst, confined to the inner 2 kpc of the galaxy. Consistent with other disk galaxies with large-scale winds, we measure a systematic increase in the [N ii]/H ratio as a function of distance from the midplane in UGC 10043, with values reaching as large as 1.7. Shock-heating may be required to explain these line ratios, although additional line diagnostics and modelling will be needed to evaluate their importance compared with photoionization.
The structural and kinematic properties of UGC 10043 seem to be most readily explained by a formation history involving a “second event” which occurred at least a few Gyr ago. We have discussed three possible formation mechanisms for UGC 10043, respectively involving a major accretion event, a capture, or a major merger. Qualitatively, each scenario seems able to produce certain features of the UGC 10043 system. However, each model also appears to have serious shortcomings, and accounting for the thin, gas-rich disk and peculiar bulge structure of UGC 10043 poses significant challenges. Further, multi-wavelength observations of UGC 10043 together with detailed numerical modelling are sorely needed in order to supply further constraints on the evolutionary history of this interesting galaxy.
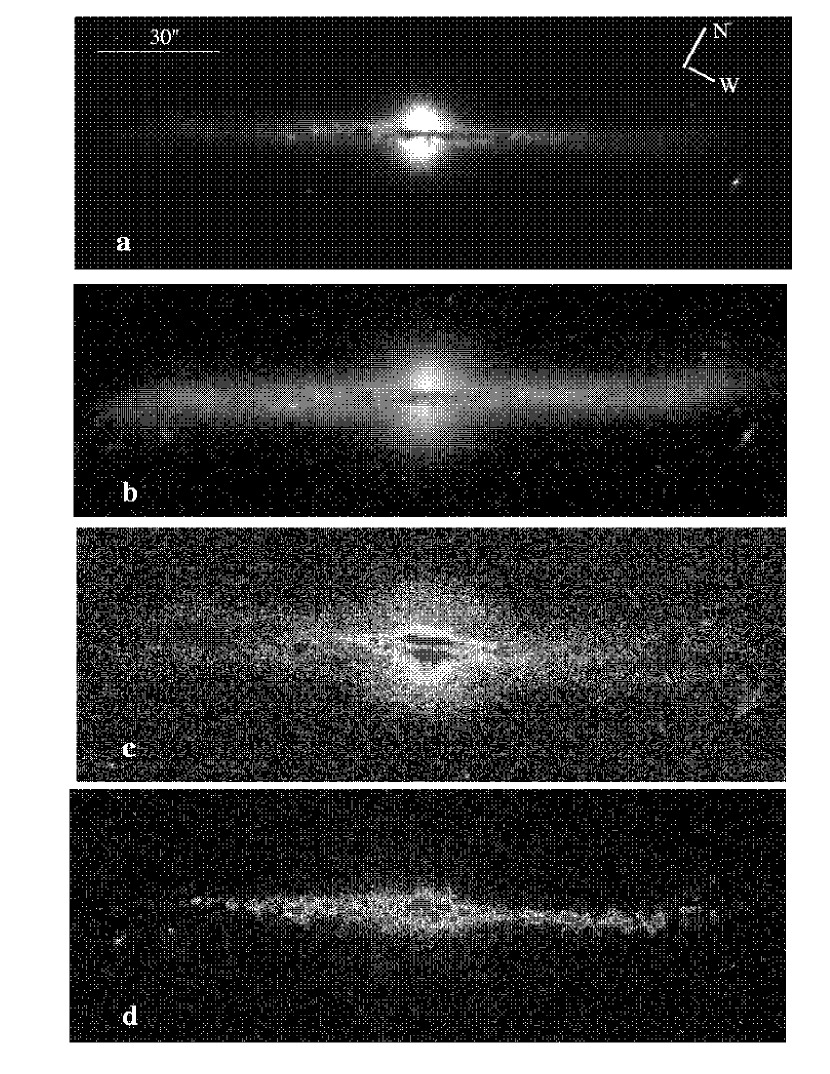
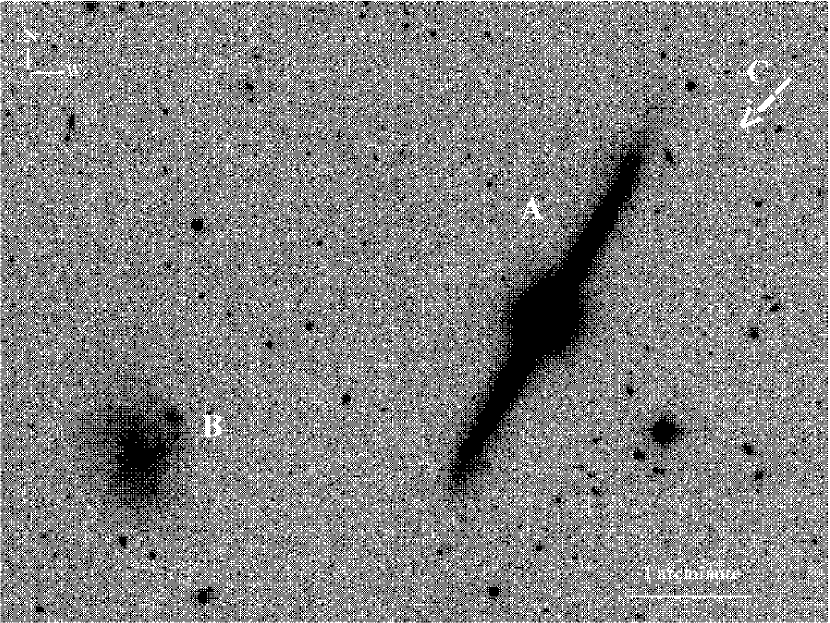
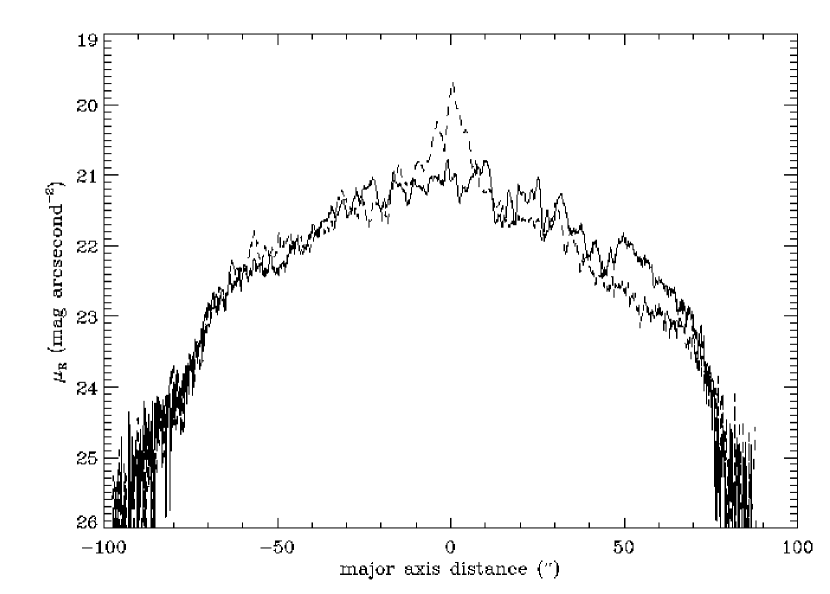

References
- (1) Alton, P.B., Stockdale, D. P., Scarrott, S. M., & Wolstencroft, R. D. 2000, A&A, 357, 443
- (2) Appleton, P. N. & Struck-Marcell, C. 1996, Fund. Cosmic Phys., 16, 111
- (3) Arnaboldi, M., Capaccioli, M., Cappellaro, E., Held, E. V., & Sparke, L. 1993, A&A, 267, 21
- (4) Arnaboldi, M., Capaccioli, M., & Combes, F. 1994, in The First Stromlo Symposium: The Physics of Active Galaxies, ASP Conf. Series, Vol. 54, ed. G. V. Bicknell, M. A. Dopita, and P. J. Quinn, (ASP: San Francisco), 437
- (5) Balcells, M. & Peletier, R. F. 1994, AJ, 107, 135
- (6) Barden, S. C., Sawyer, D. G., & Honeycutt, R. K. 1998, in Optical Astronomical Instrumentation, ed. S. D’Odorico, Proc. SPIE 3355, 892
- (7) Bekki, K. 1998, ApJ, 499, 635
- (8) Bell, E. F. 2002, ApJ, 581, 1013
- (9) Bender, R., Döbereiner, S., & Möllenhoff, C. 1988, A&AS, 74, 385
- (10) Bertola, F. 1987, in Structure and Dynamics of Elliptical Galaxies, IAU Symposium 127, ed. P. T. de Zeeuw (Dordrecht: Reidel), 135
- (11) Bertola, F., Buson, L. M., & Zeilinger, W. W. 1992, ApJ, 401, L79
- (12) Bertola, F. & Corsini, E. M. 2000, in Dynamics of Disk Galaxies: from the Early Universe to the Present, ASP Conf. Series, Vol. 197, ed. F. Combes, G. A. Mamon, and V. Charmandaris, (ASP: San Francisco), 115
- (13) Bertola, F., Corsini, E. M., Vega Beltrán, J. C., Pizzella, A., Sarzi, M., Cappellari, M., & Funes, J. G. S.J. 1999, ApJ, L127
- (14) Bertola, F., Vietri, M., & Zeilinger, W. W. 1991, ApJ, 374, L13
- (15) Bettoni, D. & Galletta, G. 1991, in Dynamics of Disc Galaxies, ed. B. Sundelius, (Chalmers University: Göteborg), 317
- (16) Binney, J. & May, A. 1986, MNRAS, 218, 743
- (17) Biretta, J. A. et al. 2000, WFPC2 Instrument Handbook, Version 5.0 (Baltimore: STScI)
- (18) Bizyaev, D. & Mitronova, S. 2002, A&A, 389, 795
- (19) Bland-Hawthorn, J. & Cohen, M. 2003, ApJ, 582, 246
- (20) Bland-Hawthorn, J., Freeman, K. C., & Quinn, P. J. 1997, ApJ, 490, 143
- (21) Bournaud, F. & Combes, F. 2003, A&A, 401, 817
- (22) Bressan, A., Silva, L., & Granato, G. L. 2002, A&A, 392, 377
- (23) Bruzual, G. & Charlot, S. 2003, MNRAS, 344, 1000
- (24) Caldwell, N. & Rose, J. A. 1997, AJ, 113, 492
- (25) Carignan, C., Côté, S., Freeman, K. C., & Quinn, P. J. 1997, AJ, 113, 1585
- (26) Chen, B. et al. 2001, ApJ, 553, 184
- (27) Chevalier, R. A. & Clegg, A. W. 1985, Nature, 317, 44
- (28) Combes, F., Debbasch, R., Friedli, D., & Pfenniger, D. 1990, A&A, 233, 82
- (29) Condon, J. J. 1992, ARA&A, 30, 575
- (30) Condon, J. J., Cotton, W. D., Greisen, E. W., Yin, Q. F., Perley, R. A., Taylor, G. B., & Broderick, J. J. 1998, AJ, 115, 1693
- (31) Corsini, E. M., Pizzella, A., & Bertola, F. 2002, A&A, 382, 488
- (32) Corsini, E. M., Pizzella, A., Coccato, L., & Bertola, F. 2003, A&A, 408, 873
- (33) Dalcanton, J. J. & Bernstein, R. A. 2002, AJ, 124, 1328
- (34) Davies, R. L., Efstathiou, G., Fall, S. M., Illingworth, G., & Schechter, P. L. 1983, ApJ, 266, 41
- (35) Debattista, V. P. & Sellwood, J. A. 1999, ApJ, 513, L107
- (36) de Grijs, R. 1998, MNRAS, 299, 595
- (37) de Grijs, R. & Peletier, R. F. 2000, MNRAS, 313, 800
- (38) de Grijs, R., Peletier, R. F., & van der Kruit, P. C. 1997, A&A, 327, 966
- (39) de Grijs, R. & van der Kruit, P. C. 1996, A&AS, 117, 19
- (40) de Jong, R. S. 1996a, 313, 45
- (41) de Jong, R. S. 1996b, A&A, 313, 377
- (42) de Vaucouleurs, G., de Vaucouleurs, A., Corwin, J. G. Jr., Buta, R. J., Paturel, G., & Fouqué, P. 1991, Third Reference Catalogue of Bright Galaxies, Ver. 3.9, (New York: Springer-Verlag)
- (43) Eckart, A. & Downes, D. 2001, ApJ, 551, 730
- (44) Elmegreen, B. G. 1999, ApJ, 517, 103
- (45) Erwin, P. & Sparke, L. S. 2003, ApJS, 146, 299
- (46) Firmani, C., Hernandez, X., & Gallagher, J. 1996, A&A, 308, 403
- (47) Freeman, K. & Bland-Hawthorn, J. 2002, ARA&A, 40, 487
- (48) Freudling, W., Haynes, M. P., & Giovanelli, R. 1988, AJ, 96, 1791
- (49) Gallagher, J. S., Sparke, L. S., Matthews, L. D., Frattare, L. M., English, J., Kenny, A. L., Iodice, E., & Arnaboldi, M. 2002, ApJ, 568, 199
- (50) Galletta, G. 1991, in Warped Disks and Inclined Rings around Galaxies, ed. S. Casertano, P. Sackett, and F. Briggs, (Cambridge: Cambridge University Press), 207
- (51) García-Ruiz, I., Sancisi, R., & Kuijken, K. 2002, A&A, 394, 769
- (52) Gerber, R. A., Lamb, S. A., & Balsara, D. S. 1996, MNRAS, 278, 345
- (53) Gerritsen, J. P. E. & de Blok, W. J. G. 1999, A&A, 342, 655
- (54) Giovanelli, R., Avera, E., & Karachentsev, I. D. 1997, AJ, 114, 122
- (55) Hawarden, T. G., Elson, R. A. W., Longmore, A. J., Tritton, S. B., & Corwin, H. G. Jr. 1981, MNRAS, 196, 747
- (56) Heckman, T. M. 2001, in Gas and Galaxy Evolution, ASP Conference Series, Vol. 240, ed. J. E. Hibbard, M. P. Rupen, and J. H. van Gorkom, (ASP: San Francisco), 345
- (57) Heckman, T. M., Lehnert, M. D., Strickland, D. K., & Armus, L. 2000, ApJS, 129, 493
- (58) Heckman, T. M., Armus, L., & Miley, G. K. 1990, ApJS, 74, 833
- (59) Helou, G., Khan, I. R., Malek, L. & Boehmer, L. 1988, ApJS, 68, 151
- (60) Howk, J. C. & Savage, B. D. 1999, AJ, 117, 2077
- (61) Huang, S. & Carlberg, R. G. 1997, ApJ, 480, 503
- (62) Hummel, E., Beck, R., & Dettmar, R.-J. 1991, A&AS, 87, 309
- (63) Iodice, E., Arnaboldi, M., De Lucia, G., Gallagher, J. S. III, Sparke, L. S., & Freeman, K. C. 2002, AJ, 123, 195
- (64) Jergen, J., Binggeli, B., & Freeman, K. C. 2000, AJ, 119, 593
- (65) Just, A., Fuchs, B., & Wielen, R. 1996, A&A, 309, 715
- (66) Kannappan, S. J., Jansen, R. A., & Barton, E. J. 2004, AJ, 127, 1371
- (67) Karachentsev, I. D., Karachentseva, V. E., Parnovsky, S. L. 1993, Astron. Nachr., 314, 97
- (68) Karataeva, G. M., Yakovleva, V. A., Hagen-Thorn, V. A., & Mikolaichuk, O. V. 2001, Ast. Let., 27, 74
- (69) Kennicutt, R. C. 1998, ARA&A, 36, 189
- (70) Kewley, L. J., Geller, M. J., Jansen, R. A., & Dopita, M. A. 2002, AJ, 124, 3135
- (71) Kormendy, J. 1993, in Galactic Bulges, IAU Symp. 153, ed. H. Dejonghe and H. J. Habing (Dordrecht: Kluwer), 209
- (72) Kormendy, J. & Illingworth, G. 1982, ApJ, 256, 460
- (73) Kormendy, J. & Illingworth, G. 1983, ApJ, 265, 632
- (74) Kurucz, R. L. 2003, http://kurucz.harvard.edu/stars.html
- (75) Landolt, A. U. 1992, AJ, 104, 340
- (76) Lehnert, M. D. & Heckman, T. M. 1996, ApJ, 462, 651
- (77) Lewis, B. M., Helou, G., & Salpeter, E. E. 1985, ApJS, 59, 161
- (78) Liszt, H. S. & Burton, W. B. 1980, ApJ, 236, 779
- (79) Malin, D. F., Quinn, P. J., & Graham, J. A. 1983, ApJ, 272, L5
- (80) Martin, C. L. 1998, ApJ, 506, 222
- (81) Matthews, L. D. 2000, AJ, 120, 1764
- (82) Matthews, L. D. & Gallagher, J. S. III. 1997, AJ, 114, 1899
- (83) Matthews, L. D. & van Driel, W. 2000, A&AS, 143, 421
- (84) Matthews, L. D., van Driel, W., & Monnier Ragaigne, D. 2001, A&A, 365, 1
- (85) Matthews, L. D. & Wood, K. 2001, ApJ, 548, 150
- (86) Merrifield, M. R. 1996, in Barred Galaixes, IAU Colloquium 157, ASP Conf. Series, Vol, 91, ed. R. Buta, D. A. Crocker, and B. G. Elmegreen, (San Francisco: ASP), 179
- (87) Mihalas, D. & Binney, J. 1981, Galactic Astronomy, (New York: W. H. Freeman and Company)
- (88) Miller, S. T. & Veilleux, S. 2003, ApJ, 592, 79
- (89) Moriondo, G., Giovanardi, C., & Hunt, L. K. 1998, A&AS, 130, 81
- (90) Nieto, J.-L. & Prugniel, P. 1987, A&A, 186, 30
- (91) Oosterloo, T. A., Morganti, R., Sadler, E. M., Vergani, D., & Caldwell, N. 2002, AJ, 123, 729
- (92) Osterbrock, D. E., Fulbright, J. P., & Bida, T. A. 1997, PASP, 109, 614
- (93) Ostriker, E. C. & Binney, J. J. 1989, MNRAS, 237, 785
- (94) Otte, B., Reynolds, R. J., & Gallagher, J. S. III. 2001, ApJ, 560, 207
- (95) Pohlen, M. 2001, PhD Thesis, Ruhr-Universität Bochum
- (96) Pohlen, M., Dettmar, R.-J., Lütticke, R., & Schwarzkopf, U. 2000, A&AS, 144, 405
- (97) Pitesky, J. 1991, in Warped Disks and Inclined Rings around Galaxies, ed. S. Casertano, P. Sackett, and F. Briggs, (Cambridge: Cambridge University Press), 215
- (98) Pizzella, A., Corsini, E. M., Morelli, L., Sarzi, M., Scarlata, C., Stiavelli, M., & Bertola, F. 2002, ApJ, 573, 131
- (99) Rand, R. J. 1998, ApJ, 501, 137
- (100) Reshetnikov, V. & Combes, F. 1997, A&A, 324, 80
- (101) Reshetnikov, V. & Combes, F. 1998, A&AS, 138, 101
- (102) Reshetnikov, V. P., Fáundez-Abans, M., & de Oliveira-Abans, M. 2002, A&A, 383, 390
- (103) Reshetnikov, V. P., Hagen-Thorn, V. A., & Yakovleva, V. A. 1995, A&A, 303, 398
- (104) Reshetnikov, V. & Sotnikova, N. 1997, A&A, 325, 933
- (105) Rix, H.-W., Franx, M., Fisher, D., & Illingworth, G. 1992, ApJ, 400, L5
- (106) Rix, H.-W. & Katz, N. 1991, in Warped Disks and Inclined Rings around Galaxies, ed. S. Casertano, P. Sackett, and F. Briggs, (Cambridge: Cambridge University Press), 112
- (107) Roberts, M. S. & Haynes, M. P. 1994, ARA&A, 32, 115
- (108) Sackett, P. D. & Sparke, L. S. 1990, ApJ, 361, 408
- (109) Sage, L. J. & Galletta, G. 1993, ApJ, 419, 544
- (110) Sandage, A. & Bedke, J. 1994, The Carnegie Atlas of Galaxies, (Washington: Carnegie Institution of Washington)
- (111) Sanders, D. B., Solomon, P. M., & Scoville, N. Z. 1984, 276, 182
- (112) Sarzi, M., Corsini, E. M., Pizzella, A., Vega Beltrán, J. C., Cappellari, M., Funes, J. G. S. J., & Bertola, F. 2000, A&A, 360, 439
- (113) Schlegel, D. J., Finkbeiner, D. P., & Davis, M. 1998, ApJ, 500, 525
- (114) Schweizer, F., Whimore, B. C., & Rubin, V. C. 1983, AJ, 88, 909
- (115) Siegel, M. H., Majewski, S. R., Reid, I. N., & Thompson, I. B. 2002, ApJ, 578, 151
- (116) Sil’chenko, O. K. 2002, Ast. Let., 28, 207
- (117) Sparke, L. S. 1986, MNRAS, 219, 657
- (118) Sparke, L. S. 1996, ApJ, 473, 810
- (119) Sparke, L. S. 2002, in Disks of Galaxies: Kinematics, Dynamics, and Perturbations, ASP Conf. Series, Vol. 275, ed. E. Athanassoula, A. Bosma, and R. Mujica (ASP: San Francisco), 367
- (120) Suchkov, A. A., Balsara, D. S., Heckman, T. M., & Leitherner, C. 1994, ApJ, 430, 511
- (121) Tenorio-Tagle, G. 1981, A&A, 94, 338
- (122) Terlevich, E., Díaz, A. I., Terlevich, R., González-Delgado, R. M., Pérez, E., & García Vargas, M. L. 1996, MNRAS, 279, 1219
- (123) Tohline, J. E., Simonson, G. F., & Caldwell, N. 1982, ApJ, 252, 92
- (124) Tonry, J. & Davis, M. 1979, AJ, 84, 1511
- (125) Tóth, G. & Ostriker, J. P. 1992, ApJ, 389, 5
- (126) Tully, R. B., Pierce, M. J., Huang, J.-S., Saunders, W., Verheijen, M. A. W., & Witchalls, P. L. 1998, AJ, 115, 2264
- (127) Tully, R. B. & Verheijen, M. A. W. 1997, ApJ, 484, 145
- (128) Veilluex, S. 2004, in Recycling Intergalactic and Interstellar Matter, IAU Symp. Series, Vol. 217, ed. P.-A. Duc, J. Braine, and E. Brinks, in press (astro-ph/0310585)
- (129) Veilleux, S. & Rupke, D. S. 2002, ApJ, 565, 63
- (130) Velázquez, H. & White, S. D. M. 1999, MNRAS, 304, 254
- (131) Wainscoat, R. J., Freeman, K. C., & Hyland, A. R. 1989, ApJ, 337, 163
- (132) Wakamatsu, K.-I. 1993, AJ, 105, 1745
- (133) Whitmore, B. C., Lucas, R. A., McElroy, D. B., Steiman-Cameron, T. Y., Sackett, P. D., & Olling, R. P. 1990, AJ, 100, 1489
- (134) Whitmore, B. C., McElroy, D. B., & Schweizer, F. 1987, ApJ, 314, 439
- (135) Windhorst, R. A., Taylor, V. A., Jansen, R. A., Odewahn, S. C., Chiarenza, C. A. T., Conselice, C. J., de Grijs, R., de Jong, R. S., MacKenty, J. W., Eskridge, P. B., Frogel, J. A., Gallagher, J. S. III, Hibbard, J. E., Matthews, L. D., & O’Connell, R. W. 2002, ApJS, 143, 113
- (136) Wirth, A. & Gallagher, J. S. III. 1984, ApJ, 282, 85
- (137) Wood, K. & Mathis, J. S. 2004, MNRAS, in press
- (138) Zasov, A. V., Makarov, D. I., & Mikhailova, E. A. 1991, Sov. Astron. Let. 17, 374
- (139) Zeilinger, W. W., Galletta, G., & Madsen, C. 1990, MNRAS, 246, 324
- (140)
| Ref. | ||
|---|---|---|
| (J2000.0): | 15 48 41.2 | 1 |
| (J2000.0): | +21 52 09.8 | 1 |
| Hubble type: | Sbc | 1 |
| : | 0.247 mag | 2 |
| Distance:a | 33.4 Mpc | 3 |
| Measured Quantities | ||
| 4 | ||
| PA | 4 | |
| 4 | ||
| b | 4 | |
| c | 5 | |
| d | 6 | |
| e | 14.73 | 4 |
| e | 13.45 | 4 |
| e | 1.280.12 | 4 |
| e | 10.390.03 | 1 |
| e | 1.32 | 1 |
| 215510 km s-1 | 4 | |
| 21575 km s-1 | 4 | |
| 21616 km s-1 | 4 | |
| Derived Quantities | ||
| g | 4 | |
| g | 4 | |
| g | 4 | |
| h | 4 | |
| g | 4 | |
| B/D | 0.3 | 4 |
| i | 21.2 mag arcsec-2 | 4 |
| j | 23.2 mag arcsec-2 | 4 |
| 27.2 kpc | 4 | |
| k | erg s-1 | 4 |
| Radio and Infrared Properties | ||
| 21611 km s-1 | 7 | |
| 3416 km s-1 | 8 | |
| 3182 km s-1 | 7 | |
| l | 160 km s-1 | 4 |
| m | 4 | |
| 22.29 Jy km s-1 | 7 | |
| 5.9 | 7 | |
| 0.66 | 4,7 | |
| (6-cm) | 4.50.1 mJy | 9 |
| (20-cm) | 10.60.9 mJy | 10 |
| 0.34 | 1 | |
| FIRl | W m-2 | 1,4 |
| m | 2.8 | 1,4 |
Note. — Units of right ascension are hours, minutes, and seconds, and units of declination are degrees, arcminutes, and arcseconds.
References. — (1) NED database; (2) Schlegel et al. 1998; (3) LEDA database; (4) this work; (5) Pohlen 2001; (6) de Grijs & van der Kruit 1996; (7) Giovanelli et al. 1997; (8) Lewis et al. 1985; (9) Hummel et al. 1991 (10) Condon et al. 1998.
| Filter or Color | ||||
|---|---|---|---|---|
| -0.462 | 0.238 | 0.037 | 0.030 | |
| -0.134 | 0.117 | 0.000 | 0.013 | |
| -0.316 | 0.161 | 0.029 | 0.020 |
Note. — A total of 18 standard stars were observed in both and . is the RMS dispersion in the fit to the equation: where is the zero point, is the extinction coefficient, is the color term, is the instrumental color, and is the airmass.