GRB 020410: A Gamma-Ray Burst Afterglow Discovered by its Supernova Light11affiliation: Based on observations made with the NASA/ESA Hubble Space Telescope, obtained at the Space Telescope Science Institute, which is operated by the Association of Universities for Research in Astronomy, Inc., under NASA contract NAS 5-26555. These observations are associated with programs 9074 and 9405.Based partly on observations obtained at the European Southern Observatory (ESO) under programme 165.H-0464
Abstract
We present the discovery and monitoring of the optical transient (OT) associated with GRB 020410. The fading OT was found by Hubble Space Telescope (HST) observations taken 28 and 65 days after burst at a position consistent with the X-ray afterglow. Subsequent re-examination of early ground based observations revealed that a faint OT was present 6 hours after burst, confirming the source association with GRB 020410. A deep non-detection after one week requires that the OT re-brightened between day 7 and day 28, and further late time HST data taken approximately 100 days after burst imply that it is very red (. We compare both the flux and color of the excess with supernova models and show that the data are best explained by the presence of a Type Ib/c supernova at a redshift , which occured roughly coincident with the day of GRB.
1 Introduction
The discovery in 1997 of multi-wavelength counterparts to gamma-ray bursts (GRBs) (van Paradijs et al., 1997; Costa et al., 1997; Bremer et al., 1998; Frail et al., 1997) has led to exceptionally rapid development in the field. Evidence has accumulated that at least the GRBs with durations longer than about two seconds (Kouveliotou et al., 1993) are associated with the collapse of massive stars. These events are often called collapsars (Woosley, 1993; Woosley & MacFadyen, 1999).
The apparent association of GRB 980425 with the luminous Type Ic supernovae 1998bw (Galama et al., 1998) at provided the first observational evidence of a link between GRBs and supernovae. However GRB 980425 was a very unusual event. No apparent optical afterglow was discovered after the burst; instead, the rising supernova lightcurve was seen. The -ray luminosity was substantially lower than that inferred for many GRBs: the total burst energy was only ergs (if the emission is assumed to be isotropic) compared with isotropic energy releases for “classical” GRBs of 10 ergs (Bloom, Frail, & Sari, 2001; Bloom, Frail, & Kulkarni, 2003). These significant differences from other well-studied GRB afterglows raised concern that GRB 980425 may have been a unique event, making it difficult to reach firm conclusions about the association of supernovae with other GRBs.
Nevertheless, the SN1998bw/GRB 980425 connection sparked considerable interest in searching for supernova events associated with other bursts. Strong affirmative evidence came from studies of the afterglow of the nearby GRB 030329, in which the characteristic spectral signatures of a Type Ic supernova were found at late times (Hjorth et al., 2003; Stanek et al., 2003; Garnavich et al., 2003). This burst event, at least, appears to have accompanied the destruction of a massive star—supporting a key prediction of the collapsar models.
Are all GRBs associated with supernovae? If so, are the SNe all of the same type, or is there a diversity of supernova properties? Can we study these SNe in order to constrain the nature of the GRB progenitors? To fully answer this question we will need to find signatures of supernovae at distances too great to reach with direct spectroscopy. Supernova spectra peak in the rest-frame optical, so SNe become hard to observe at high redshift where optical observations probe rest-frame ultraviolet light. Furthermore, the host galaxy is often brighter than the supernova.
Most supernovae associated with GRBs have been discovered only by their contribution to the intermediate time lightcurve of the GRB afterglow. Supernovae start faint, and reach a peak days to weeks later, depending on the supernova type, the progenitor mass, the envelope structure, the environment density profile and the energy release. Conversely GRB afterglows are bright at very early times, and generally fall monotonically with little color variation. As the supernova brightens, the fading of the afterglow can appear to have slowed down, or even been reversed with a brightening of the SNe. At the same time, the color becomes dominated by the supernova spectrum, which is typically more red than the power-law spectral energy distribution seen at early times. Such “supernova bumps” have now been seen in several GRB afterglows, including GRBs 980326, 970228, 991208, 011121, and 020405 (Bloom et al., 1999; Castro-Tirado & Gorosabel, 1999; Galama et al., 2000; Castro-Tirado et al., 2001; Greiner et al., 2003; Garnavich et al., 2003; Bloom et al., 2002; Price et al., 2003a; Masetti et al., 2003). They are in general adequately fit by the colors and brightnesses of high-velocity Type Ib/c supernovae such as SN 1998bw.
Other evidence for a connection between supernovae and GRBs comes from observations of the galaxies in which GRBs occur. Host galaxies exhibit very blue colors (Fruchter et al., 1999) and strong emission lines (e.g. [O II],[O III]), indicative of high star formation rates (Vreeswijk et al., 2001), as expected in models involving the collapse of massive stars, though perhaps not ruling out models in which GRBs are caused by the rapid merger of young binary neutron stars. Perhaps stronger evidence comes from the fact that all but one of the well localized GRBs are associated with a host galaxy (Bloom, Kulkarni, & Djorgovski, 2002), and furthermore the positions of the GRBs trace the square of the rest frame UV surface brightness (Fruchter et al, in prep). This association suggests a strong link between massive stars and GRBs.
Here we show that the GRB 020410 was likely associated with a high-velocity supernova of type Ib/c supernova at a redshift . The source brightened between ground-based observations taken after one week and those taken with HST after one month, our late time observations also show a red color, typical of SNe. Fitting of the observed lightcurve implies that the peak absolute magnitude of the underlying SNe was , approximately 2 magnitudes fainter than SN 1998bw. Similar, faint SNe may underlie many long GRBs, but would remain undetected in typical followup campaigns.
2 Observations
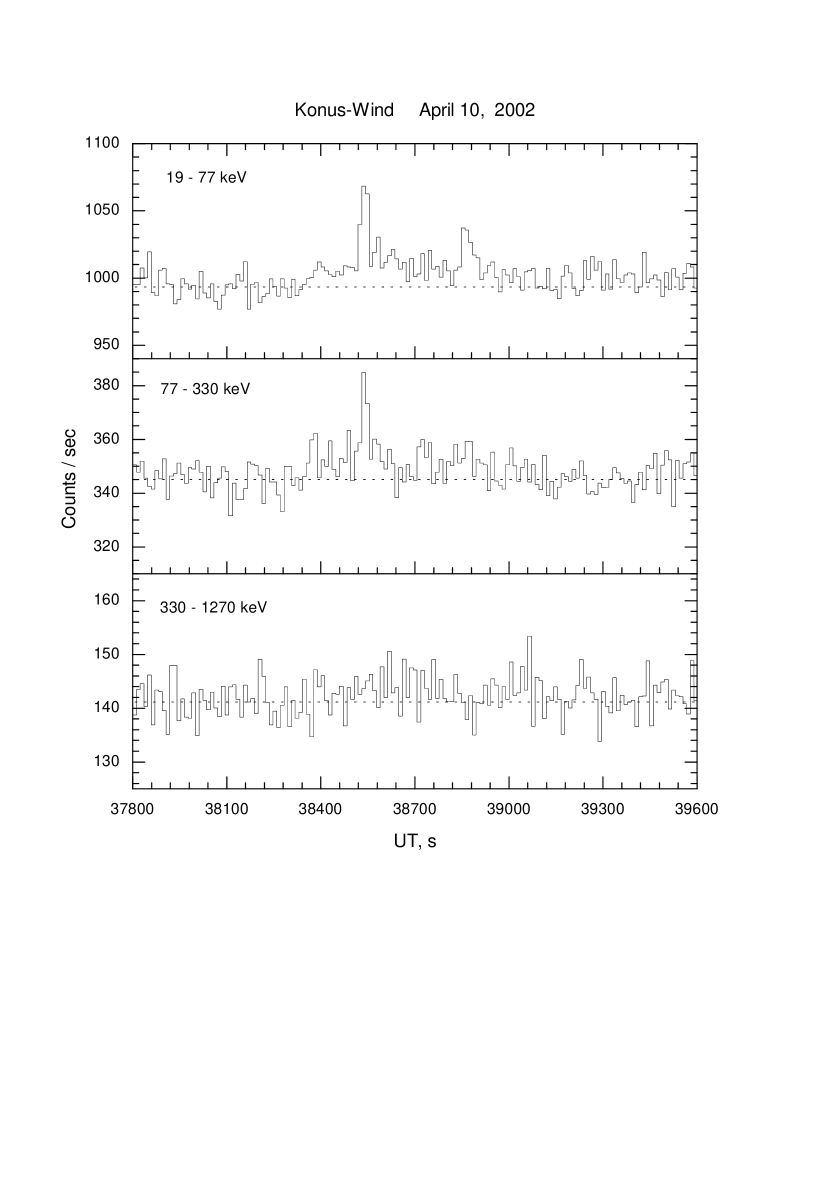
GRB 020410 was detected by the BeppoSAX Wide Field Camera 2 (WFC) on 10 April 2002 at 10:41:20 UT (Gandolfi, 2002a). The Gamma-Ray Burst Monitor (GRBM) was switched off at the time of the burst and thus no high energy ( keV) data were recorded by BeppoSAX. However the burst was detected by Konus-Wind in waiting mode (it did not trigger the instrument)111The detection of the GRB by Konus-Wind was first reported by Nicastro 2002 at the “Gamma-Ray Burts in the Afterglow Era” conference. In the 19-300 keV band it had a duration of and was best fit with a powerlaw with slope , it had a peak flux of ergs s-1 cm-2 and fluence ergs cm2 in the 19-1270 keV band. The lightcurves in the 19-77, 77-330 and 330-1270 keV energy bands are shown in Fig 1.
BeppoSAX observations with the Narrow Field Instruments (NFI) began 20 hours after burst, with a second epoch obtained after 54 hours. These observations revealed the presence of slowly fading X-ray point source (Gandolfi, 2002b, c; Nicastro et al., 2002) with a decay best fit as ; (Nicastro et al., 2004)), the initial error radius was two arcminutes, however this was further refined to a 20″ radius error box 8 days after the burst.
Based on both the prompt emission observed by the WFC and the afterglow properties it was suggested that GRB 020410 was an X-ray Flash (XRF)(Nicastro et al., 2002). XRFs are defined as burst which have a higher X-ray fluence than -ray fluence (Lamb et al, 2003). In order to compare the properties of this burst which was observed by Konus-Wind with those of the bulk GRB/XRF population (now observed by HETE-2) we calculated the expected fluence in the 7-30 and 30-300 () keV band, based on the observed powerlaw slope of . We can then calculate the ratio . X-ray rich GRBs and XRFs are defined as having and respectively. For GRB 020410 we determine , which places GRB 020410 in the X-ray rich GRB category. With a fluence of ergs cm2 (19-1270 keV) the fluence of GRB 020410 lies in the upper quartile of the bursts reported by Barraud et al (2003). However none of the bursts with higher fluence are as X-ray rich. Indeed the measured value of is actually typical of the fainter bursts (for which ) Barraud et al (2003).
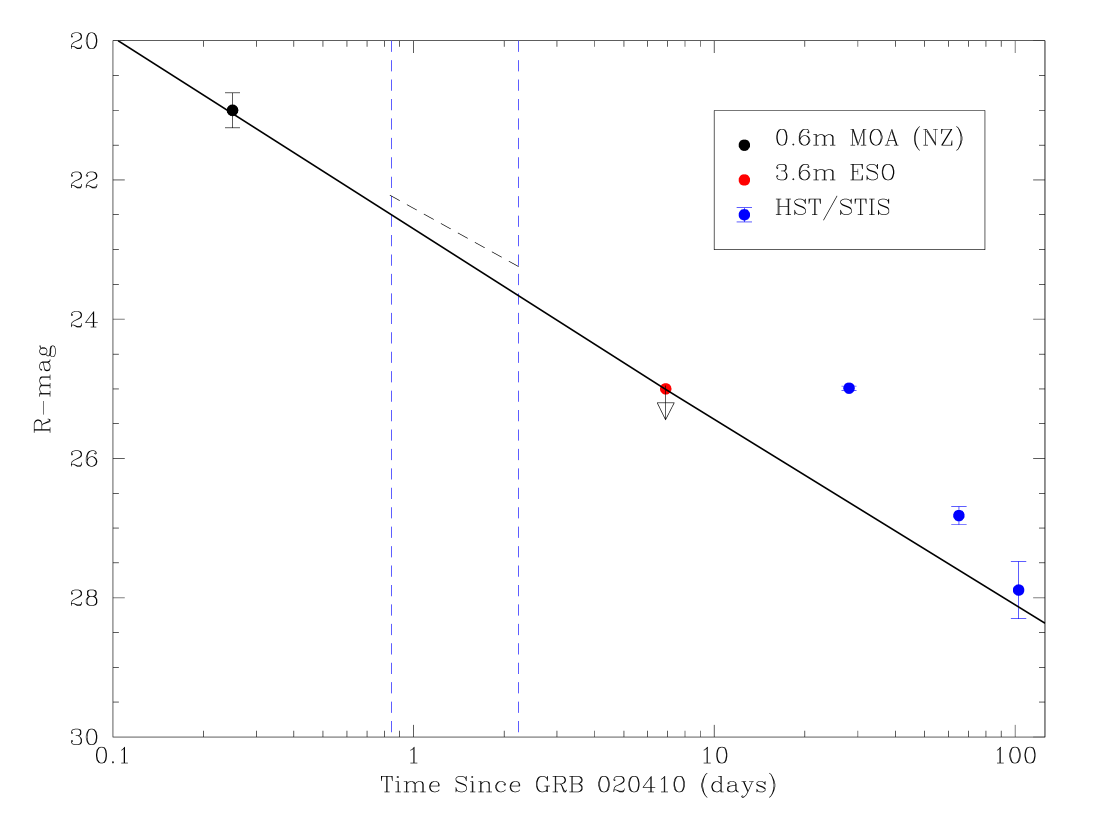
A comparison of early optical observations with Digital Sky Survey images initially failed to find any counterpart (Castro-Tirado et al., 2002; Kilmartin & Gilmore, 2002). However, after the HST discovery reported here (and in Fruchter, Levan, Burud, & Nugent (2002)), a reanalysis of images obtained six hours after the burst at the 0.6m Microlensing Observations in Astrophysics (MOA) telescope in New Zealand by Nicastro et al. (2004, in prep) revealed a 4- detection of an OT at the position of the HST transient, with a magnitude of R (see also Fig 2). This detection confirms the fading source seen in the HST images is the afterglow of the GRB, and is not an unrelated supernova found in the field. No radio afterglow was detected to a 4- limiting flux of 200 Jy at 8.7 GHz (Frail, Wieringa, Berger, & Wark, 2002). The properties of the prompt /X-ray emission and of the X-ray afterglow are discussed in detail in a paper by Nicastro et al. (2004).
The 40″ diameter error box of GRB 020410 was imaged with HST/STIS in 50CCD/CLEAR mode on 8 May and 14 June 2002 as part of program 9074 (P.I. Fruchter). The dithered datasets were retrieved from the HST archive222http://archive.stsci.edu after on-the-fly processing had been applied. These datasets were then drizzled (Fruchter & Hook, 2002) onto an output grid with pixels half the linear size of the native pixels (i.e 0025 on a side) using pixfrac = 0.7. Subtraction of the two epochs of imaging revealed a transient object approximately 10 ″ from the center of the refined BeppoSAX error circle. The source was subsequently imaged again with STIS on 22 July 2002 and 18 April 2003. It was also imaged with the Advanced Camera for Surveys (ACS) using the Wide Field Camera (WFC) in the F606W and F814W filters on 24 July 2002 (ACS images as part of program 9405, P.I. Fruchter). The ACS images were also drizzled onto an output grid using the same parameters as for the STIS data. A log of the observations is shown in Table 1.
The BeppoSAX error circle of GRB 020410 was imaged by the 3.6m telescope at La Silla/ESO seven days after the burst as part of the GRACE333Gamma-Ray Afterglow Collaboration at ESO, see http://zon.wins.uva.nl/~grb/grace/ program. Images were obtained in U,B and R filters, with the R-band exposure being the deepest observation. These images were bias subtracted and flat fielded in the normal way, within IRAF. Examination of the images reveals no evidence for any source at the position of the OT (see below for further details).
2.1 Photometry and Light Curve
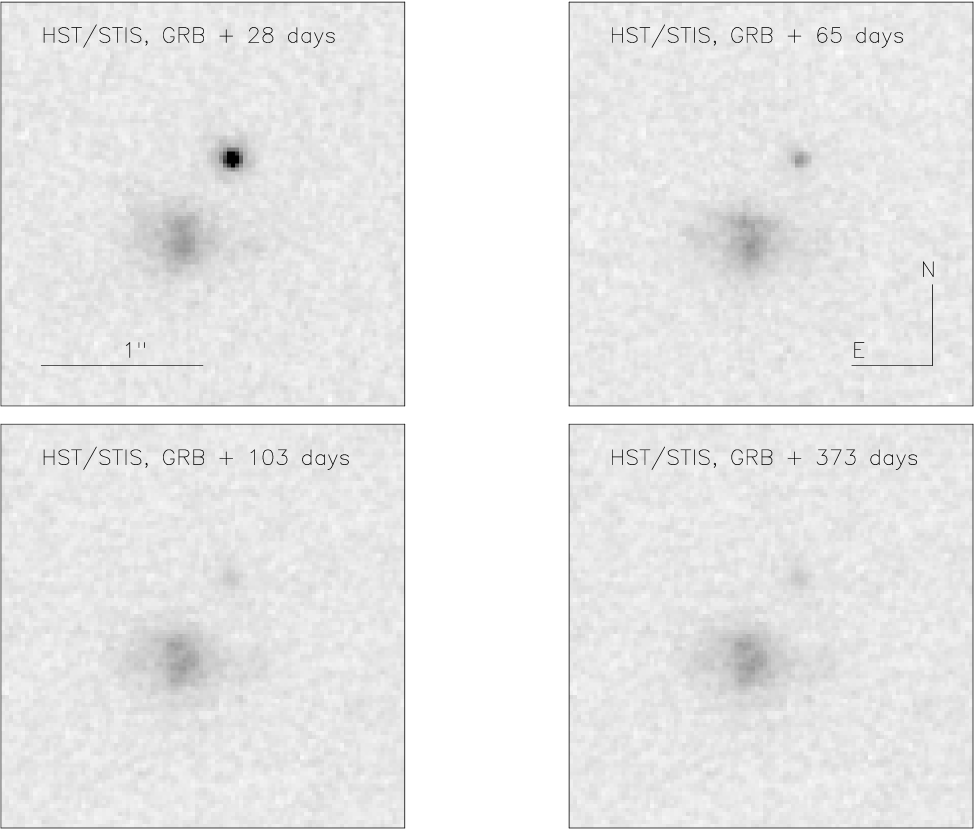
In order to create a lightcurve free from host galaxy contamination we use our late time STIS image of the field of GRB 020410, obtained 373 days after the burst as a template to subtract from the earlier data (see fig 2). We aligned each frame using 8 point sources in common to each image (and the IRAF task geomap) and then drizzled the data onto a common reference frame The accuracy of this alignment is 0.2 drizzled STIS pixels (or 0005). We use a small (01) aperture to determine the flux from the afterglow. We then perform an aperture correction in order to allow for the light from the afterglow which is not included in our measurement aperture. This correction is determined via comparision with two isolated point sources in the STIS field which exhibit a similar color to the afterglow (the colors are determined from the ACS data). We then perform aperture photometry on each of these stars using 01 and 1″ apertures. Having corrected for the light within the 1 ″aperture we then correct to the light in an infinite aperture assuming .
We determined the zeropoint of the ESO 3.6m image by comparison to stellar sources in common to both the 3.6m and ACS images. To do this we measured the observed color of stellar sources in F814W and F606W and fit a single powerlaw between the two. We then extracted a Johnson R magnitude from the data by assuming this spectral slope in IRAF/synphot. Using this method we determine a 3 upper limit of R=24.10 at the position of the afterglow. Our HST images (see Fig 3) show that the OT is offset from a nearby galaxy by 065. These two sources are blended at the resolution of our ground based observations, therefore their integrated magnitude was R 24.10, 7 days after the GRB. We derive a magnitude for the nearby galaxy based on its measured magnitude in each of F606W and F814W and its F606W-F814W color of 0.95. This is converted to an -band magnitude via IRAF/synphot, for this galaxy we determine =24.45. We then measure the flux on our ground based image within a 1 ″aperture, which contains both this galaxy and the position of the optical transient. Their integrated magnitude is fainter than = 24.10, using this, and the known magnitude of the nearby galaxy we derive a 3- upper limit on the magnitude of the afterglow as R 25.0 at =6.8 days. We have also photometrically calibrated the field of 020410 with respect to the USNO-A2 catalog. Using 10 sources within 2 ′of the GRB position we determine a margnially deeper 3- upper limit of , in order that our estimates remain conservative in what follows we use the marginally shallower limit implied by our HST observations.
In order to determine a “Johnson/Cousins” or magnitude from our broadband STIS/50CCD image it is necessary to assume a spectrum of the object. The early time color of the object is poorly constrained since it is only present in a single -band image. However given the predicted rate of decline of the OT we believe that there is minimal contamination from the OT at the time of the first HST observation and hence we determine -corrected magnitudes from the assumed spectra of the SN (see below) and the observed number of counts. The magnitudes are listed in Table 1.
The position of the transient is determined from two USNO CCD Astrograph Catalog (UCAC) stars which lie in the field of the ACS image. The mean position based on the two available images (F814W and F606W) is RA= 22h 06m 32.18s Dec =-83d 49m 27.81s (J2000) with an accuracy of . This position is offset from the center of the BeppoSAX NFI error box by approximately 10″, fully consistent with the 40″ diameter 90% error box (Nicastro et al., 2002).
The magnitude of the transient at the time of our first STIS observation is , marginally brighter than the limit obtained at day 7, implying that the transient re-brightened in this period. Based on the ESO non-detection the mean decay rate between the first detection and the non detection at one week is , somewhat faster than the observed X-ray decay flux of (Nicastro et al. 2004). Were the slopes identical (which would be the case if they both lay on the same section of the fireball spectrum (i.e. were not separated by the cooling break)) then a break would be implied between the second BeppoSAX observations and those with ESO. This would not be unexpected since the majority of GRB afterglows have average decay rates faster than over the first week, however the lack of optical coverage over this periods means that strong conclusions cannot be reached.
The magnitude of the OT in the final ACS epoch is determined using aperture photometry. A small ( radius) aperture is used to minimize the effect of the underlying host, which will likely have a different spectrum for the GRB afterglow and therefore substantially change the observed color. The magnitude is subsequently corrected to the true magnitude by comparison to a point source in the image. The observed color using this small aperture is F606W-F814W = 1.1 , corresponding to a spectral slope of . The use of a larger aperture (025) resulted in a color of F606W-F814W = 0.6 . This change is due to the contamination of the measurement by host galaxy and implies that the host is very blue; typical of GRB hosts in general (Fruchter et al., 1999).
The lightcurve is shown in Figure 2, with the early detection in New Zealand, from Nicastro et al. (2004) and the GRACE data, along with the points from STIS. We note that the first detection of the OT by STIS is marginally brighter than the limit implied by the ESO 3.6m after 7 days, indicating that the object re-brightened between the two observations.
2.2 Host Galaxy
Our final STIS image is taken 373 days post burst. At this stage we expect minimal contamination from either the GRB afterglow or associated supernova. Our STIS image shows an extended source underlying the position of the afterglow, most likely the host galaxy of GRB 020410. Its association with the galaxy 1″ to the southeast in unclear. It has an V(AB) magnitude of 27.9 0.2, which is typical of that expected among GRB host galaxies which have a range of magnitudes from (Hogg & Fruchter, 1999; Le Floc’h et al., 2003). It absolute terms at (our preferred redshift, see discussion below), the host would have an absolute magnitude of = -14.3, placing it amonst the faintest GRB hosts, two magnitudes fainter than the SMC, but comparable to some local dwarf star forming galaxies such as IC 1613. Projecting the position of the GRB onto this image we find that it lies offset from the centroid of the underlying host galaxy by approximately 003 001. At the GRB would have occured within 200pc of the galaxy centre. Using a large aperture (025 radius) on our ACS images we find that F606W-F814W = 0.60 0.1. At the epoch of the ACS observations there remains contamination from the supernova (which is red, with (F606W-F814W)SNe=1.1 ). We can estimate the color of the host galaxy by subtracting the contribution of the supernova within the 025 aperture. We determine the contribution of the supernovae within this aperture by correcting the flux measured in a 01 aperture to that in a 025 for a point source, this is done by using a stellar source in our image which exhibits similar colors to the SNe, we also checked this value by comparing it with the tabulated ACS aperture corrections within synphot and found agreement to better than mags. The host galaxy magnitude is then . This results in AB magnitudes of 28.50 0.10 in F606W and 27.99 0.11 in F814W. Which results in a color of F606W-F814W = 0.51 . These magnitudes underestimate the true brightness of the galaxy since the host galaxy immediately under the supernova has been subtracted.
The relationship between the host galaxy directly underlying the position of the GRB, and the brighter galaxy, offset 06 to the south-west (see Fig 3.) is unclear. There may be no physical association, however if there is then the GRB occured offset from the nucleus of this galaxy by 3.6 kpc, unusual for GRB events (this would lie well outside the half light radius). However in this case the absolute magnitude of the host system would be , similar to the LMC.
3 Supernova lightcurve fitting
In order to determine what, if any, supernova lightcurves could fit the optical photometric data we constructed several spectral templates of the various supernova sub-types in order to perform the necessary -corrections to the data. The templates used for the SN Ia and SN II lightcurves can be found in Nugent, Kim, & Perlmutter (2002) and Gilliland, Nugent, & Phillips (1999), respectively. For the SN Ib/c subtype, we created a new template based upon the spectra of SN 1998bw (Patat et al., 2001) made available to us through the SUSPECT database 444see http://tor.nhn.ou.edu/~suspect/index.html. These spectra and their temporal evolution are similar to those of SNe 1997ef and 2002ap, two other well know high-velocity SN Ib/c.
In Figure 4 we plot the lightcurves of a normal SN Ia over the redshift range as they would appear in the STIS 50CCD clear filter. It is clear from this figure and the data in Table 1 that the only possible scenario in which the OT could be associated with a SN Ia is at a redshift greater than 1.0. SNe Ia at lower redshifts could only approach the magnitudes seen for this event at very late times during the tail of the supernova lightcurve. At these epochs the decay of the lightcurve is nicely modeled by a decline of 0.017 magnitudes per day in the restframe - or -band divided by the factor over a period of several hundred days (Cappellaro et al., 1997, for example). However, this is not a good match for the lightcurve of the OT as it declines by 0.05 mag between days 28 and 65 and 0.02 mags between day 65 and 102.
As seen in Figure 4 a SN Ia at a redshift of 1.0 can nicely reproduce the STIS lightcurve if the first HST data point was taken near maximum light. However, this possibility can be rejected with consideration of the ACS photometry in the F606W and F814W filter taken at day 104. The observed color was 1.1 mag. However, for SNe Ia at this redshift and late-time epoch, the flux in the restframe ultraviolet has practically vanished and thus the flux in the F606W filter would as well. Based on our templates the color for a SN Ia with at these epochs would be between these filters. Thus a SN Ia at any epoch and redshift is not able to reproduce all the observed data for the OT.
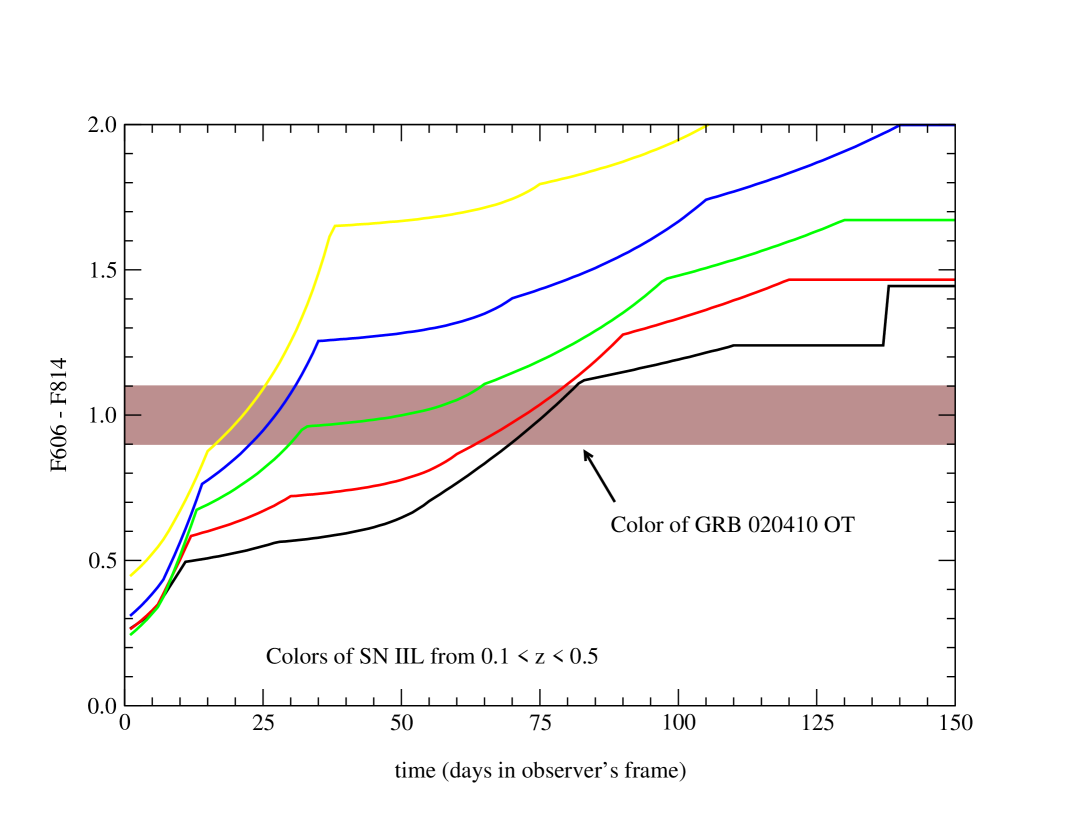
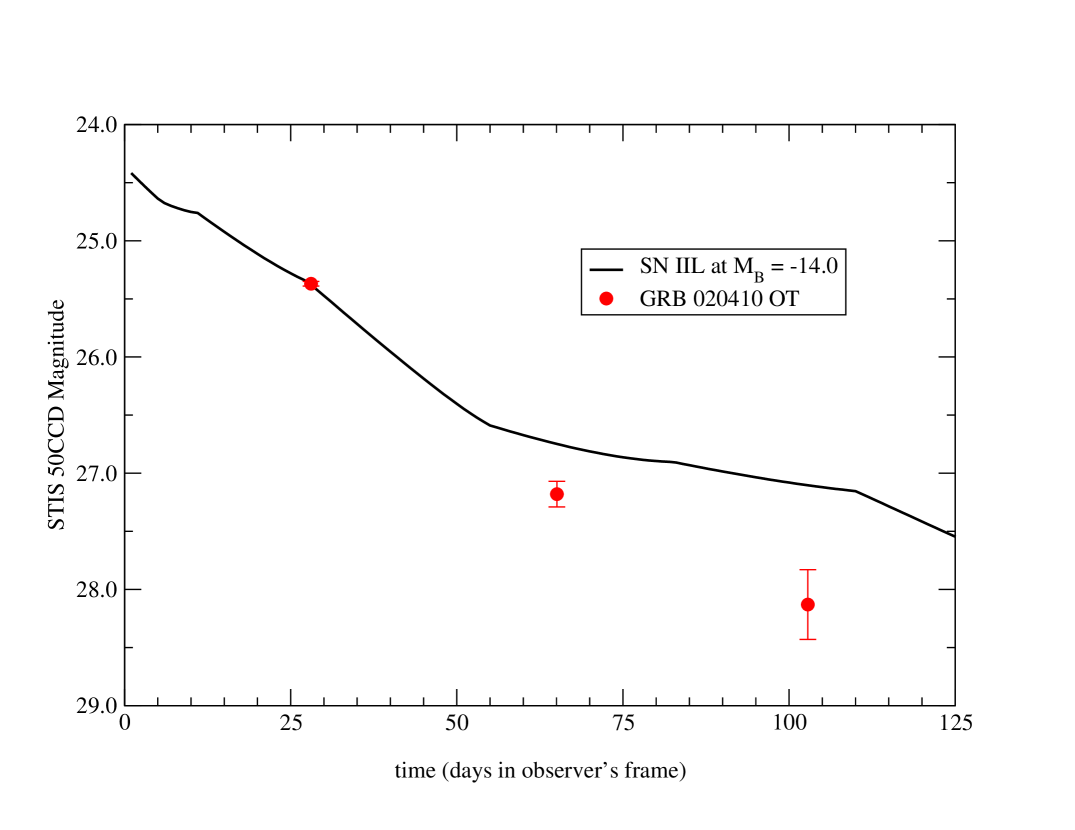
As for SNe II the mere shape of the lightcurve rules out plateau-like events. The only possible fit to a linear-like event, based upon the colors, would be at very low redshift, , as seen in Figure 5. However, at these redshifts the intrinsic brightness of the supernova would be . This is unheard of for linear events which are usually representative of the brighter portion of the SN II population such as SN 1979C (Branch et al., 1981; de Vaucouleurs et al., 1981). Further Richardson et al. (2002) find that none of their sample of 16 SN II-L events have . For a full discussion of supernova absolute magnitudes see Richardson et al. (2002). In addition, as seen in Figure 6, the fit to an average linear template at these redshifts is quite poor.
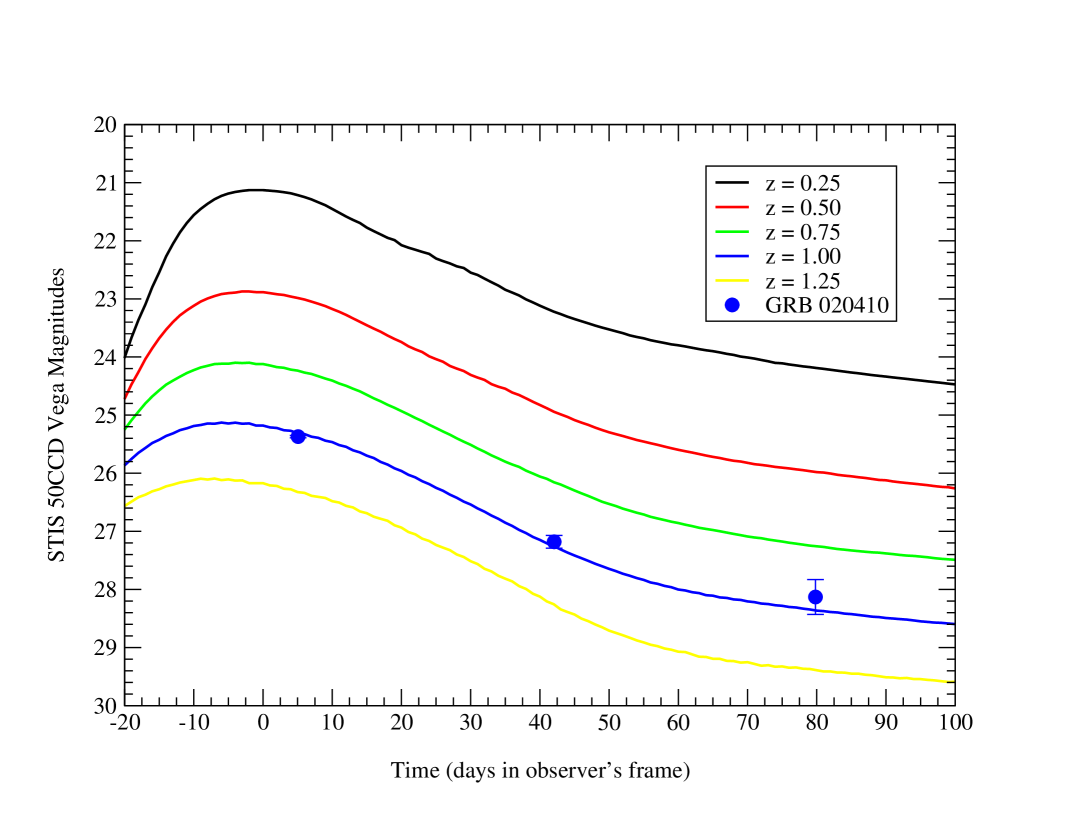
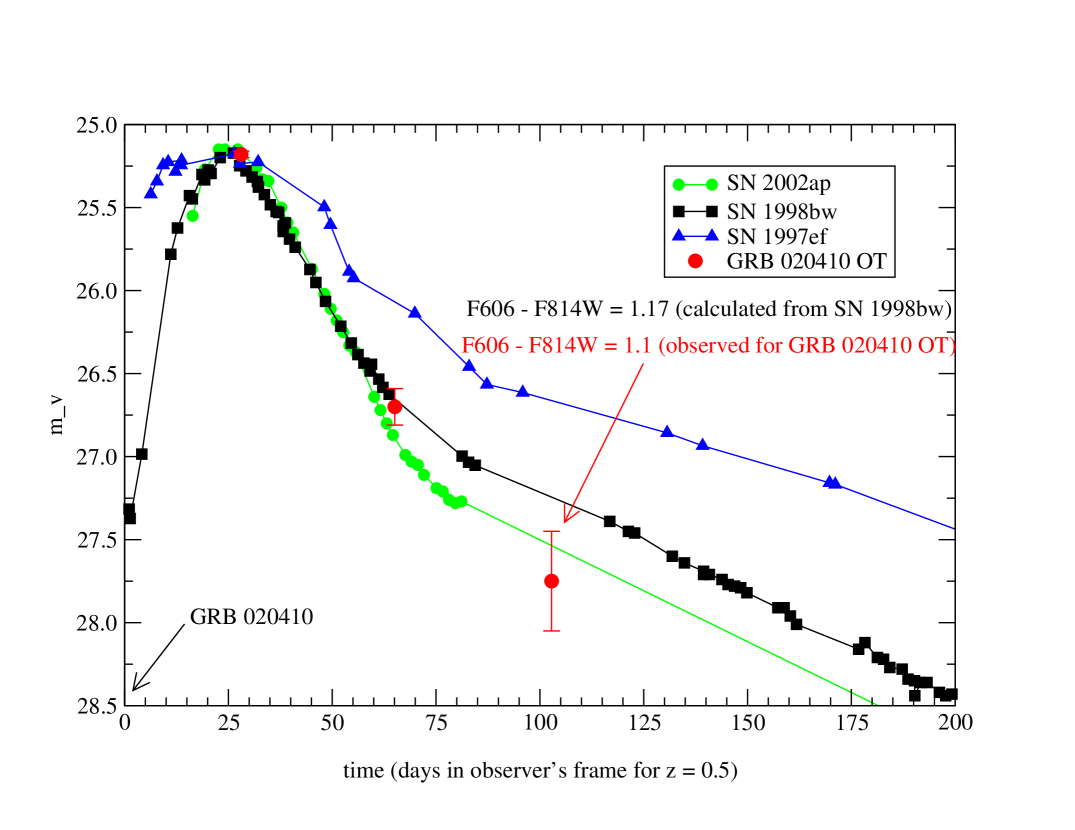
The only good fit to the OT based on an underlying supernova is seen in Figure 7. Here we have shifted the high velocity SNe Ic 1997ef (Iwamoto et al., 2000), 1998bw (Galama et al., 1998; McKenzie & Schaefer, 1999) and 2002ap (Pandey et al., 2003; Gal-Yam, Ofek, & Shemmer, 2002) to a redshift of with the explosion date set to be coincident with the observation of the GRB signal from 020410 (cosmology of , and ). All three supernovae follow a very similar spectral evolution to the template so that differences in the -corrections between the various supernovae will be negligible. The observed lightcurve for the OT is nicely reproduced as is the color at day 104. Both SNe 1997ef and 2002ap have peak magnitudes of , which is where the OT is found to lie given our choice of cosmology. SN 1998bw is more than 2 magnitudes brighter than SN 1997ef and SN 2002ap, so we have shifted down the peak of its lightcurve correspondingly. Some variation in the lightcurve shape and decline on the tail between these supernovae is seen, demonstrating that within the expected variability of these types of SNe Ic we would find a good match to the lightcurve of GRB 020410
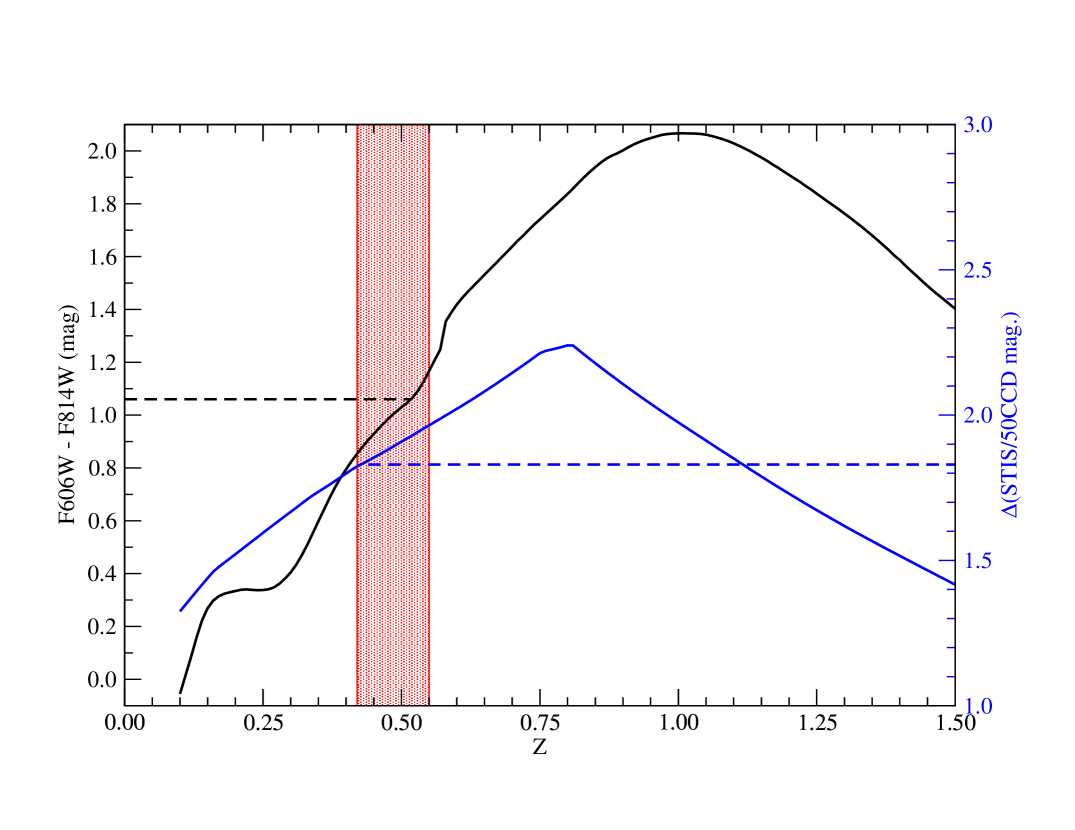
In Figures 8 and 9 we demonstrate the constraint on the redshift by the data. Assuming that the explosion date is coincident with the date of the GRB detection, we plot the brightness (blue) and color (black) of a high-velocity SN Ib/c as a function of redshift along with the HST observations. Due to the steepness of the color–redshift relationship, the only reasonable redshift range is . The resulting peak brightness, given this redshift range, is . The constraint on redshift is shown in figures 8 & 9.
We also compared the data to a more normal set of SNe Ib/c such as SNe 1993J (IIb) and 1994I (Ic). These supernovae are characterised by much lower expansion velocities, indicative of less energetic exposions. They also have significantly more rapid declines after maximum light, although both SN 1993J and 1994I reach a peak brightness comparable to SNe 2002ap and 1997ef. Given color information for the OT at the earlier epochs we would have been able to distinguish between these supernovae and their high-velocity counterparts quite easily since their colors before, and at maximum show some variety. However, given our choice of filters and the corresponding uncertainties in the observations, the late-time colors for all these supernovae are indistinguishable. The fact that SNe 1993J and 1994I decay much more rapidly in the optical (Lewis et al., 1994; Richmond et al., 1996) than the OT could be used as evidence against more normal SN Ib/c being associated with this OT. However, given the diversity in both the rise-times and decline rates of core-collapse supernovae, we do not think this difference can be used as strong evidence towards an exclusive association of this OT with a high-velocity SN Ib/c. The strength of our redshift constraint () is a product of both color and lightcurve shape. We believe this is resonable as the local sample of type Ib/c supernovae (SN 1994I, 1997ef,1998bw and 2002ap) have effectively identical late time colors. At present these are the best models spectral models available, but the sample is still small at present. The caveat to this result is therefore that should a larger sample of SN Ib/c spectra reveal differing late time ( day) colors then the redshift range (and hence peak magnitude) that we determine could be significantly affected.
The potential detection of a supernova associated with GRB 020410 was largely possible due to the intrinsic faintness of the afterglow. For example Price et al. (2003a) place constraints on the magnitude of an underlying supernovae to GRB 010921 as 1.34 magnitudes fainter than SN 1998bw. However the absolute magnitude of SN 1998bw was (Galama et al., 1998), while both SNe 1997ef and 2002ap were in excess of 2 magnitudes fainter. Hence, if we assume that the intrinsic luminosity of the supernova underlying GRB 020410 was similar to that of the latter then it provides an indication that substantially less optically luminous supernovae can also give rise to GRBs, and also that supernovae of this brightness may be present in the afterglows of low redshift GRBs for which no definitive supernova signature can be found.
Supernova are not the only possible explanations for the late time bumps seen in GRB afterglows. Esin & Blandford (2000) consider the possibility that the bumps may be due to dust echos. In this model the late time bump is caused by re-radiation, or reflection of the early optical afterglow from dust which lies beyond the sublimation radius of the burst. However, for a dust echo to have the same appearance as a supernova, it must be a somewhat fortuitous event. It has to mimic both the color and the time of peak emission of a supernova. In all cases where a re-brightening of the lightcurve has been observed it can be well fit by an underlying supernova which occurred approximately temporally coincident with the GRB, making dust echoes unlikely. Furthermore using the excellent temporal and spectral sampling of the afterglow of GRB 970228, Reichart (2001) demonstrated that dust echoes were not a valid mechanism for the production of the observed bump.
4 Comparison with other GRBs
The implied magnitude of GRB 020410 at 1 day is R. This places GRB 020410 as one of the fainter GRB afterglows discovered thus far. Its magnitude at one day is similar to that of GRBs 980329, 980613, 000630, 020124, 021211 and 030227 (Gorosabel et al., 1999; Fynbo et al., 2001; Hjorth et al., 2002; Berger et al., 2002; Fox et al., 2003; Castro-Tirado et al., 2003, respectively). However its decay rate (at least in the X-ray) was , typical for GRBs in general, implying that GRB 020410 “started faint”, rather than faded fast as seen for GRBs 020124 and 021211. The afterglow could easily have remained unidentified (and the burst classified as “dark”) were it not for the HST observations taken 28 days after the burst. This is apparently consistent with the conclusions of Fynbo et al. (2001) that many bursts which are classed as optically dark are in fact simply missed since current searches are neither sufficiently rapid nor deep enough to discover the OT. In any case, this burst could certainly be classified among the “optically dim” GRBs.
Some models of dark and optically faint GRBs attribute their optical faintness to extreme extinction in their host galaxies, as may be expected if they are quite dusty. This would be typical of low redshift starbursts. To date the exact nature of host extinction and its effect on the bursts is unclear. For example in the well studied case of GRB 010222 (Galama et al. (2003)) the multi-band optical data is well fit by a very low extinction, somewhat in conflict with the SCUBA observation implying the galaxy is a ULIRG with (Frail et al., 2002). Another clear disagreement comes from the dark GRB 000210, where a high was measured from the X-ray afterglow (Piro et al., 2002) and sub-mm observations imply a high dust content (Barnard et al., 2003; Berger et al., 2003) whereas optically its host galaxy shows (Gorosabel et al., 2003a). Similarly dust extinction has been suggested as an explanation for the very red afterglow of GRB 000418 (Klose et al., 2000) and the non-detection of the afterglow of GRB 020819. However the host galaxy extinction in the case of GRB 000418 is, similarly to GRB 000210 very low (; Gorosabel et al. (2003b)). Only in the case of GRB 030115 (Levan et al, in prep; Lamb et al, 2003) does a very red afterglow appear to be located in a very red (and highly extincted) galaxy. If the optical faintness of the GRB 020410 afterglow were due to extinction in the host, this may explain its observed red color: the presence of a dusty host would significantly redden the normally blue () afterglow spectrum, whilst (as with the cases above) the global (host galaxy) colors could remain very blue. However, the re-brightening of the afterglow of GRB 020410 cannot be explained simply by a dusty host galaxy (unless the dust echo model is also inferred), further the observed colors of the SN are not consistent with those of SN 1998bw with significant extinction (with 2 magnitudes of additional extinction SN 1998bw would have F606W-F814W = 2.0) so extinction is not a valid method of obtaining both a faint afterglow and faint SNe. We therefore believe there is unlikely to be significant extinction along the line of sight to the GRB.
Zeh, Klose & Hartmann (2004) have carried out a survey of all low-z GRBs and find that their intermediate time afterglows can be fit with SN 1998bw-like templates with a modest dispersion in their peak luminosities and rise times. The peak luminosity of a type Ic supernova is determined by its Nickel yield. A fainter SNe corresponds to a lower Nickel production. The faintest SNe within the Zeh, Klose & Hartmann (2004) sample (for which there is a positive detection) is 40 % as bright as SN 1998bw. The supernova associated with GRB 020410 is only 15 % as bright and is as such the faintest SNe yet seen associated with a GRB, this would correspond to a Nickel yield of M⊙. There are also now three cases of burst whose ”bump” spectra and light curves may be better fit with SN 1994I-like supernovae (GRB 021211, Della Valle et al, 2003; XRF 030723 Fynbo et al, 2004; GRB 020305, Gorosabel et al, 2004, in prep). However due to the lack of early color information or spectroscopy we cannot determine if GRB 020410 lies in this class.
5 Conclusions
The re-brightening and color of the afterglow of GRB 020410 present strong evidence for an associated supernova. We have modelled both the excess and color with various supernova templates and find that the only acceptable fit is that of a SN Ib/c at .
This GRB was unusual in that its initial discovery was done via photometry taken one and two months after the burst with HST, after early ground based observations had failed to detect a transient. Were it not for these deep, late-time observations, this burst would have been classified as a dark GRB, for which only an X-ray afterglow was found. These early optical searches were conducted using small telescopes to depths no greater than the Digitized Sky Survey. Hence a change in the search strategies to include much deeper, later-time imaging may be successful in locating OTs associated with GRBs. However, in order for this method to be successful, the error boxes will need to be well defined in order to limit both the time spent searching and to eliminate unrelated, serendipitously discovered supernovae.
Finally we note that the presence of a SNe component, whose magnitude is significantly fainter that SN 1998bw (by 2 magnitudes) has dramatic implications for the searches for similar such signatures in other afterglows. It is possible that similar supernova could be present in the afterglows of many long GRBs. For example, the well constrainted upper limit for an underlying SNe to GRB 010921 of 1.34 magnitudes fainter than SN 1998bw remains consistent with a SNe of similar magnitude to that underlying GRB 020410. This stresses the need for accurate photometry of the late time afterglows of many GRBs if we are indeed to understand the breadth of the luminosity function of underlying SNe.
Acknowledgments
Support for proposals 9074 and 9405 was provided by NASA through a grant from the Space Telescope Science Institute, which is operated by the Association of Universities for Research in Astronomy, Inc., under NASA contract NAS 5-26555. AJL acknowledges support from the Space Telescope Science Institute Summer Student Programme and from PPARC, UK. PEN acknowledges support from a NASA LTSA and ATP grants. This research used resources of the National Energy Research Scientific Computing Center, which is supported by the Office of Science of the U.S. Department of Energy under Contract No. DE-AC03-76SF00098. STH acknowledges support from the NASA LTSA grant NAG5–9364.This work was conducted in part via collaboration within the the Research and Training Network “Gamma-Ray Bursts: An Enigma and a Tool”, funded by the European Union under contract number HPRN-CT-2002-00294
References
- Barnard et al. (2003) Barnard, V. E., et al. 2003, MNRAS, 338, 1
- Berger et al. (2003) Berger, E., Cowie, L. L., Kulkarni, S. R., Frail, D. A., Aussel, H., & Barger, A. J. 2003, ApJ, 588, 99
- Barraud et al. (2003) Barraud, C. et al. 2003, A&A, 400, 1021
- Bloom, Frail, & Kulkarni (2003) Bloom, J. S., Frail, D. A., & Kulkarni, S. R. 2003, ApJ, 594, 674
- Berger et al. (2002) Berger, E. et al. 2002, ApJ, 581, 981
- Bloom et al. (2002) Bloom, J. S. et al. 2002, ApJ, 572, L45
- Bloom, Kulkarni, & Djorgovski (2002) Bloom, J. S., Kulkarni, S. R., & Djorgovski, S. G. 2002, AJ, 123, 1111
- Bloom, Frail, & Sari (2001) Bloom, J. S., Frail, D. A., & Sari, R. 2001, AJ, 121, 2879
- Bloom et al. (1999) Bloom, J. S. et al. 1999, Nature, 401, 453
- Bremer et al. (1998) Bremer, M., Krichbaum, T. P., Galama, T. J., Castro-Tirado, A. J., Frontera, F., van Paradijs, J., Mirabel, I. F., & Costa, E. 1998, A&A, 332, L13
- Branch et al. (1981) Branch, D., Falk, S. W., Uomoto, A. K., Wills, B. J., McCall, M. L., & Rybski, P. 1981, ApJ, 244, 780
- Cappellaro et al. (1997) Cappellaro, E., Mazzali, P. A., Benetti, S., Danziger, I. J., Turatto, M., della Valle, M., & Patat, F. 1997, A&A, 328, 203
- Castro-Tirado et al. (2003) Castro-Tirado, A. J. et al. 2003, A&A, 411, L315
- Castro-Tirado et al. (2002) Castro-Tirado, A. J., Gorosabel, J., Castro Cerón, J. M., Nelson, B., & Tristram, P. 2002, GRB Circular Network, 1355
- Castro-Tirado et al. (2001) Castro-Tirado, A. J. et al. 2001, A&A, 370, 398
- Castro-Tirado & Gorosabel (1999) Castro-Tirado, A. J. & Gorosabel, J. 1999, A&AS, 138, 449
- Costa et al. (1997) Costa, E. et al. 1997, Nature, 387, 783
- Della Valle et al. (2003) Della Valle, M. et al. 2003, A&A, 406, L33
- de Vaucouleurs et al. (1981) de Vaucouleurs, G., de Vaucouleurs, A., Buta, R., Ables, H. D., & Hewitt, A. V. 1981, PASP, 93, 36
- Esin & Blandford (2000) Esin, A. A. & Blandford, R. 2000, ApJ, 534, L151
- Fox et al. (2003) Fox, D. W. et al. 2003, ApJ, 586, L5
- Frail et al. (2002) Frail, D. A. et al. 2002, ApJ, 565, 829
- Frail, Wieringa, Berger, & Wark (2002) Frail, D. A., Wieringa, M. H., Berger, E., & Wark, R. 2002, GRB Circular Network, 1380
- Frail et al. (1997) Frail, D. A., Kulkarni, S. R., Nicastro, S. R., Feroci, M., & Taylor, G. B. 1997, Nature, 389, 261
- Fruchter & Hook (2002) Fruchter, A. S. & Hook, R. N. 2002, PASP, 114, 144
- Fruchter, Levan, Burud, & Nugent (2002) Fruchter, A. S., Levan, A. J., Burud, I., & Nugent, P. E. 2002, GRB Circular Network, 1453
- Fruchter et al. (1999) Fruchter, A. S. et al. 1999, ApJ, 519, L13
- Fynbo et al. (2004) Fynbo, J. P. U. et al ApJ, submitted, astro-ph/0402240
- Fynbo et al. (2001) Fynbo, J.P.U. et al. 2001, A&A, 369, 373
- Galama et al. (2003) Galama, T. J. et al. 2003, ApJ, 587, 135
- Galama et al. (2000) Galama, T. J. et al. 2000, ApJ, 536, 185
- Galama et al. (1998) Galama, T. J. et al. 1998, Nature, 395, 670
- Gal-Yam, Ofek, & Shemmer (2002) Gal-Yam, A., Ofek, E. O., & Shemmer, O. 2002, MNRAS, 332, L73
- Gandolfi (2002c) Gandolfi, G. 2002a, GRB Circular Network, 1366
- Gandolfi (2002b) Gandolfi, G. 2002b, GRB Circular Network, 1358
- Gandolfi (2002a) Gandolfi, G. 2002c, GRB Circular Network, 1349
- Garnavich et al. (2003) Garnavich, P. et al. 2003, IAU Circ., 8108, 2
- Garnavich et al. (2003) Garnavich, P. M. et al. 2003, ApJ, 582, 924
- Greiner et al. (2003) Greiner, J. et al, 2003, ApJ, 599, 1223
- Gilliland, Nugent, & Phillips (1999) Gilliland, R. L., Nugent, P. E., & Phillips, M. M. 1999, ApJ, 521, 30
- Gorosabel et al. (2004) Gorosabel, J. et al. 2004, A&A, in prep
- Gorosabel et al. (2003a) Gorosabel, J. et al. 2003a, A&A, 409, 123
- Gorosabel et al. (2003b) Gorosabel, J. et al. 2003b, A&A, 400, 127
- Gorosabel et al. (1999) Gorosabel, J., Castro-Tirado, A. J., Pedrosa, A., Zapatero-Osorio, M. R., Fernandes, A. J. L., Feroci, M., Costa, E., & Frontera, F. 1999, A&A, 347, L31
- Hjorth et al. (2002) Hjorth, J., et al. 2002, ApJ, 576, 113
- Hjorth et al. (2003) Hjorth, J. et al. 2003, Nature, 423, 847
- Hogg & Fruchter (1999) Hogg, D. W. & Fruchter, A. S. 1999, ApJ, 520, 54
- Iwamoto et al. (2000) Iwamoto, K., et al. 2000, ApJ, 534, 660
- Kilmartin & Gilmore (2002) Kilmartin, P. & Gilmore, A. 2002, GRB Circular Network, 1350, 1
- Klose et al. (2003) Klose, S. et al. 2003, ApJ, 592, 1025
- Klose et al. (2000) Klose, S. et al. 2000, ApJ, 545, 271
- Kouveliotou et al. (1993) Kouveliotou, C., Meegan, C. A., Fishman, G. J., Bhat, N. P., Briggs, M. S., Koshut, T. M., Paciesas, W. S., & Pendleton, G. N. 1993, ApJ, 413, L101
- Lamb et al. (2003) Lamb, D. Q. et al. 2003, astro-ph/0309462
- Le Floc’h et al. (2003) Le Floc’h, E. et al. 2003, A&A, 400, 499
- Levan et al. (2004) Levan, A. et al. 2004, ApJ, in prep
- Lewis et al. (1994) Lewis, J. R. et al. 1994, MNRAS, 266, L27
- Masetti et al. (2003) Masetti, N. et al. 2003, A&A, 404, 465
- McKenzie & Schaefer (1999) McKenzie, E. H. & Schaefer, B. E. 1999, PASP, 111, 964
- Nicastro et al. (2002) Nicastro, L., Piro, L., Gandolfi, G., Feroci, M., Capalbi, M., Perri, M., Heise, J., & in’t Zand, J. 2002, GRB Circular Network, 1374
- Nicastro et al. (2004) Nicastro, L et al, 2004, A&A, in prep
- Nugent, Kim, & Perlmutter (2002) Nugent, P., Kim, A., & Perlmutter, S. 2002, PASP, 114, 803
- Pandey et al. (2003) Pandey, S. B., Anupama, G. C., Sagar, R., Bhattacharya, D., Sahu, D. K., & Pandey, J. C. 2003, MNRAS, 340, 375
- Patat et al. (2001) Patat, F. et al. 2001, ApJ, 555, 900
- Piro et al. (2002) Piro, L. et al. 2002, ApJ, 577, 680
- Price et al. (2003b) Price, P. A. et al. 2003b, ApJ, 584, 931
- Price et al. (2003a) Price, P. A. et al. 2003a, ApJ, 589, 838
- Reichart (2001) Reichart, D. E. 2001, ApJ, 554, 643
- Richardson et al. (2002) Richardson, D., Branch, D., Casebeer, D., Millard, J., Thomas, R. C., & Baron, E. 2002, AJ, 123, 745
- Richmond et al. (1996) Richmond, M. W. et al. 1996, AJ, 111, 327
- Stanek et al. (2003) Stanek, K. Z. et al. 2003, ApJ, 591, L17
- van Paradijs et al. (1997) van Paradijs, J. et al. 1997, Nature, 386, 686
- Vreeswijk et al. (2001) Vreeswijk, P. M. et al. 2001, ApJ, 546, 672
- Woosley & MacFadyen (1999) Woosley, S. E. & MacFadyen, A. I. 1999, A&AS, 138, 499
- Woosley (1993) Woosley, S. E. 1993, ApJ, 405, 273
- Zeh, Klose & Hartmann (2004) Zeh, A., Klose, S., Hartman, D.H., ApJ, submitted, astro-ph/0311610
| (days) | Inst./Filter | Exp. Time | V-mag | V-mag - host | ||
|---|---|---|---|---|---|---|
| 6.895 | ESO 3.6m R | 1800 | - | - | - | |
| 28.0635 | STIS/50CCD | 8392 | 25.35 | 25.39 0.03 | -0.177 | 0.289 |
| 65.0635 | STIS/50CCD | 8315 | 26.91 | 27.22 0.13 | -0.308 | 0.582 |
| 102.820 | STIS/50CCD | 8315 | 27.45 | 28.29 0.41 | -0.285 | 0.484 |
| 372.215 | STIS/50CCD | 8233 | 28.69 | - | - | - |
| 104.035 | ACS/WFC F606W | 3680 | 27.81(AB) | - | - | - |
| 104.371 | ACS/WFC F814W | 3680 | 26.75(AB) | - | - | - |
Note. — Table of observations of GRB 020410, showing the time of each observation, the observed magnitude (or limiting magnitude). Also shown in the case of the STIS images are the measured magnitudes of the OT before and after the host has been subtracted and the relevant K-corrections to correct from Bessel B & V filters to that of STIS. These are based on the observed spectrum of SN 1998bw, which is spectroscopically similar to that of both SNe 1997ef and 2002ap and indeed the recent SN 2003dh (GRB 030329). The uncertainty quoted is based simply on the uncertainty in the measured number of counts in the aperture, and does not reflect the potential uncertainty in the underlying spectrum.