A dipping black-hole X-ray binary candidate in NGC 55
Abstract
XMM-Newton EPIC observations have revealed a bright point-like X-ray source in the nearby Magellanic-type galaxy NGC 55. At the distance of NGC 55, the maximum observed X-ray luminosity of the source, designated as XMMU J001528.9-391319, is erg s-1, placing the object in the ultraluminous X-ray source (ULX) regime. The X-ray lightcurve exhibits a variety of features including a significant upward drift over the 60 ks observation. Most notably a series of X-ray dips are apparent with individual dips lasting for typically 100–300 s. Some of these dips reach almost 100 percent diminution of the source flux in the 2.0–4.5 keV band. The EPIC CCD spectra can be modelled with two spectral components, a very soft powerlaw continuum () dominant below 2 keV, plus a multi-colour disc (MCD) component with an inner-disc temperature keV. The observed upperward drift in the X-ray flux can be attributed to an increase in the level of the MCD component, whilst the normalisation of the powerlaw continuum remains unchanged. The dipping episodes correspond to a loss of signal from both spectral components, although the blocking factor is at least a factor two higher for the MCD component. XMMU J001528.9-391319 can be considered as a candidate black-hole binary (BHB) system. A plausible explanation of the observed temporal and spectral behaviour is that we view the accretion disc close to edge-on and that, during dips, orbiting clumps of obscuring material enter our line of sight and cause significant blocking or scattering of the hard thermal X-rays emitted from the inner disc. In contrast, the more extended source of the soft powerlaw flux is only partially covered by the obscuring matter during the dips.
keywords:
accretion, accretion discs - X-rays:binaries - X-rays:galaxies1 Introduction
Chandra and XMM-Newton provide powerful facilities for studying the X-ray properties of nearby galaxies. A focus of recent work in this area has been the ultraluminous X-ray source (ULX) phenomenon, namely point-like X-ray sources located outside the nucleus of the galaxy with X-ray luminosities apparently in excess of erg s-1 (Roberts & Warwick 2000; Colbert & Ptak 2002; Miller & Colbert 2003). It is entirely plausible that sources with X-ray luminosities at, or just above, this threshold are mass-transfer binaries containing a stellar mass black-hole (3–20 M⊙) radiating at close to the Eddington limit. Supporting evidence is provided by the fact that many ULXs display similar characteristics to those of established black-hole binaries (BHBs) (e.g., Makishima et al. 2000). However, the nature of the subset of ULXs with X-ray luminosities in excess of a few erg s-1 is less certain, since these could be systems harbouring intermediate mass black-holes (Colbert & Mushotzky, 1999), radiating anisotropically (King et al., 2001) or possessing truly super-Eddington discs (Begelman, 2002).
It has been estimated that an accreting black-hole, as opposed to a neutron star, is present in at least 10% of all bright X-ray binaries (XRBs)(McClintock & Remillard, 2003). At the present time there are only 18 dynamically-confirmed stellar-mass BHBs, most of which were discovered as X-ray novae in our own galaxy (McClintock & Remillard, 2003). To this sample we can add a further 20 or more candidate objects which exhibit all the characteristics of black-hole systems (McClintock & Remillard, 2003). Using Chandra and XMM-Newton, an individual bright binary X-ray source can be studied out to a distance of about 10 Mpc, hence studies of nearby galaxies have the potential for greatly extending our knowledge of luminous XRBs of all types, including black-hole systems. For example, M31 has been a prime target for recent observations (e.g., Kong et al. 2002; Shirey et al. 2001; Osborne et al. 2001), and at least one good BHB candidate has been identified on the basis of its X-ray properties (RX J0042.3+4115; Barnard et al. 2003). The other major Local Group galaxy, M33, also hosts many discrete X-ray sources (e.g., Haberl & Pietsch 2001), including the most luminous persistent X-ray source in the Local Group (M33 X-8; Trinchieri, Fabbiano, & Peres 1988). This source is another good black-hole candidate, with recent Chandra observations revealing characteristics consistent with accretion onto a object (La Parola et al., 2003). Yet a further example is the discovery of an eclipsing XRB in NGC 253 (Pietsch, Haberl, & Vogler, 2003). In the present paper we discuss the properties of the brightest X-ray source detected in NGC 55. This source sits right on the boundary of the “normal” binary/ULX categorisation and, on the basis of its X-ray luminosity and spectral properties, is most probably a black-hole system.
NGC 55 is a member of the nearby Sculptor group of galaxies, located in the region of the South Galactic Pole at a distance of 1.78 Mpc (Karachentsev et al., 2003). It is morphologically similar to the Large Magellanic Cloud but viewed edge-on with its bar pointing almost along the line of sight (, Tully 1988). NGC 55 has previously been studied in the X-ray band through ROSAT PSPC (Read, Ponman & Strickland 1997; Schlegel, Barrett & Singh 1997) and HRI (Roberts, 1997) observations. The PSPC data revealed seven bright point-like X-ray sources coincident with the galaxy (Schlegel et al. 1997). A subsequent re-analysis of the PSPC data, in conjunction with the HRI data, revealed 25 X-ray point sources coincident with, or in close proximity to, the disc of the galaxy (Roberts, 1997). The ROSAT observations showed one particular object, located to the east of the main bar complex, to be several times brighter than any other X-ray source in the galaxy (Source 7 of Schlegel et al. 1997; Source 6 of Read et al. 1997; and Source N55-14 of Roberts 1997). The ROSAT PSPC data further revealed this source to be spectrally soft (bremsstrahlung temperature keV or powerlaw photon index ) and mildly absorbed () with a derived X-ray luminosity of in the 0.1 – 2.4 keV ROSAT band, adopting a distance of 1.78 Mpc. Crucially, both long- and short-term variability were seen, suggesting this is a luminous accretion-powered XRB. Here we revisit this source using new, high quality XMM-Newton observations to investigate its spectral and temporal behaviour.
2 The XMM-Newton observations and preliminary data analysis
NGC 55 was observed during revolution 354 of XMM-Newton on 2001 November 14 and 15. This paper focuses on data from the European Photon Imaging Camera (EPIC, Turner et al. 2001; Strüder et al. 2001) taken in the full window mode and using the thin filter. Two separate observations were made, offset from the centre of the galaxy by 7′ in opposite directions, so as to image the full extent of the galaxy in the EPIC CCD cameras (see Table 1). The second observation commenced 2.2 ks after the end of the first. The data were pipeline processed and reduced using standard tools of xmm-sas software v. 5.4.1. Whilst the instrument background was at a constant low level during the first observation, the second was affected by soft proton flaring towards the end of the exposure. A time filter was used to reject the flaring episode and also to select only those data recorded when all three cameras (MOS-1, MOS-2 and pn) were in operation. This resulted in a net exposure time of 30.4 ks and 21.5 ks of data for the first and second observation respectively with a gap of 6.2 ks between the two data sets. In the analysis described below we utilise valid pn events with pattern 0-4 (which have the best energy calibration) but use pattern 0-12 for the MOS-1 and MOS-2 cameras.
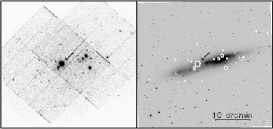
Images were produced in the 0.3–10.0 keV energy band for each observation and for each camera and were then combined using the emosaic SAS task. The resulting mosaiced X-ray image is shown in Fig. 1. The figure also shows the corresponding DSS-2 optical image of the galaxy with X-ray contours overlaid. The brightest source in the earlier ROSAT observations retains this distinction in the XMM-Newton observations. We determine its position as RA , Dec (J2000) with an uncertainty of ′′ . Hereafter we employ the source designation XMMU J001528.9-391319.
| Obs ID | RAa | Deca | Date | UTstart |
|---|---|---|---|---|
| 0028740201 | 00 15 46.0 | -39 15 28 | 2001-11-14 | 14:20:08 |
| 0028740101 | 00 14 32.9 | -39 10 46 | 2001-11-15 | 00:24:43 |
| a Epoch J2000 co-ordinates. |
3 The X-ray properties of XMMU J001528.9-391319
3.1 X-ray lightcurve
A background-subtracted source lightcurve based on the combined data from the three EPIC cameras was extracted from each observation in the 0.3–10.0 keV band. For this purpose we used a source cell of radius 52″ together with a nearby background region of the same dimension. In combining the two datasets we have applied a scaling factor of 2.1 to the count rates measured in the second exposure, so as to account for the extra vignetting arising from the large off-axis angle of the source in this observation111This correction was determined via the Ancillary Response Files used in the spectral analysis.. The resulting lightcurve is shown in Fig. 2. The corrected count rate of the source (summed over the three EPIC cameras) varies from 0.5–3.5 count s-1 with considerable temporal structure including a marked upperward drift, a significant level of underlying chaotic activity and pronounced dips. Fig. 3 illustrates the structure of the dips in more detail and shows that a typical dip lasts between 100–300 s and that some of the dips correspond to a 80–90 % reduction in the source flux in the 0.3–10.0 keV band.


The possible spectral variability of the source was next investigated by extracting lightcurves, using the method described above, in three energy bands which optimised the signal to noise ratio: 0.5–1.0 keV (soft), 1.0–2.0 keV (medium) and 2.0–4.5 keV (hard). Fig. 4 shows that the upward drift apparent in the broad-band lightcurve throughout the observation is due largely to changes above 1.0 keV. The dips are present in all three bands although the depth of the dips appears to be somewhat greater in the harder bands, such that the maximum flux diminution approaches 100% in the 2.0–4.5 keV band.

3.2 X-ray spectra

The different data segments222The data selection was carried out using Good Time Interval (GTI) files based on either time or count-rate criteria. used for spectral extraction are illustrated in Fig. 2. These represent different flux states of the source as follows: (I) the initial low, soft spectral state; (II) a relatively steady part of the lightcurve when the flux was at an intermediate level; (III) the highest state reached by the source in the present observations; (IId) and (IIId), the dipping states observed in the first and second exposures respectively.
X-ray spectra were extracted for the different data segments using circular source and background regions of 75′′ and 110′′ radii respectively. The relevant SAS task especget produces a source and background spectrum together with the Ancillary Response File (ARF) and Redistribution Matrix File (RMF) required in the spectral fitting.
The spectral analysis was performed using the HEAsoft X-ray spectral fitting package xspec (v. 11.0.1). Spectral channels were grouped so as to give a minimum of 20 counts per bin, thus ensuring statistics are valid. The pn, MOS-1 and MOS-2 spectra for each data segment were fitted simultaneously, but with free relative normalisations so as to correct for slight calibration differences between the cameras. Spectra were initially extracted in the 0.3–10.0 keV band. However, since very few counts were recorded above 7.0 keV and there were possible calibration uncertainties below 0.5 keV, the spectral fitting was restricted to the 0.5–7.0 keV range.
As a preliminary step, the spectra recorded while the source was in its initial low soft state (state I) were fitted with a simple absorbed powerlaw model. This resulted in a good match to the data ( for 346 degrees of freedom) with parameter values cm-2 and . The former is considerably higher than the line-of-sight column density through our Galaxy ( cm-2; Stark et al. 1992) and may represent the foreground column density within NGC 55 or material intrinsic to the source itself. We also tried a variety of other single-component continuum models but none of these improved upon the powerlaw fit; for example a single-temperature blackbody component yielded , whereas a MCD spectrum gave (for 346 d-o-f in both cases). We also tried the combination of a soft powerlaw plus a MCD component, but we found that the latter component contributed only 10% of the total X-ray flux and the resulting improvement in was not significant ( for 344 d-o-f).
| State | a | APL b | AMCD c | d | /dof | e | f | |
| Best-fitting model | ||||||||
| I | 4.2 | 3.0 | 4.2 | 0.00 | 0.86 | 1615/1436 | 2.2 | 0.85 |
| II | ” | ” | ” | 0.24 | ” | ” | 3.9 | 1.46 |
| III | ” | ” | ” | 0.29 | ” | ” | 4.2 | 1.59 |
| Standard model | ||||||||
| I | 1.6 | 0.05 | 2.0 | 7.21 | 0.41 | 2173/1436 | 2.2 | 0.81 |
| II | ” | 0.56 | ” | ” | ” | ” | 4.2 | 1.57 |
| III | ” | 0.67 | ” | ” | ” | ” | 4.6 | 1.75 |
| a Column density ( cm-2). | ||||||||
| b Powerlaw normalisation ( phot cm-2 s-1). | ||||||||
| c MCD normalisation (, where is the inner disc radius,D the distance to the source and i | ||||||||
| the inclination angle of the disc). | ||||||||
| d MCD inner-disc temperature (keV). | ||||||||
| e Observed 0.5–10.0 keV X-ray flux ( erg cm-2 s-1). | ||||||||
| f Derived 0.5–10.0 keV X-ray luminosity ( erg s-1). | ||||||||
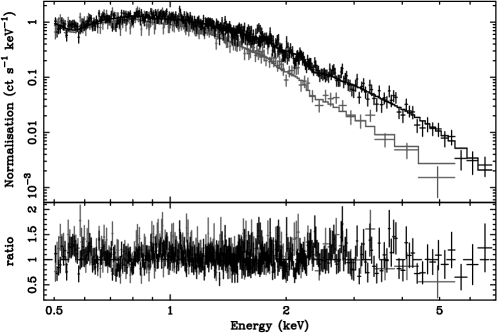
Given the evidence from the lightcurves of the presence of a relatively steady soft component together with a more variable hard component, we next attempted to fit the intermediate and high states of the source (states II and III respectively) with a two component model comprising the soft powerlaw plus an additional hard component. In the event, trials showed that a MCD model provided the best match to the spectral shape of the hard emission. The full analysis was conducted by fitting the spectra for states I, II and III simultaneously with the normalisation of the powerlaw continuum, the slope of the powerlaw continuum, the inner disc temperature of the MCD component and the column density (applied to both spectral components) tied across the three states. The normalisation of the MCD component for each state provided the remaining free parameters of the model. The results of fitting this two-component model are summarised in Table 2, where the errors are quoted at the 90% confidence level for one interesting parameter. This prescription resulted in a reasonable fit to the three spectral datasets (of 1615 for 1436 d-o-f). Fig. 5 illustrates the changing form of the spectrum between states I and II, due to the increase in the MCD component.
The combination of a MCD component with a powerlaw is the spectral model generally employed for BHB systems (McClintock & Remillard 2003). However, in the “standard” BHB spectral model the powerlaw invariably represents the hard tail of the emission rather the softest emission (as above). In essence our best fit model has reversed the role of the two components compared to the standard picture. As a check of our procedure, we have attempted to fit the spectra for the three states with the powerlaw component representing the harder emission in line with the standard model. Paralleling the previous approach, the normalisation of the MCD component, the inner disc temperature , the slope of the powerlaw continuum and the column density (applied to both spectral components) were tied across the three states with the normalisation of the powerlaw component for each state providing the remaining free parameters of the model. The results, which are summarised in Table 2 under the heading “standard model”, confirm our earlier conclusion, namely that the standard description is not the preferred option in this case. In our best fitting model the MCD component provides a good match to the curvature of the hard spectrum whereas the soft emission appears to have a simple powerlaw form (after allowing for modest excess absorption).
The total source luminosity (excluding the dips) increases by a factor over the course of the 60 ks interval of the observation, from erg s-1 in the early stages to a maximum of erg s-1 during the latter part of the observation (Table 2). Here the luminosities are quoted for the broad 0.5–10.0 keV band and on the basis of a distance to NGC 55 of 1.78 Mpc.
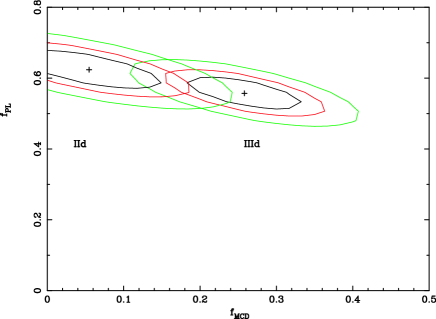
Finally the spectral properties of the dips were investigated by fitting the spectra from states IId and IIId. Since the lightcurve analysis indicates that the relative depth of the dips increases with energy, this immediately rules out models in which the dipping is the result of obscuring material entering the line of sight so as to fully cover both spectral components simultaneously. This is true for either photoelectric absorption or pure electron scattering. We can, however, model the energy dependence of the dipping simply by assuming different “blocking factors” for the two spectral components. For each dip state, the parameter values in the model were fixed at the best-fitting values obtained for the corresponding non-dip data (see Table 2). Two additional parameters, namely the fractional normalisations of the soft powerlaw and MCD components during the dips, and respectively, were then used to fit the dip data. Excellent fits to the observed dip spectra were obtained by this process. Fig. 6 shows the variation in as a function of the two parameters. For state IId the average flux from the powerlaw component recorded during the dip intervals was of the non-dip value but the signal loss for the MCD component was a factor higher. Similarly for state IIId, the blocking of the MCD component is roughly twice that of the powerlaw continuum. Unfortunately the dip spectra are of insufficient quality for the spectral dependence of the blocking factors to be investigated.
4 Discussion
4.1 XMMU J001528.9-391319 as a BHB candidate
Measurements from ROSAT (PSPC and HRI), ASCA, Chandra and XMM-Newton spanning years confirm that XMMU J001528.9-391319 is a persistent highly luminous source (see Fig. 7). The maximum X-ray luminosity observed by XMM-Newton of erg s-1 (0.5–10.0 keV) places the source at the lower boundary of the ULX regime. The variability evident on both long and short timescales is consistent with XMMU J001528.9-391319 being an accretion-powered XRB.

If the source is radiating isotropically at or below the Eddington luminosity, then the implied mass of the compact object is . This compares to the 3 - 18 range inferred for the primary object in the 18 BHBs in our Galaxy and the LMC for which dynamical measurements are available (McClintock & Remillard, 2003). As noted by McClintock & Remillard (2003), the three BHBs classed as persistent sources (Cyg X-1, LMC X-1 and LMC X-3) have high mass secondaries, but generally radiate well below their Eddington limit. The other 15 out of the 18 confirmed BHBs are X-ray novae, and have low-mass secondaries. Three of these novae have maximum observed X-ray luminosities firmly in the ULX regime and were “super-Eddington” at peak flux, but of these three only GRS1915+105 appears similar to XMMU J001528.9-391319, having also been in outburst for more than ten years. However, since the neutron star binary A0535-668 achieved a super-Eddington luminosity at its peak of erg s-1 (White & Carpenter, 1978) it would be unwise to rule out neutron star models for XMMU J001528.9-391319 on energetic grounds alone.
In order to address the underlying nature of XMMU J001528.9-391319 we can ask whether the source shows the spectral characteristics of a stellar-mass BHB. It certainly displays no evidence of the cool ( keV) MCD component seen in more luminous ULXs. In fact, the derived 0.86 keV inner-disc temperature is firmly in the observed regime ( keV) for Galactic black-hole systems in either the thermal-dominated (high/soft) state or the (very high) steep powerlaw state described by McClintock & Remillard (2003). Furthermore, the steep powerlaw slope is also consistent with either of these states (for which typically ). We can extrapolate our best-fitting models to find the flux balance between the two spectral components in the 2 – 20 keV range and use this to try to distinguish between the two states as per McClintock & Remillard (2003). At the start of the observation of the flux arises in the powerlaw continuum (using our adopted model of a single powerlaw fit to the low state data, but see earlier), falling to by the end of the observation. This points to the very-high steep powerlaw state, but the detection of a QPO in the 0.1-30.0 Hz range is really required in order to completely resolve the ambiguity. This very-high state has frequently been associated with the highest accretion rates in Galactic BHBs, consistent with the high luminosity of XMMU J001528.9-391319.
However, there is a potential problem with this interpretation. In XMMU J001528.9-391319 we see the spectral components inverted with respect to the standard spectral description of Galactic BHBs, i.e., the soft end of our spectrum is dominated by the powerlaw continuum, not the MCD component. To the best of our knowledge this is the first example of a BHB candidate in which the powerlaw continuum “re-emerges” at low energies (i.e., below 2 keV) as the MCD continuum turns down. Such behaviour has not been seen previously even in sources with a relatively low absorption column, similar to the determined for XMMU J001528.9-391319; for example, see the recent observations of XTE J1550-564 (Miller et al., 2003) and GX 339-4 (Miller et al., 2004). On the other hand, there are BHBs with higher absorption columns that possess observed spectra in the thermal-dominated state that, if extrapolated below 2 keV, would be dominated by an emergent powerlaw component (e.g. XTE J1550-564 and GRS 1915-105; McClintock & Remillard 2003). Furthermore some BHBs in the steep powerlaw state have spectra dominated by their powerlaw component at all observed energies (e.g. GRO J1655-40). XMMU J001528.9-391319 appears to be a source in which the powerlaw and MCD components are finely balanced in terms of which happens to dominate in any particular spectral regime.
However, the spectrum of XMMU J001528.9-391319 could pose a challenge to the current paradigm for the X-ray emission from BHBs, which has the powerlaw continuum originating in an extended Compton-upscattering medium (the corona) above the accretion disc. This is because an extrapolation of the powerlaw continuum to very soft X-ray energies may be problematic due to a lack of soft seed photons from the accretion disc at energies below the turnover in the MCD continuum. To solve this, one might invoke either a new source of seed photons or recourse to a different process for the production of the soft continuum. For example, synchrotron radiation from the innermost part of a jet, has been discussed as a possible origin of the powerlaw component in some BHBs (e.g. Markoff, Falcke & Fender 2001), although jets may be quenched for BHBs in a high-soft or very-high state (e.g., Fender 2004).
A second estimate of the mass of the compact object can be obtained from the parameters of the MCD model. On the basis of the spectral analysis we determine the peak bolometric flux of the disc component to be and using equation (5) of Makishima et al. (2000), we obtain an inner-disc radius of (cos ) km, where is the inclination of the accretion disc to the line of sight. For a Schwarzschild black-hole this converts to a mass of (cos ) (equation 8, Makishima et al. 2000). In Table 3 we compare the masses derived via the MCD model with the known dynamical mass for five BHBs. We may interpret this tabulation either in terms of 3 out of 5 of these systems having very high inclinations () or the above method tending, in some cases, to underestimate the true black-hole mass by a factor of several (which might indicate that some of these black-holes carry significant angular momentum, Makishima et al. 2000). Interestingly, in the limit cos , the MCD method never overestimates the mass of the black hole. Since our system is dipping this gives us a crude handle on the inclination of its accretion disc. If we conservatively assume (see below), this leads to a mass estimate of , implying that this system may harbour a black-hole more massive than in any confirmed BHB.
| System | () | |
|---|---|---|
| 4U 1543-475 | 8.5 (cos ) | 7.4 – 11.4 |
| XTE J1550-564 | 3.4 (cos ) | 8.4 – 10.8 |
| GRO J1655-40 | 1.7 (cos ) | 6.0 – 6.6 |
| GX 339-4 | 2.7 (cos ) | |
| GRS 1915+105 | 1.2 (cos ) | 10 – 18 |
| a Based on data presented in McClintock & Remillard (2003) |
4.2 XMMU J001528.9-391319 as a dipping BHB candidate
The most interesting feature of XMMU J001528.9-391319 is the dipping apparent in its lightcurve. Such activity has been reported in XRBs including at least two BHBs, e.g., GRO J1655-40 (Orosz & Bailyn 1997) and Cyg X-1 (Kitamoto et al. 1984). To the best of our knowledge, XMMU J001528.9-391319 is the first extragalactic black-hole candidate seen to exhibit dip behaviour.
A variety of models have been put forward to explain dipping activity with the details dependent on whether the system in question is a low-mass XRB (LMXRB) or high-mass XRB (HMXRB). In LMXRBs, dipping is thought to be due to the obscuration of the central X-ray source by absorbing material in the region where the accretion flow from the companion star impacts on the outer accretion disc of the system (White & Swank 1982; White, Nagase, & Parmar 1995). This could be via an interaction of the gas stream from the secondary with the outer edge of the accretion disc, causing a thickening at the rim (e.g., EXO 0748-676; Parmar et al. 1986). Alternatively the obscuration may arise not from a bulge on the accretion disc itself but from a filamentary or clumpy absorbing medium extending above or below the impact region (e.g., GRO J1655-40; Kuulkers et al. 1998b). Often in these cases the dips are observed at certain orbital phases and most of these sources are described as periodic dippers (White & Swank 1982). In contrast, in HMXRBs the absorbing material is generally associated with clouds or “blobs” in the stellar wind of the companion star. In these cases there are often sharp transitions into and out of the dip states, accompanied by variations in the column density, giving evidence for nonuniformity (i.e., clumpy material) in the stellar wind. In the case of Cyg X-1 dips occur preferentially at orbital phase with a secondary peak at , features which have been interpreted respectively in terms of the influence of the stellar wind and of an accretion stream (Kitamoto et al. 1984; Balucinska-Church et al. 2000). Although the X-ray flux from Cyg X-1 significantly photoionizes the stellar wind of its supergiant companion star, HDE 226868, the factor 100–1000 overdensity of the clumps which give rise to the observed dips, explains the near-neutral characteristics of the absorption in this source (Kitamoto et al. 1984; Balucinska-Church et al. 2000).
Since XRBs which show dips but not eclipses typically have inclinations in the range (Frank, King & Lasota 1987), a relatively edge-on configuration seems very likely for XMMU J001528.9-391319. The short 100–300 s duration of the dips mirrors behaviour seen in the BHBs GRO J1655-40 (Kuulkers et al. 2000) and Cyg X-1 (Kitamoto et al. 1984) which are respectively, low-mass and high-mass binary systems. This short timescale constrains the dimensions of the obscuring clumps. For example, if these clumps are orbiting a 20 black-hole, in or just above its accretion disc, with a typical clump encompassing less than 1% of the disc circumference, then the size of a typical clump must be cm at a radius of cm. For unity optical depth to electron scattering the required density is cm-3 at which point the ionization parameter and the material may be quite strongly photoionized (Hatchett, Buff & McCray 1976; Kuulkers et al. 1998a). The orbital timescale of such a clump is s. Although several dip episodes are apparent over a timescale of ks, within the bounds of our limited observations, it is not possible to investigate whether the dips follow a periodic pattern.
Our spectral analysis suggests that the MCD component is more strongly obscured than the powerlaw component during the dips, but we have no constraints on whether the obscuration arises from absorption/scattering (in effect complete blocking) in dense cold clumps or is due to electron scattering in a much hotter medium. A scenario which matches the limited information is one in which the harder thermal disc emission from the inner parts of the accretion disc is almost completely blocked during a dipping episode whereas the more extended softer emission (possibly from a hot corona above the disc, though see the discussion above) is only partially obscured by the same clump. However, there are other plausible explanations of the apparent spectral softening during dips. For example photoionization may have significantly reduced the soft X-ray opacity of the obscuring medium or alternatively the scattering of X-rays in hot clouds above the accretion disc might induce an apparent soft excess during dips (Frank, King & Lasota, 1987). Unfortunately the quality of the X-ray spectra recorded during the dips is too poor for us to be able to distinguish between these possibilities.
5 Conclusions
XMM-Newton observations have revealed a luminous XRB in the nearby galaxy NGC 55. On the basis of its X-ray luminosity and X-ray spectral properties we believe this object is most likely a black-hole system. The lightcurve reveals very interesting spectral variability including, most notably, pronounced dips. Future observations may reveal whether these dips show a pattern of occurrence consistent with an underlying orbital period as is the case for the well-studied BHBs GRO J1655-40 and Cyg X-1. However, detailed investigation of the spectral variations which accompany the dips represents a challenge even for the XMM-Newton instrumentation.
Acknowledgments
AMS and TPR gratefully acknowledge funding from PPARC. This work is based on observations obtained with XMM-Newton , an ESA Science Mission with instruments and contributions directly funded by ESA member states and the USA (NASA). The other X-ray data used in this work were obtained from the Leicester Database and Archive Service (LEDAS) at the Department of Physics and Astronomy, University of Leicester. The second Digitized Sky Survey was produced by the Space Telescope Science Institute, under Contract No. NAS 5-26555 with the National Aeronautics and Space Administration. We are grateful to the anonymous referee for very useful comments on this paper.
References
- Balucinska-Church et al. (2000) Balucinska-Church M., Church M. J., Charles P.A., Nagase F., LaSala J., Barnard R., 2000, MNRAS, 311, 861
- Barnard et al. (2003) Barnard R., Osborne J. P., Kolb U., Borozdin K. N., 2003, A&A, 405, 505
- Begelman (2002) Begelman M. C., 2002, ApJ, 568, L97
- Colbert & Mushotzky (1999) Colbert E. J. M., Mushotzky R. F., 1999, ApJ, 519, 89
- Colbert & Ptak (2002) Colbert E. J. M., Ptak A. F., 2002, ApJS, 143, 25
- Fender (2004) Fender R. P., 2004, astro-ph/0303339
- Frank, King & Lasota (1987) Frank, J., King, A. R., Lasota, J.-P., 1987, A&A, 178, 137
- Haberl & Pietsch (2001) Haberl F., Pietsch W., 2001, A&A, 373, 438
- Hatchett, Buff & McCray (1976) Hatchett S., Buff J., McCray R., 1976, ApJ, 206, 847
- Karachentsev et al. (2003) Karachentsev I. D. et al., 2003, A&A, 404, 93
- King et al. (2001) King A. R., Davies M. B., Ward M. J., Fabbiano G., Elvis M., 2001, ApJ, 552, L109
- Kitamoto et al. (1984) Kitamoto S., Miyamoto S., Tanaka Y., Ohashi T., Kondo Y., Tawara Y., Nakagawa M., 1984, PASJ, 36, 731
- Kong et al. (2002) Kong A. K. H., Garcia M. R., Primini F. A., Murray S. S., Di Stefano R., McClintock J. E., 2002, ApJ, 577, 738
- Kuulkers et al. (1998a) Kuulkers E., Wijnands R., Belloni T., Mendez M., van der Klis M., van Paradijs J., 1998a, ApJ, 494, 753
- Kuulkers et al. (1998b) Kuulkers E., Wijnands R., Belloni T., Mendez M., van der Klis M., van Paradijs J., 1998b, axrs.symp, 324
- Kuulkers et al. (2000) Kuulkers E. et al., 2000, A&A, 358, 993
- La Parola et al. (2003) La Parola V., Damiani F., Fabbiano G., Peres G., 2003, ApJ, 583, 758
- Makishima et al. (2000) Makishima K. et al., 2000, ApJ, 535, 632
- Markoff, Falcke & Fender (2001) Markoff S., Falcke H., Fender R., 2001, A&A, 372, L25
- McClintock & Remillard (2003) McClintock J. E., Remillard R. A., 2003, astro-ph/0306213
- Miller et al. (2003) Miller J.. M., et al., 2003, MNRAS, 338, 7
- Miller et al. (2004) Miller J. M., et al., 2004, ApJ, 601, 450
- Miller & Colbert (2003) Miller M. C., Colbert E. J. M., 2003, astro-ph/0308402
- Orosz & Bailyn (1997) Orosz J. A., Bailyn C. D., 1997, ApJ, 477, 876
- Osborne et al. (2001) Osborne J. P. et al., 2001, A&A, 378, 800
- Parmar et al. (1986) Parmar A. N., White N. E., Giommi P., Gottwald M., 1986, ApJ, 308, 199
- Pietsch, Haberl, & Vogler (2003) Pietsch W., Haberl F., Vogler A., 2003, A&A, 402, 457
- Read et al. (1997) Read A. M., Ponman T. J., Strickland D. K., 1997, MNRAS, 286, 626
- Roberts (1997) Roberts T. P., 1997, PhD thesis, Leicester University
- Roberts & Warwick (2000) Roberts T. P., Warwick R. S., 2000, MNRAS, 315, 98
- Schlegel et al. (1997) Schlegel E. M., Barrett P., Singh K. P., 1997, AJ, 113, 1296
- Shirey et al. (2001) Shirey R. et al., 2001, A&A, 365, L195
- Stark et al. (1992) Stark A. A., Gammie C. F., Wilson R. W., Bally J., Linke R. A., Heiles C., Hurwitz M., 1992, ApJS, 79, 77
- Strüder et al. (2001) Strüder L. et al., 2001, A&A, 365, L18
- Trinchieri, Fabbiano, & Peres (1988) Trinchieri G., Fabbiano G., Peres G., 1988, ApJ, 325, 531
- Tully (1988) Tully R. B., 1988, Nearby Galaxies Catalogue (Cambridge University Press, Cambridge)
- Turner et al. (2001) Turner M. J. L. et al., 2001, A&A, 365, L27
- White & Carpenter (1978) White N. E., Carpenter G F., 1978, MNRAS, 183, 11p
- White & Swank (1982) White N. E., Swank J. H., 1982, ApJ, 253, L61
- White, Nagase, & Parmar (1995) White N. E., Nagase F., Parmar A. N., 1995, in X-Ray Binaries, ed/ W.H.G. Lewin, J. van Paradijs, & E.P.J. van den Heuvel (Cambridge: Cambridge Univ. Press),1