Submillimeter Array observations of ISM in starburst galaxies
Abstract
The Submillimeter Array (SMA) has been under construction at the 4100 m summit of Mauna Kea, Hawaii. The array is going to allow imaging of lines and continuum at sub-arcsecond resolution in submillimeter wavelengths. The status of the array and the results from recent commissioning observations of nearby galaxies are reported.
1. Submillimeter Array, Harvard-Smithsonian Center for Astrophysics, Hilo, HI, 96721-0824, U.S.A.
2. Institute of Astronomy and Astrophysics, Academia Sinica, P.O. Box 23-104, Taipei 106, Taiwan
3. Purple Mountain Observatory, Nanjing 210008, China
4. Physikalishes Institut, Univ. of Köln, 50923, Köln, Germany
1. Introduction
Molecular gas and dust in starburst galaxies are known to be warmer and denser than those in non-starburst environments. Emission lines from highly excited molecules and dust continuum in submillimeter are therefore among the best probes to study neutral ISM in starburst galaxies. Detailed study of starbursts in external galaxies needs a resolution of the order of an arcsecond. An interferometer is necessary to achieve this resolution in submillimeter. However, there has not been a submillimeter interferometer since the pioneering JCMT–CSO interferometry (c.f. Wiedner 2002). SMA is going to be the first full-time submillimeter interferometer with fast imaging capability of eight antennas. Though still in construction and testing phase, the array has recently started its initial observations of galaxies as reported here. Another contribution by Iono et al. in these proceedings shows preliminary results of more distant starbursts.
2. SMA overview
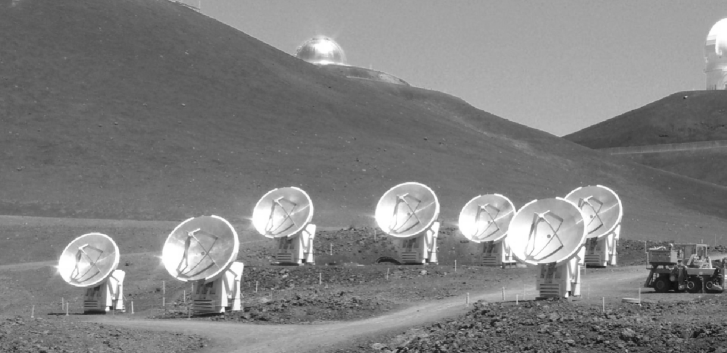
SMA is a joint project between CfA and ASIAA to build the first full-time interferometer with submillimeter capability at the summit of Mauna Kea. The first SMA antenna arrived at the site in 1999, and the eighth antenna arrived in 2003. The array has been undergoing various tests for commissioning. Fringes were first detected on the entire 28 baselines on Nov. 06, 2003. The dedication of the SMA is in late November 2003. Figure 1 shows the SMA in fall 2003.
Table 1 summarizes SMA parameters, with some values being those expected at the time of dedication. The array consists of eight 6-meter antennas each with surface accuracy of about 12 m. The antennas can be placed on any of 24 pads that provide a maximum baseline of 500 m or maximum resolution of 0.5–0.1 arcsec in 200 – 900 GHz bands. Up to eight receivers can be installed on each antenna to cover most atmospheric windows in submillimeter wavelengths. Our three initial receivers currently installed are for 230, 345, and 690 GHz bands. The digital correlators provide a bandwidth of 2 GHz and a resolution of 0.2–0.8 MHz.
The initial reduction of SMA data is made using MIR, which is an IDL-based package kindly provided from Caltech and is under development in collaboration with the OVRO group. The data are then processed in reduction packages such as AIPS and MIRIAD.
| Antennas | Eight 6 m, rms 12 m, CFRP back structure |
|---|---|
| Operating frequency | 200 – 900 GHz |
| Receivers | up to 8 per antenna, dual freq./pol. capable |
| Initial receivers | 230, 350, 650 GHz bands |
| Array configuration | 24 pads on 4 Reuleaux triangles |
| Baselines | 8 – 508 m, 28 baselines per configuration |
| Spatial resolution | up to 0.5 – 0.1 arcsec |
| Filed of view | 60 – 14 arcsec (FWHP) |
| Bandwidth | 2 GHz (4 GHz via sideband separation) |
| Spectral resolution | 0.8 – 0.2 MHz/channel. 3k–12k channels per sideband |
| Site | Mauna Kea, Hawaii. 155∘W, 20∘N, 4100 m |
| Web site | http://sma-www.cfa.harvard.edu |
3. Initial observations of nearby galaxies with SMA
We observed the nucleus of M51 and M83 in the course of SMA commissioning. The choice of the targets was largely determined by the timing when the array became operational, the CO brightness of the sources, and their narrow line widths that fit in our 300–600 MHz bandwidth at the time of the observations.
3.1. M51
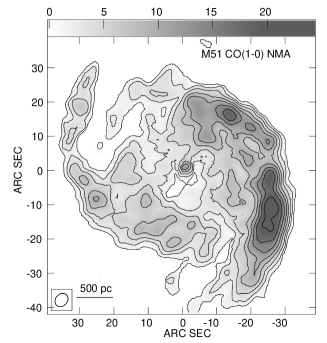
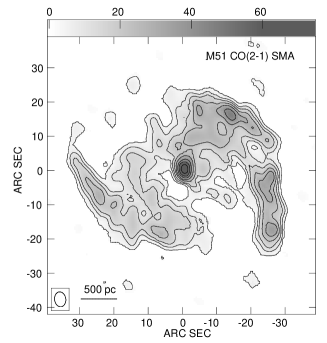
M51 was observed in February 2002, and was the first galaxy observed with 5 antennas at SMA. Figure 2 compares the central 1 arcmin of M51 as observed in CO(1–0) at NMA (Sakamoto et al. 1999) and as observed in CO(2–1) at SMA. The two arrays provided roughly the same field of view and the same resolution (4′′). The overall spiral morphology is similar, assuring the validity of the SMA observations. At the nucleus, however, it is immediately clear that the molecular gas in the central few 100 pc is more highly excited than the gas elsewhere. Though M51 is not a starburst galaxy, the example here demonstrates SMA’s capability to provide valuable information on the conditions of ISM through observations of higher excitation lines. We made further observations of the galaxy in 2003 in CO(3–2); the results are going to be reported in Matsushita et al. (2004).
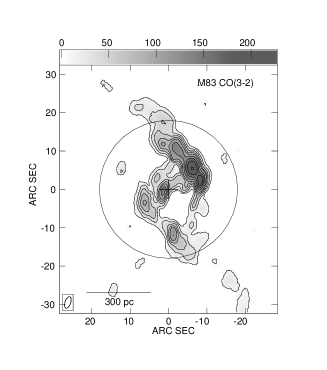
3.2. M83
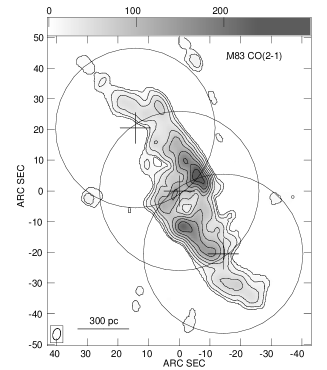
The barred starburst galaxy M83 was observed in the spring of 2003 with 5 antennas. We did the first mosaic observations at SMA in CO(2–1) in order to better observe the gas distribution along the stellar bar. We also observed CO(3–2) with a single pointing at the starburst nucleus as one of our first CO(3–2) observations of galaxies. Figure 3 shows the CO(2–1) mosaic and the CO(3–2) map. The maps clearly show the typical gas morphology in barred galaxies; a pair of gas ridges at the leading side of the stellar bar and a nuclear ring of pc diameter. The high sensitivity of SMA allowed us to detect CO(2–1) emission between the gas ridges and the nuclear ring; the emission forms a parallelogram shape together with the pair of gas ridges. This component is likely the ‘spray’ gas that traveled through a gas ridge, passed the connecting point of the ridge and the nuclear ring, and is now going back to the other gas ridge. The gas in the observed region will eventually be funneled to the nucleus to sustain the nuclear starburst. The starburst in this galaxy is mainly on the ‘starburst arc’ (Harris et al. 2001) which is just inside the nuclear ring of molecular gas. It is notable that little molecular gas is seen on the starburst arc. M83 has two nuclei 3′′ apart (Thatte et al. 2000). Our data show that one of them is off the dynamical center and has high-velocity gas, which is the peak next to the cross in the CO(3–2) map. The dynamical perturbation from this off-center nucleus may have played a role in triggering the starburst. Further analysis is reported in Sakamoto et al. (2004).
Acknowledgments.
SMA is made possible by the dedication of a large number of people. We are grateful to all those who contributed to the project.
References
Harris, J. et al. 2001, AJ, 122, 3046
Matsushita, S. et al. 2004, submitted to ApJL.
Sakamoto, K., Okumura, S., Ishizuki, S., & Scoville, N. Z. 1999, ApJS, 124, 403
Sakamoto, K. et al, 2004, ApJL in press (astro-ph/0403145)
Thatte, N., Tecza, M., & Genzel, R. 2000, A&A, 364, L47
Wiedner, M. C. et al. 2002, ApJ, 581, 229