Observational constraints on cosmology from
modified Friedmann equation
Abstract
Recent measurements of type Ia supernovae as well as other concordant observations suggest that the expansion of our universe is accelerating. A dark energy component has usually been invoked as the most feasible mechanism for the acceleration. However, the effects arising from possible extra dimensions can mimic well the role of a dark energy through a modified Friedmann equation. In this work, we investigate some observational constraints on a scenario in which this modification is given by . We mainly focus our attention on the constraints from recent measurements of the dimensionless coordinate distances to type Ia supernovae and Fanaroff-Riley type IIb radio galaxies compiled by Daly and Djorgovski (2003) and the X-ray gas mass fractions in clusters of galaxies published by Allen et al. (2002,2003). We obtain the confidence region on the power index of the modificative term and the density parameter of the universe from a combined analysis of these databases. It is found that and , at the 95.4% confidence level, which is consistent within the errors with the standard CDM model. These parameter ranges give a universe whose expansion swithes from deceleration to acceleration at a redshift between 0.52 to 0.73.
1 Introduction
The Hubble expansion, the Cosmic Microwave Background Radiation(CMBR), the primordial Big Bang Nucleosynthesis and the structure formation are the four pillars of the standard Big Bang cosmology. Recent years, it seems that all these cornerstoness combined to point out that the expansion of the universe is speeding up rather than slowing down (for a recent review see Peebles and Ratra 2003). The main evidence comes from the recent well known distance measurements of some distant Type Ia supernovae (Perlmutter et al. 1998, 1999; Riess et al. 1998, 2001). Possible explanations for such an acceleration include: a cosmological constant (Weinberg 1989; Carroll et al. 1992; Krauss and Turner 1995; Ostriker and Steinhardt 1995; Chiba and Yoshii 1999), a decaying vacuum energy density or a time varying -term (Ozer and Taha 1987; Vishwakarma 2001; Alcaniz and Maia 2003; Jain, Dev and Alcaniz 2003), an evolving scalar field (referred to by some as quintessence: Ratra and Peebles 1988; Caldwell et al. 1998; Wang and Lovelace 2001; Li, Hao and Liu 2002; Weller and Albrech 2002; Li et al. 2002a,b; Chen and Ratra 2003; Mukherjee et al. 2003), the phantom energy, in which the sum of the pressure and energy density is negative (Caldwell 2002; Hao and Li 2003a,b; Dabrowski et al. 2003), the so-called “X-matter” (Turner and White 1997; Zhu 1998,2000; Waga and Miceli 1999; Podariu and Ratra 2001; Zhu, Fujimoto and Tatsumi 2001; Sereno 2002; Alcaniz, Lima and Cunha 2003; Lima, Cunha and Alcaniz 2003), and the Chaplygin gas (Kamenshchik et al. 2001; Bento et al. 2002; Alam et al. 2003; Alcaniz, Jain and Dev 2003; Dev, Alcaniz and Jain 2003; Silva and Bertolami 2003; Makler et al. 2003). All the above mechanisms for accelerating are obtained by introducing a new hypothetical energy component with negative pressure – the dark energy.
On the hand, many models have appeared that make use of the very ideas of branes and extra dimensions to obtain an accelerating universe (Randall and Sundrum 1999a,b; Deffayet et al. 2002; Avelino and Martins 2002; Alcaniz, Jain and Dev 2002; Jain, Dev and Alcaniz 2002). The basic idea behind these braneworld cosmologies is that our observable universe might be a surface or a brane embedded in a higher dimensional bulk spacetime in which gravity could spread (Randall 2002). The bulk gravity see its own curvature term on the brane which accelerate the universe without dark energy. Here we are concerned with the cosmological model from the modified Friedmann equation as follows
| (1) |
Freese and Lewis (2002) showed the above term proportional to (dubbed as Cardassion term by the authors) may arise as a consequence of embedding our observable universe as a (3+1)-dimensional brane in extra dimensions, though an elegant and unique 5-dimensional energy-momentum tensor that gives rise to equation (1) has not yet been found. If , the new term dominates at late times which implies a modification of gravity at very low energy scales. Particularly, if , it gives rise to a positive acceleration. Note that, in this scenario, although the universe is flat and accelerating, it contains matter (and radiation) only without any dark energy contribution.
The main goal of this paper is to set observational constraints on this Cardassian expansion model and check whether it is consistent with current cosmological data. We perform a combined analysis of data including the dimensionless coordinate distances to type Ia supernovae (SNeIa) and Fanaroff-Riley type IIb (FRIIb) radio galaxies compiled by Daly and Djorgovski (2003) and the X-ray gas mass fraction in clusters of galaxies published by Allen et al. (2002,2003). These results are timely and complementary to the previous constraints from the angular size of high- compact radio sources (Zhu and Fujimoto 2002), CMBR (Sen and Sen 2003a,b), the SNeIa database (Zhu and Fujimoto 2003a; Wang et al. 2003; Cao 2003; Szydlowski and Czaja 2003; Godlowski and Szydlowski 2003), large scale structures (Multamaki et al. 2003) and from optical gravitational lensing surveys (Dev, Alcaniz and Jain 2003).
The plan of the paper is as follows. In the next section, we provide a brief summary of the Cardassian expansion scenario relevant to our work. Constraints from dimensionless coordinate distance data of SNeIa and FRIIb radio galaxies are discussed in section 3. In section 4 we discuss the bounds imposed by X-ray gas mass fraction in galaxy clusters. Finally, we present a combined analysis, our concluding remarks and discussion in section 5.
2 The Cardassian model: basic equations
In the modified Friedmann equation Eq.(1), there are two model parameters, the power index and the coefficient of the Cardassian term. Instead of , it is convenient to use the redshift , at which the two terms inside the bracket of Eq.(1) are equal, as the second parameter of the model, i.e, . If we further ignore the radiation components in the universe that are not important for the cosmological tests considered in this work, we have , and
| (2) |
where is the present matter density of the universe. Hence Evaluating the Hubble parameter today gives Conventionally, the critical density of the universe is , where is the present day Hubble constant in units of 100 , and the present matter density of the universe is written in terms of as , where is the standard matter density parameter. Now in Cardassian model, matter alone makes the universe flat, which means that and is the critical density of the universe in Cardassian expansion model (Freese and Lewis 2002)
| (3) |
and the standard matter density parameter of the universe is (note that , as expected for a flat universe). As it shown in equation (3), for some combinations of the parameters and , the critical density of the Cardassion model can be much lower than the one of the standard Friedmann model. In other words, in the context of Cardassian model, it is possible to make the dynamical estimates of the quantity of matter that consistently point to compatible with the observational evidence for a flat universe from CMB observations and the flatness prediction made by inflationary cosmology without any dark energy component (see Freese and Lewis 2002 for more details).
Now we evaluate the dimensionless coordinate distance, , the angular diameter distance, , and the luminosity distance, , as a function of redshift as well as the parameters of the Cardassian model. The three distances are simply related to each other by . Following the notation of Peebles (1993), we define the redshift dependence of the Hubble paramter as . Parametrizing the model as , we get function as
| (4) |
We note that the quintessence models with a constant equation of state () for the dark energy component give rise to the same presented here. One can make the following identification: , such that correponds to a CDM model. As far as any observation that involves only , the two models predict the same effects on the observation (Freese 2003). It is straightforward to show that the distances are given by
| (5) |
3 Constraints from the dimensionless coordinate distance data
Recently, Daly and Djorgovski (2003) compiled a large database of the dimensionless coordinate distance measurements estimated from the observations of SNeIa and FR IIb radio galaxies. The author used the database to derive the expansion rate of the universe as a function of redshift, , and the acceleration rate of the universe as a function of redshift, (Daly and Djorgovski 2003). We use this sample to give an observational constraint on the model parameters, and .
The SNeIa measurements include the 54 supernovae in the “primary fit C” used by Perlmutter et al. (1999), the 37 supernovae published by Riess et al. (1998), and the so far highest redshift supernova 1997ff presented by Reiss et al. (2001). The standard procedures of Perlmutter et al. (1999) and Riess et al. (1998) were used to determine the dimensionless coordinate distances to the supernovae. The apparent bolometric magnitude of a standard candle with absolute bolometric magnitude is related to the luminosity distance by . Then using the relation of equation (5) the B-band magnitude-redshift relation can be written as
| (6) |
where is the “Hubble-constant-free” -band absolute magnitude at maximum of a type Ia supernova (SNIa). Then the above relation is used to determine for each SNIa. There are 14 SNeIa that are present in both the Perlmutter et al. (1999) and Riess et al. (1998) samples, for which we will use the average values of with appropriate error bars (see Table 4 of Daly and Djorgovski 2003). Therefore we totally have 78 SNIa data points that are shown as solid circles in Figures 1 and 2.
The use of FRIIb radio galaxies to determine the angular size distance or dimensionless coordinate distance of them at different redshifts was first proposed by Daly (1994) (see also Guerra, Daly, and Wan 2000; Daly and Guerra 2002; Podariu et al. 2003; Daly and Djorgovski 2003). This method consists in a comparison of two independent measurements of the average size of the lobe-lobe separation of FR IIb sources, namely, the mean size of the full population of radio galaxies at similar redshift and the source average (over its entire life) size , that is determined via a physical model describing the evolution of the sources. The basic idea is that must track the value of , such that the ratio is assumed to be a constant: , where is one parameter entering into the ratio . can be determined using an iterative technique, as described in detail by Guerra, Daly and Wan (2000) and Daly and Guerra (2002). We use the values of for 20 FRIIb radio galaxies obtained using the best fit to both the radio galaxy and supernova data (see Table 1 of Daly and Djorgovski 2003), that are shown as empty squares in Figure 1 and 2. The best fit values of and and their error bars are included in Table 2 of Daly and Djorgovski (2003), i.e., and . In determining the error bar on , the uncertainties of , and have been included (Daly and Djorgovski 2003). It is very important to consider whether significant covariance exists between the different parameters determined by the fit (Daly and Guerra 2002). In the framework of quintessence model, Daly and Guerra (2002) have estimated the likelihood contours in the plane and the plane respectively (see Figure 3 and 4 of their paper). As was pointed out in section 2, the Cardassion scenario is equivalent to quintessence model by identifying . Therefore their results are exactly appropriate to our parameters and : i.e., there is no covariance between and ().
We determine the model parameters and through a minimization method. The range of spans the interval [-1,1] in steps of 0.01, while the range of spans the interval [0, 1] also in steps of 0.01.
| (7) |
where refers to the theoretical prediction from equation (5), is the observed dimensionless coordinate distances of SNeIa and FRIIb radio galaxies, and is the uncertainty ( refers to the th data point, with totally 98 data). The summation is over all of the observational data points.
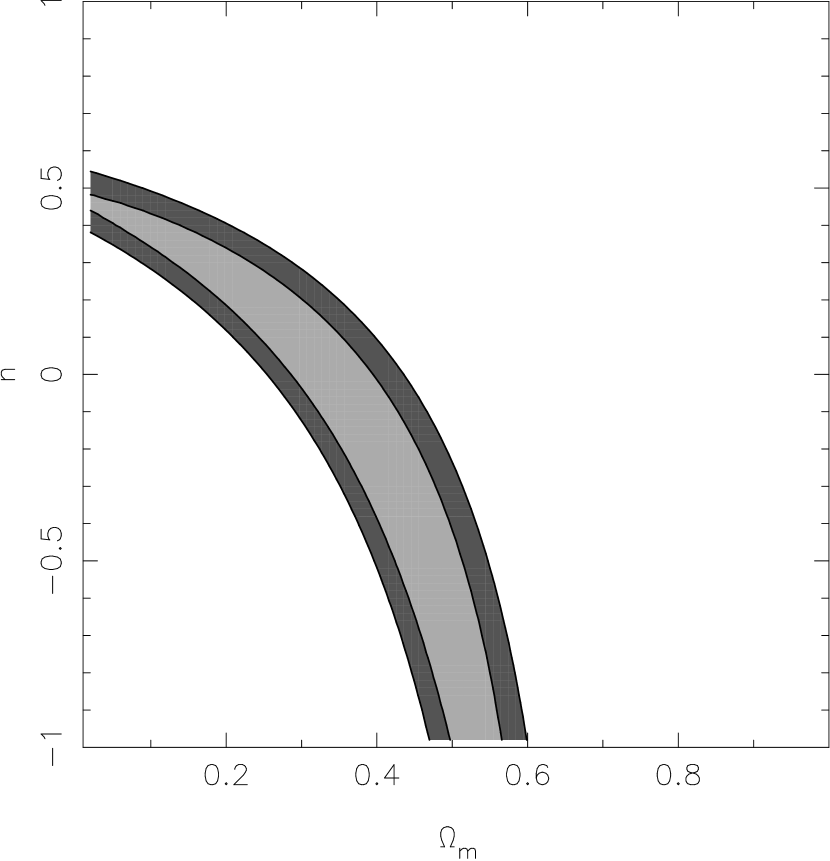
The results of our analysis for the Cardassian expansion model are displayed in Figure 3. We show 68.3% and 95.4% confidence level contours in the (,) plane using the lower shaded and the lower plus darker shaded areas respectively. The best fit happans at and . It is clear from the figure, that the dimensionless coordinate distance test alone weakly constrains the Cardassian expansion model. Only models with and are excluded at the confidence level. However, this already strongly suggest an accelerating universe (because ). Moreover, as we shall see in Sec.5, when we combine this test with the X-ray gas mass fraction test, we could get very stringent constraints on the Cardassian scenario.
Recently, Knop et al. (2003) investigated in detail the effects of various systematic errors of SNeIa on the cosmological measurements (section 5 of their paper). Their main results were summarized in Table 9 (Knop et al. 2003), for example, the differences in lightcurve fitting methods can change the flat universe value of by and () by 0.02. Other systematic errors considered include non-type Ia SN contamination, Malmquist bias, -corrections, SN colors, dust extinction and gravitational lensing etc. All identified systematic errors together give rise to and () = 0.09, which are smaller than than the current statistical uncertainties of SNeIa (Knop et al. 2003).
4 Constraints from the galaxy clusters X-ray data
Clusters of galaxies are the largest virialized systems in the universe, and their masses can be estimated by X-ray and optical observations, as well as gravitational lensing measurements. A comparison of the gas mass fraction, , as inferred from X-ray observations of clusters of galaxies to the cosmic baryon fraction can provide a direct constraint on the density parameter of the universe (White et. al. 1993). Moreover, assuming the gas mass fraction is constant in cosmic time, Sasaki (1996) show that the measurements of clusters of galaxies at different redshifts also provide an efficient way to constrain other cosmological parameters decribing the geometry of the universe. This is based on the fact that the measured values for each cluster of galaxies depend on the assumed angular diameter distances to the sources as . The ture, underlying cosmology should be the one which make these measured values to be invariant with redshift (Sasaki 1996; Allen at al. 2003).
Using the Chandra observational data, Allen et al. (2002; 2003) have got the profiles for the 10 relaxed clusters. Except for Abell 963, the profiles of the other 9 clusters appear to have converged or be close to converging with a canonical radius , which is defined as the radius within which the mean mass density is 2500 times the critical density of the universe at the redshift of the cluster (Allen et al. 2002, 2003). The gas mass fraction values of these nine clusters at (or at the outermost radii studied for PKS0745-191 and Abell 478) are shown in Figure 4. We will use this database to constrain the Cardassian expansion models. Following Allen et al. (2002), we have the model function as
| (8) |
where the bias factor (Bialek et al. 2001; Allen et al. 2003) is a parameter motivated by gas dynamical simulations, which suggest that the baryon fraction in clusters is slightly depressed with respect to the Universe as a whole (Cen and Ostriker 1994; Eke, Navarro and Frenk 1998; Frenk et al. 1999; Bialek et al. 2001). The term represents the change in the Hubble parameter from the defaut value of and the ratio accounts for the deviations of the Cardassian model from the default standard cold dark matter (SCDM) cosmology.
Again, we determine the Cardassian model parameters and through a minimization method. We constrain (O’Meara et al. 2001) and , the final result from the Hubble Key Project by Freedman et al. (2001). The range of spans the interval [-1,1] in steps of 0.01, while the range of spans the interval [0, 1] also in steps of 0.01. The difference between the model function and SCDM data is then (Allen et al. 2003)
| (9) |
where refers to equation (8), is the measured with the defaut cosmology (SCDM and ) and is the symmetric root-mean-square errors ( refers to the th data point, with totally 9 data). The summation is over all of the observational data points.
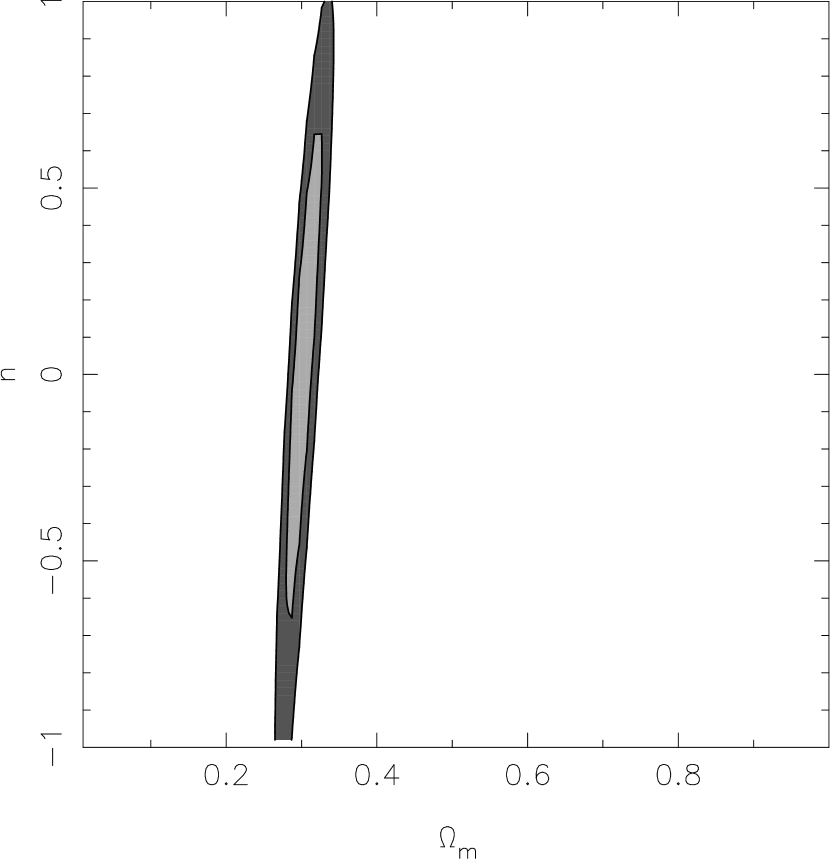
The results of our analysis for the Cardassian expansion model are displayed in Figure 5. We show 68.3% and 95.4% confidence level contours in the (,) plane using the lower shaded and the lower plus darker shaded areas respectively. The best fit happans at and . It is clear from the figure, that although the X-ray gas mass fraction test alone constrains the density parameter very stringently, it weakly limits the Cardassian power index . However, when comparing Figure 4 with Figure 3, we can expect the X-ray gas mass fraction test to break the degeneracy presented in the dimensionless coordinate distance test of last section.
As Figure 5 shown, measurements of of galaxy clusters provide an efficient way to determine . However the uncertainty of the bias factor will lead to a systematic error in this kind of analysis (Allen et al. 2003). Because it linearly scales the X-ray mass fraction in equation (8), lowering (uppering) it by would cause the best fitting value of to reduce (increase) by a similar amount. Another systematic uncertainty comes from the profiles of galaxy clusters: any rise in the values beyond the measuremet radii would cause a corresponding reduction in .
5 Combined analysis, concluding remarks and discussion
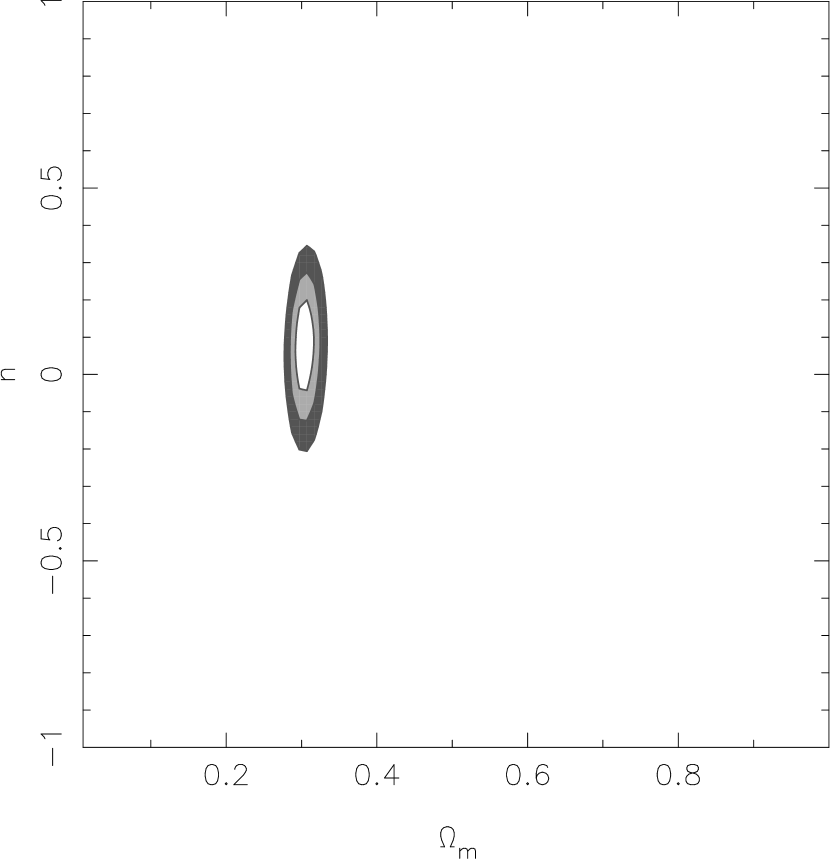
Now we present our combined analysis of the constraints discussed in the previous sections and summarize our results. In Figure 6, we display the 68.3%, 95.4% and 99.7% confidence level contours in the (,) plane from a combination of databases of dimensionless coordinate distances to SNeIa and FRIIb radio galaxies and the X-ray gas mass fraction in clusters of galaxies. The best fit happans at and . As it shown, although the two Cardassion parameters are not very sensitive to the dimensionless coordinate distance data of SNeIa and FRIIb radio galaxies and the Cardassion power index is not sensitive to the X-ray gas mass fraction data of clusters, a combination of the two data sets gives at the 95.4% confidence level that and , a very stringent constraint on the Cardassion expansion scenario.
Given the two model parameters, , and , Zhu and Fujimoto (2003b) derived the redshift and satisfying the relation as follows
| (10) |
where is the redshift at which the two terms inside the bracket of Eq.(1) are equal, while is the redshift at which the universe switches from deceleration to acceleration, or in other words the redshift at which the deceleration parameter vanishes. It was shown (Zhu and Fujimoto 2003b) that, for every value of , there exists a value for the power index of the Cardassian term, , satisfying which makes the turnaround redshift reach the maximum value, . Lower is, higher will be. For the lower bound obtained here, , we have and . In conclusion, our combined analysis result, and at the 95.4% confidence level, suggest a Cardassion expansion universe which swithes from deceleration to acceleration around . However, the modified term of the Friedmann equation would dominate at a redshift around , a little bit later than the expansion turnaround happans (note that, is generally not equal to ), which is simply due to the resulting power index is well below (Zhu and Fujimoto 2003b).
Alternative cosmologies from a modified Friedmann equation may provide a possible mechanism for the present acceleration of the universe congruously suggested by various cosmological observations. In this paper we have focused our attention on one of these scenarios, the so-called Cardassion expansion in which the universe is flat, matter (and radiation) dominated and accelerating but without any dark energy component. We have shown that stringenet constraints on the parameters and , that completely characterize the scenario, can be obtained from the combination analysis of the dimensionless coordinate distance data of SNeIa and FRIIb radio galaxies and the X-ray mass fraction data of clusters. It is natually hopeful that, with a more general analysis such as a joint investigation on various cosmological observations, one could show clearly if this scenario constitutes a feasible alternative to other acceleration mechanisms.
References
- Alam et al. (2003) Alam, U., Sahni, V., Saini, T. D. and Starobinsky, A. A. 2003, MNRAS, sumitted (astro-ph/0303009)
- Alcaniz et al. (2002) Alcaniz, J. S., Jain, D. and Dev, A. 2002, Phys. Rev. D, 66, 067301
- Alcaniz et al. (2003) Alcaniz, J. S., Jain, D. and Dev, A. 2003, Phys. Rev. D, 67, 043514
- Alcaniz et al. (2003) Alcaniz, J. S., Lima, J. A. S. and Cunha, J. V. 2003, MNRAS, 340, L39
- Alcaniz and Maia (2003) Alcaniz, J. S. and Maia, J. M. F. 2003, Phys. Rev. D, 67, 043502
- (6) Allen S.W., Schmidt R.W., Fabian A.C., 2002a, MNRAS, 334, L11
- (7) Allen S.W., Schmidt R.W., Fabian A.C., Ebeling, H. 2003, MNRAS, 342, 287
- Avelino and Martins (2002) Avelino, P. P. and Martins, C. J. A. P. 2002, ApJ, 565, 661
- Bento et al. (2002) Bento, M. C., Bertolami, O and Sen, A. A. 2002, Phys. Rev. D, 66, 043507
- (10) Bialek J.J., Evrard A.E., Mohr J.J., 2001, ApJ, 555, 597
- Caldwell (2002) Caldwell, R. 2002, Phys.Lett.B, 545, 23
- Caldwell et al. (1988) Caldwell, R., Dave, R., and Steinhardt, P. J. 1998, Phys. Rev. Lett., 80, 1582
- Carroll et al. (1992) Carroll, S., Press, W. H. and Turner, E. L. 1992, ARA&A, 30, 499
- (14) Cen R., Ostriker J.P., 1994, ApJ, 429, 4
- (15) Cao, L. 2003, preprint
- Chen and Ratra (2003) Chen, G. and Ratra, B. 2003, ApJ, 582, 586
- Chiba and Yoshii (1999) Chiba, M. and Yoshii, Y. 1999, ApJ, 510, 42
- Dabrowski et al. (2003) Dabrowski, M. P., Stochowiak, T., and Szydlowski, M. 2003, Phys. Rev. D, accepted (hep-th/0307128)
- (19) Daly, R. A. 1994, ApJ, 426, 38
- (20) Daly, R. A. and Djorgovski, S. G. 2003, ApJ, accepted (astro-ph/0305197)
- (21) Daly, R. A., & Guerra, E. J. 2002, AJ, 124, 1831
- (22) Deffayet, C., Dvali, G. and Gabadadze, G. 2002, Phys. Rev. D, 65, 044023
- (23) Dev, A., Alcaniz, J. S. and Jain, D. 2003, astro-ph/0305068
- (24) Dev, A., Jain, D. and Alcaniz, J. S. 2003, Phys. Rev. D, 67, 023515
- (25) Eke V.R., Navarro J.F., Frenk C.S., 1998, ApJ, 503, 569
- (26) Freedman W. et al., 2001, ApJ, 553, 47
- Freese (2003) Freese, K. 2003, Nucl. Phys. B (Proc. Suppl.) 124, 50
- Freese and Lewis (2002) Freese, K. and Lewis, M. 2002, Phys.Lett.B, 540, 1
- (29) Frenk C.S. et al., 1999, ApJ, 525, 554
- (30) Godlowski, W. and Szydlowski, M. 2003, astro-ph/0309569
- (31) Guerra, E. J., Daly, R. A., & Wan, L. 2000, ApJ, 544, 659
- (32) Hao, J. -G. and Li, X. -Z. 2003a, Phys. Rev. D, 67, 107303
- (33) Hao, J. -G. and Li, X. -Z. 2003b, Phys. Rev. D, 68, 043501
- Jain et al. (2002) Jain, D., Dev, A. and Alcaniz, J. S. 2002, Phys. Rev. D, 66, 083511
- Jain et al. (2003) Jain, D., Dev, A. and Alcaniz, J. S. 2003, Class. Quan. Grav. 20, 4163
- Kamenshchik et al. (2001) Kamenshchik, A., Moschella, U. and Pasquier, V. 2001, Phys.Lett.B, 511, 265
- (37) Knop, R. A. et al. 2003, ApJ, accepted (astro-ph/0309368)
- Krauss and Turner (1995) Krauss, L. M. and Turner, M. S. 1995, Gen. Rel. Grav., 27, 1137
- (39) Li, M., Lin, W., Zhang, X. and Brandenberger, R. 2002a, Phys. Rev. D, 65, 023519
- (40) Li, M., Wang, X., Feng, B. and Zhang, X. 2002b, Phys. Rev. D, 65, 103511
- Li et al. (2002) Li, X. -Z., Hao, J. -G. and Liu, D. -J. 2002, Class.Quan.Grav. 19, 6049
- Lima et al. (2003) Lima, J. A. S., Cunha, J. V. and Alcaniz, J. S. 2003, Phys. Rev. D, 68, 023510
- (43) Makler, M., Oliveira, S. Q., & Waga, I. 2003, astro-ph/0306507
- Mukherjee et al. (2003) Mukherjee,P. Banday,A.J. Riazuelo,A. Gorski,K.M. Ratra,B. 2003, ApJ, accepted (astro-ph/0306147)
- Multamaki et al. (2003) Multamaki, T., Gaztanaga, E. and Manera, M. 2003, MNRAS, submitted (astro-ph/0303526)
- (46) O’Meara J.M., Tytler D., Kirkman D., Suzuki N., Prochaska J.X., Lubin D., Wolfe A.M., 2001, ApJ, 552, 718
- Ostriker and Steinhardt (1995) Ostriker, J. P. and Steinhardt, P. J. 1995, Nature, 377, 600
- Ozer and Taha (1987) Ozer, M. and Taha, O. 1987, Nucl. Phys. B287, 776
- Peebles (1993) Peebles, P. J. E. 1993, Principles of Physical Cosmology (Princeton University Press, Princeton, NJ).
- (50) Peebles, P. J. E. and Ratra, B. 2003, Rev. Mod. Phys. 75, 559
- (51) Perlmutter, S. et al. 1998, Nature, 391, 51
- Perlmutter et al. (1999) Perlmutter, S. et al. 1999, ApJ, 517, 565
- (53) Podariu, S. and Ratra, B. 2001, ApJ, 563, 28
- Podariu et al. (2003) Podariu, S., Daly, R. A., Mory, M. P. and Ratra, B. 2003, ApJ, 584, 577
- Ratra and Peebles (1988) Ratra, B. and P.J.E. Peebles, P. J. E. 1988, Phys. Rev. D, 37, 3406
- Randall (2002) Randall, L. 2002, Science, 296, 1422.
- Randall (1999) Randall, L. and Sundrum, R. 1999a, Phys. Rev. Lett., 83, 3370
- Randall (1999) Randall, L. and Sundrum, R. 1999b, Phys. Rev. Lett., 83, 4690
- Riess et al. (1998) Riess, A. G. et al. 1998, AJ, 116, 1009
- Riess et al. (2001) Riess, A. G. et al. 2001, ApJ, 560, 49
- (61) Sasaki, S. 1996, PASJ, 48, L119
- (62) Sen, A. A. and Sen, S. 2003a, ApJ, 588, 1
- (63) Sen, A. A. and Sen, S. 2003b, Phys. Rev. D, 68, 023513
- Sereno (2002) Sereno, M. 2002, A&A, 393, 757
- Silva and Bertolami (2003) Silva, P. T. and Bertolami, O. 2003, ApJ, submitted (astro-ph/0303353)
- (66) Szydlowski, M. and Czaja, W. 2003, astro-ph/0309191
- Turner and White (1997) Turner, M. S. and White, M. 1997, Phys. Rev. D, 56, R4439
- Vishwakarma (2001) Vishwakarma, R. G. 2001, Class.Quan.Grav. 18, 1159
- Waga and Miceli (1999) Waga, I. and Miceli, A. P. M. R. 1999, Phys. Rev. D, 59, 103507
- Wang et al. (2003) Wang, Y., Freese, K., Gondolo,P. and Lewis, M. 2003, ApJ, accepted (astro-ph/0302064)
- (71) Wang, Y. and Lovelace, G. 2001, ApJ, 562, L115
- Weinberg (1989) Weinberg, S. 1989, Rev. Mod. Phys. 61, 1
- (73) Weller, J. and Albrecht, A. 2002, Phys. Rev. D, 65, 103512
- (74) White S.D.M., Navarro J.F., Evrard A.E., Frenk C.S., 1993, Nature, 366, 429
- Zhu (1998) Zhu, Z. -H. 1998 A&A, 338, 777
- Zhu (2000) Zhu, Z. -H. 2000, Int.J.Mod.Phys. D9, 591
- Zhu and Fujimoto (2002) Zhu, Z. -H. and Fujimoto, M. -K. 2002, ApJ, 581, 1
- Zhu and Fujimoto (2003) Zhu, Z. -H. and Fujimoto, M. -K. 2003a, ApJ, 585, 52
- Zhu and Fujimoto (2004) Zhu, Z. -H. and Fujimoto, M. -K. 2003b, ApJ, accepted.
- Zhu, Fujimoto and Tatsumi (2001) Zhu, Z. -H., Fujimoto, M. -K. and Tatsumi, D. 2001, A&A, 372, 377