The Star Formation Rate of the Universe at from the Hubble Ultra Deep Field
Abstract
We determine the abundance of -band drop-outs in the recently-released HST/ACS Hubble Ultra Deep Field (UDF). Since the majority of these sources are likely to be galaxies whose flux decrement between the F775W -band and F850LP -band arises from Lyman-alpha absorption, the number of detected candidates provides a valuable upper limit to the unextincted star formation rate at this redshift. We demonstrate that the increased depth of UDF enables us to reach an limiting magnitude of (equivalent to at , or for the -drop population), permitting us to address earlier ambiguities arising from the unobserved form of the luminosity function. We identify 54 galaxies (and only one star) at with over the deepest 11 arcmin2 portion of the UDF field. The characteristic luminosity () is consistent with values observed at . The faint end slope () is less well constrained, but is consistent with only modest evolution. The main change appears to be in the number density (). Specifically, and regardless of possible contamination from cool stars and lower redshift sources, the UDF data support our previous result that the star formation rate at was approximately less than at (Stanway, Bunker & McMahon 2003). This declining comoving star formation rate ( at at for a salpeter IMF) poses an interesting challenge for models which suggest that star forming galaxies at reionized the universe. The short-fall in ionizing photons might be alleviated by galaxies fainter than our limit, or a radically different IMF. Alternatively, the bulk of reionization might have occurred at .
keywords:
galaxies: evolution – galaxies: formation – galaxies: starburst – galaxies: individual: SBM03#1 – galaxies: high redshift – ultraviolet: galaxies1 Introduction
There has been considerable progress over the past decade in locating galaxies and QSOs at high redshifts. These sources have enabled us to probe the Universe at early epochs where its physical characteristics are fundamentally different from those at the present epoch. Observations of the most distant QSOs (Becker et al. 2001, Fan et al. 2002) show near-complete absorption at wavelengths shortward of Lyman- (Gunn & Peterson 1965), suggesting an optical depth in this line that implies a smooth neutral hydrogen fraction which is increasing rapidly with redshift at this epoch. Temperature-polarization cross-correlations in the cosmic microwave background from WMAP indicate that the Universe was completely neutral at redshifts of (Kogut et al. 2003).
Although there is a growing consensus that cosmic reionization occurred in the redshift interval , a second key question is the nature of the sources responsible for this landmark event. Optical and X-ray studies to suggest the abundance of active galactic nuclei (AGN) at early epochs is insufficient when account is taken of the relevant unresolved backgrounds (Barger et al. 2003). A more promising source is star-forming galaxies whose early ancestors may be small and numerous. Along with the escape fraction for the ionizing photons from the massive and short-lived OB stars in such sources, a major observational quest in this respect is a determination of the global star formation rate at early epochs.
In previous papers, our group has extended the Lyman-break technique (Steidel, Pettini & Hamilton 1995; Steidel et al. 1996) to address this question. Using the Advanced Camera for Surveys (ACS, Ford et al. 2002) on the Hubble Space Telescope (HST) with the sharp-sided SDSS F775W () and F850LP () filters, we located “-drop” candidates with 25.6 at for further study. In a series of papers, we have shown that this selection technique can effectively locate galaxies using ACS images from the HST Treasury “Great Observatory Origins Deep Survey” (GOODS; Giavalisco & Dickinson 2002). On the basis of GOODS-South photometric catalogues published by Stanway, Bunker & McMahon (2003, hereafter Paper I), spectroscopic follow-up using Keck/DEIMOS and Gemini/GMOS field demonstrated our ability to find high redshift galaxies (Bunker et al. 2003, hereafter Paper II; Stanway et al. 2004a). To address potential cosmic variance issues, we performed a similar analysis in the GOODS-North field, which yielded a consistent estimate of the surface density of star forming sources (Stanway et al. 2004b, hereafter Paper III).
Although our initial study (Papers I-III) revealed the importance of ascertaining the difficult spectroscopic verifications, and highlighted the problem of contamination from Galactic stars, we nonetheless determined that the abundance of confirmed star forming galaxies at must be less than that expected on the basis of no evolution from the well-studied Lyman break population (Steidel et al. 1999). Working at the robustly-detected bright end of the luminosity function, in Paper I we showed that the comoving star formation density in galaxies with is less at than at . Our flux limit corresponds to at , equivalent to at . In Papers I–III we restricted our analysis to luminous galaxies (where we take “luminous” to mean for the rest-UV). Other groups have claimed less dramatic evolution or even no evolution in the volume-averaged star formation rate, based on the same fields (Giavalisco et al. 2004; Dickinson et al. 2004) and similar HST/ACS data sets (Bouwens et al. 2003; Yan, Windhorst & Cohen 2003), but these groups work closer to the detection limit of the images and introduce large completeness corrections for the faint source counts. The major uncertainty in converting the abundance of our spectroscopically-confirmed sample in the GOODS fields into a comoving star formation rate is the form of the luminosity function for faint, unobserved, sources. As discussed in Paper III, if the faint end of the luminosity function at was steeper than that at lower redshift, or if was significantly fainter, a non-evolving star formation history could perhaps still be retrieved.
The public availability of the Hubble Ultra Deep Field (UDF; Beckwith, Somerville & Stiavelli 2003) enables us to address this outstanding uncertainty. By pushing the counts and the inferred luminosity function of -band drop-outs at to a limiting lower luminosity equivalent to one well below for the population, it is possible to refine the integrated star formation rate at . In this paper we set out to undertake the first photometric analysis of -drops in the UDF. Our primary goal is to understand the abundance of fainter objects with characteristics equivalent to those of sources and address uncertainties in the global star formation rate at this redshift.
The structure of the paper is as follows. In Section 2 we describe the imaging data, the construction of our catalogues and our -drop selection. In Section 3 we discuss the luminosity function of star-forming sources, likely contamination on the basis of earlier spectroscopic work, and estimate the density of star formation at . Our conclusions are presented in Section 4. Throughout we adopt the standard “concordance” cosmology of , , and use . All magnitudes are on the system (Oke & Gunn 1983).
2 HST Imaging: Observations and -Drop Selection
2.1 HST/ACS Observations
The Hubble Ultra Deep Field (UDF) is a public HST survey made possible by Cycle 12 STScI Director’s Discretionary Time programme GO/DD-9978 executed over September 2003 – January 2004. For the present program, the HST has imaged a single ACS Wide Field Camera (WFC) tile (11.5 arcmin2) for 400 orbits in 4 broad-band filters (F435W -band for 56 orbits; F606W -band for 56 orbits; F775W -band for 144 orbits; F850LP -band for 144 orbits). The UDF field lies within the Chandra Deep Field South (CDF-S) with coordinates RA=, Decl.= (J2000). As the UDF represents the deepest set of images yet taken, significantly deeper than the -band exposures of the Hubble Deep Fields (Williams et al. 1996; 1998), and adds the longer-wavelength -band, it is uniquely suited to the goals of our program.
The WFC on ACS has a field of , and a pixel scale of . The UDF lies within the survey area of GOODS-South area (Giavalisco et al. 2004), surveyed using ACS with the same filters to shallower depth (3,2.5,2.5 & 5 orbits in the , , & bands). The UDF was observed at two main orientations differing by 90 degrees, and within each of these data was taken in 2 blocks rotated by 4 deg (orientations of 310,314,40 & 44 deg). A 4-point dither box spanning 0.3 arcsec was used, with half-pixel centres to improve the sampling. During each “visit”, there were 3 larger 3 arcsec dithers to span the WFC inter-chip gap.
For our analysis we use the reduced UDF data v1.0 made public by STScI on 09 March 2004. The pipeline reduction involved bias/dark current subtraction, flat-fielding, and the combination of background-subtracted frames rejecting cosmic ray strikes and chip defects. The resulting reduced images had been “drizzled” (Fruchter & Hook 2002) using the “MultiDrizzle” software (Koekemoer et al. 2004) on to a finer pixel scale of , to correct for geometric distortion and to improve the sampling of the point spread function (PSF). The UDF data has been placed on the same astrometric system as the GOODSv1.0 images of the UDF111Available from ftp://archive.stsci.edu/pub/hlsp/goods/v1. The photometric zeropoints adopted were those provided by STScI for the UDF v1.0 data release: 25.673, 26.486, 25.654 & 24.862 for the , , & filters, where . We have corrected for the small amount of foreground Galactic extinction toward the CDFS using the COBE/DIRBE & IRAS/ISSA dust maps of Schlegel, Finkbeiner & Davis (1998). The optical reddening is , equivalent to extinctions of & .
2.2 Construction of Catalogues
Candidate selection for all objects in the field was performed using version 2.3.2 of the SExtractor photometry package (Bertin & Arnouts 1996). As we are searching specifically for objects which are only securely detected in , with minimal flux in the -band, fixed circular apertures in diameter were trained in the -image and the identified apertures used to measure the flux at the same spatial location in the -band image by running SExtractor in two-image mode. For object identification, we adopted a limit of at least 5 contiguous pixels above a threshold of per pixel () on the data drizzled to a scale of 003 pixel-1. This cut enabled us to detect all significant sources and a number of spurious detections close to the noise limit. As high redshift galaxies in the rest-UV are known to be compact (e.g., Ferguson et al. 2004, Bremer et al. 2004, Bouwens et al. 2004), we corrected the aperture magnitudes to approximate total magnitudes through a fixed aperture correction, determined from bright compact sources: mag in -band and mag in -band, the larger latter correction arising from the more extended PSF wings of the -band.
The measured noise in the drizzled images underestimates the true noise as adjacent pixels are correlated. To assess the true detection limit and noise properties, we examined the raw ACS/WFC images from the HST archive and measured the noise in statistically-independent pixels. For the 144-orbit -band, we determine that the detection limit is for our -diameter aperture. This is consistent with the noise decreasing as from the 5-orbit GOODSv1.0 to the 144-orbit UDF -band. We adopt this high cut as our conservative sample limit. We trimmed the outermost edges where fewer frames overlapped in order to exploit the deepest UDF region, corresponding to a survey area of 11 arcmin2. From the output of SExtractor we created a sub-catalogue of all real objects brighter than mag ( in a -diameter aperture), of which 63 appear to be promising -band dropouts (see 2.3) with .
To quantify possible incompleteness in this catalogue, we adopted two approaches. First we examined the recovery rate of artificial galaxies created with a range of total magnitudes and sizes. We used de Vaucouleurs and exponential disk profiles, convolved with the ACS/WFC PSF derived from unsaturated stars in the UDF images. Secondly we created fainter realisations of the brightest -dropout in the UDF confirmed to be at high redshift (SBM03#1 with , confirmed spectroscopically to be at by Stanway et al. 2004b; Dickinson et al. 2004). By excising a small region around this -dropout, scaling the sub-image to a fainter magnitude, and adding it back into the UDF data at random locations, we assessed the recoverability as a function of brightness. For such objects we recover 98% of the simulated sources to , the remainder being mainly lost via source confusion through overlapping objects. From these analyses, we determine that, for unresolved sources (), we are complete at our limit of , and are 97% complete at this magnitude for (Figure 1). For objects with larger half-light radii we will underestimate the -band flux due to our -diameter photometric aperture. However, this effect is small for our sample of compact sources (Table 1 lists both the -diameter magnitudes with an aperture correction which we adopt, and the SExtractor “MAG_AUTO” estimate of the total magnitude using a curve-of-growth: these are broadly consistent).

At the relatively bright cut of used in Paper I from the GOODSv0.5 individual epochs, the UDF data is 98% complete for sources as extended as arcsec. Interestingly, we detect no extended (low surface brightness) -drops to this magnitude limit in addition to SBM03#1 (Papers I,III) in the deeper UDF data. This supports our assertion (Paper I) that the -drop population is predominantly compact and there cannot be a large completeness correction arising from extended objects (c.f. Lanzetta et al. 2002). The ACS imaging is of course picking out HII star forming regions, and these UV-bright knots of star formation are typically kpc ( at ) even within large galaxies at low redshift.
2.3 Candidate Selection
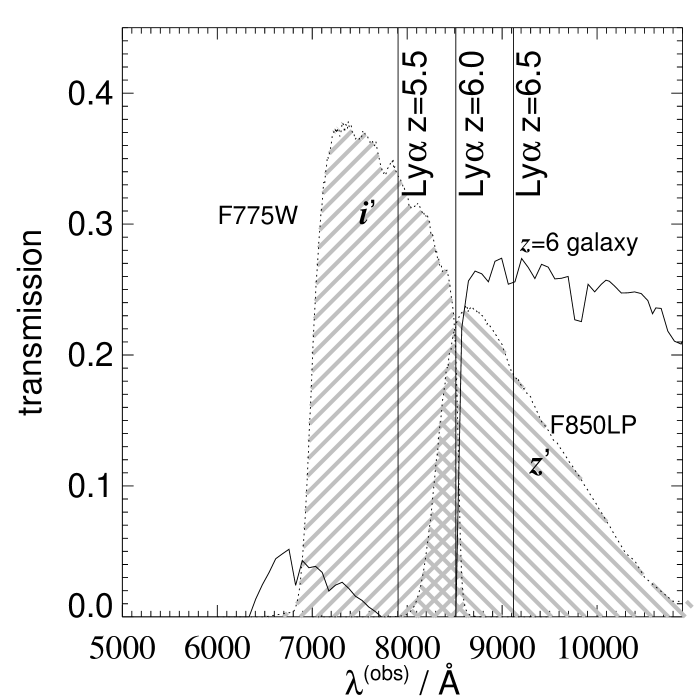
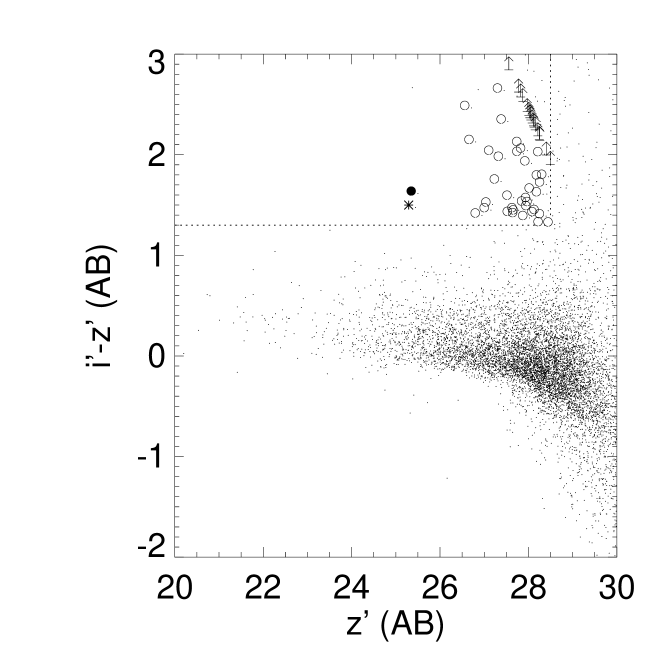
In order to select galaxies, we use the Lyman break technique pioneered at using ground-based telescopes by Steidel and co-workers and using HST by Madau et al. (1996). At the technique involves the use of three filters: one below the Lyman limit ( Å), one in the Lyman forest region and a third longward of the Lyman- line ( Å). At , we can efficiently use only two filters, since the integrated optical depth of the Lyman- forest is (see Figure 2) rendering the shortest-wavelength filter below the Lyman limit redundant. The key issue is to work at a sufficiently-high signal-to-noise ratio that -band drop-outs can be safely identified through detection in a single redder band (i.e., SDSS-). This approach has been demonstrated to be effective by the SDSS collaboration in the detection of quasars using the - and -bands alone (Fan et al. 2001). The sharp sides of the SDSS filters assist in the clean selection using the photometric redshift technique. In Figures 3 & 4 we illustrate how a colour cut of (used in Papers I-III) can be effective in selecting sources with . Here we relax this cut to to recover most galaxies at redshifts , but at the expense of potentially larger contamination by ellipticals. Near-infrared colours from the NICMOS imaging of the UDF should identify these Extremely Red Objects (EROs), and we consider this in a companion paper (Stanway, McMahon & Bunker 2004c).
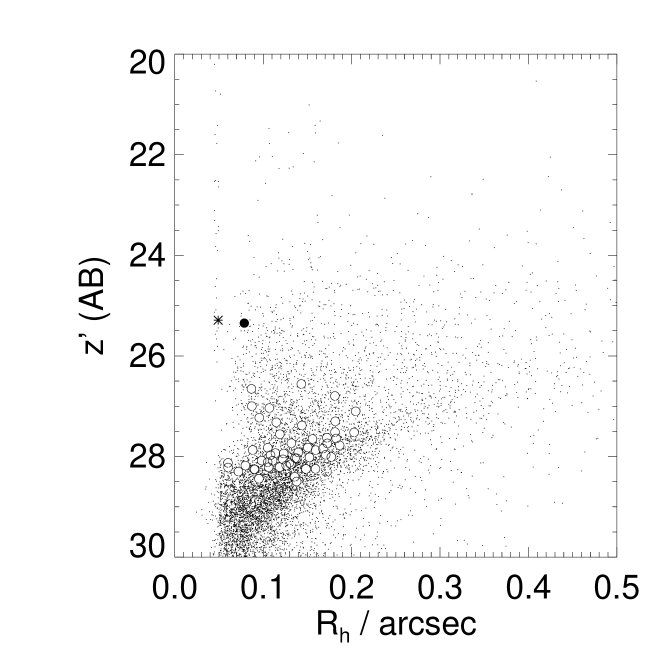
Six of the 63 candidate -dropouts in our UDF catalogue were identified visually as different regions of the same extended source, and where these were within our aperture diameter of the duplicates were eliminated from the final selection. One spurious -drop arose from the diffraction spikes of bright stars due to the more extended PSF in the -band compared with that in the -band. Only one of the -dropouts is unresolved (Figure 5). This is the brightest at (#11337 in Table 1), detected in the -band image and removed from our catalogue of potential objects as a probable star. At the edge of the UDF frame (and outside the central 11 arcmin2 region of lowest noise where we do our main analysis) there is a second unresolved -drop with , first identified in Paper I (SBM03#5), where we argued that the near-IR colours are likely to be stellar. It is interesting that the level of stellar contamination in the UDF -drops is only 2%, compared with about one in three at the bright end (, Papers I & III). This may be because we are seeing through the Galactic disk at these faint magnitudes to a regime where there are no stars at these faint limiting magnitudes.
From our original list of 63 -drops, 6 duplications were removed, along with one diffraction spike artifact. The remaining objects satisfying our & selection criteria are detailed in Table 1, of which 54 are good candidate galaxies, along with the probable star #11337, and another objected (#46574) detected in -band. The surface density of -drops as a function of limiting magnitude is shown in Figure 7. None of the -drops (with the exception of the Galactic star) are detected in the -band image of the UDF, to a limit of in a 05-diameter aperture, as would be expected for the interpretation where the -band filter covers wavelengths below the 912 Å Lyman limit.


| Our ID | STScI | RA & Declination | Rh | SFR | ||||
| ID | (J2000) | (05-diameter aperture) | 05-aper | arcsec | (total) | |||
| [(2140)⋆ | — | 03 32 38.80 27 49 53.6 | 25.22 0.02 | 27.91 0.04 | 2.69 0.05 | 0.06 | 25.17 0.02 | (star)] |
| (11337) | 443 | 03 32 38.02 27 49 08.4 | 25.29 0.02 | 26.79 0.04 | 1.50 0.05 | 0.05 | 25.43 0.02 | (star) |
| 201041 | 2225 | 03 32 40.01 27 48 15.0 | 25.35 0.02 | 26.99 0.03 | 1.64 0.04 | 0.08 | 25.29 0.02 | 19.5[] |
| 429292 | 8033 | 03 32 36.46 27 46 41.4 | 26.56 0.03 | 29.05 0.14 | 2.49 0.15 | 0.14 | 26.55 0.04 | 6.75 |
| 41628 | 8961 | 03 32 34.09 27 46 47.2 | 26.65 0.04 | 28.81 0.12 | 2.15 0.12 | 0.09 | 26.70 0.04 | 6.18 |
| (46574)3 | 7730 | 03 32 38.28 27 46 17.2 | 26.71 0.04 | 29.38 0.18 | 2.67 0.18 | 0.09 | 26.74 0.04 | (5.87) |
| 24019 | 3398 | 03 32 32.61 27 47 54.0 | 26.80 0.04 | 28.22 0.08 | 1.42 0.09 | 0.18 | 26.73 0.04 | 5.42 |
| 52880 | 9857 | 03 32 39.07 27 45 38.8 | 27.00 0.05 | 28.47 0.09 | 1.47 0.10 | 0.09 | 27.10 0.05 | 4.50 |
| 23516 | 3325 | 03 32 34.55 27 47 56.0 | 27.04 0.05 | 28.57 0.10 | 1.53 0.11 | 0.11 | 27.05 0.05 | 4.35 |
| 10188 | 322 | 03 32 41.18 27 49 14.8 | 27.10 0.05 | 29.15 0.16 | 2.04 0.16 | 0.20 | 27.06 0.05 | 4.10 |
| 21422 | 2690 | 03 32 33.78 27 48 07.6 | 27.23 0.05 | 28.99 0.14 | 1.76 0.15 | 0.10 | 27.37 0.05 | 3.64 |
| 25578D | — | 03 32 47.85 27 47 46.4 | 27.30 0.06 | 29.96 0.31 | 2.66 0.31 | 0.18 | 27.28 0.06 | 3.41 |
| 25941 | 4050 | 03 32 33.43 27 47 44.9 | 27.32 0.06 | 29.30 0.18 | 1.99 0.19 | 0.11 | 27.38 0.06 | 3.35 |
| 26091D | 4110 | 03 32 41.57 27 47 44.2 | 27.38 0.06 | 29.74 0.25 | 2.35 0.26 | 0.14 | 27.21 0.07 | 3.16 |
| 24458 | 3630 | 03 32 38.28 27 47 51.3 | 27.51 0.07 | 29.11 0.15 | 1.60 0.17 | 0.18 | 27.67 0.08 | 2.80 |
| 21262 | 2624 | 03 32 31.30 27 48 08.3 | 27.52 0.07 | 28.96 0.13 | 1.44 0.15 | 0.20 | 27.49 0.08 | 2.78 |
| 13494 | 30591 | 03 32 37.28 27 48 54.6 | 27.56 0.07 | 30.62 0.55 | 3.06 0.55 | 0.12 | 27.48 0.08 | 2.69 |
| 24228 | 3450 | 03 32 34.28 27 47 52.3 | 27.63 0.07 | 29.10 0.15 | 1.47 0.17 | 0.17 | 27.39 0.08 | 2.52 |
| 16258 | 1400 | 03 32 36.45 27 48 34.3 | 27.64 0.07 | 29.07 0.15 | 1.42 0.16 | 0.18 | 27.25 0.07 | 2.49 |
| 42414 | 9202 | 03 32 33.21 27 46 43.3 | 27.65 0.07 | 29.10 0.15 | 1.45 0.17 | 0.16 | 27.54 0.08 | 2.46 |
| 271735 | 4377 | 03 32 29.46 27 47 40.4 | 27.73 0.08 | 29.87 0.28 | 2.13 0.29 | 0.13 | 27.74 0.09 | 2.28 |
| 49117D | — | 03 32 38.96 27 46 00.5 | 27.74 0.08 | 29.77 0.26 | 2.03 0.27 | 0.17 | 27.36 0.07 | 2.28 |
| 49701 | 36749 | 03 32 36.97 27 45 57.6 | 27.78 0.08 | 30.79 0.64 | 3.02 0.64 | 0.19 | 27.90 0.09 | 2.20 |
| 24123 | — | 03 32 34.29 27 47 52.8 | 27.82 0.08 | 29.89 0.29 | 2.07 0.30 | 0.15 | 27.65 0.09 | 2.11 |
| 27270 | 33003 | 03 32 35.06 27 47 40.2 | 27.83 0.08 | 30.69 0.58 | 2.87 0.59 | 0.11 | 27.99 0.09 | 2.10 |
| 23972 | 3503 | 03 32 34.30 27 47 53.6 | 27.84 0.09 | 29.38 0.19 | 1.54 0.21 | 0.17 | 27.77 0.10 | 2.07 |
| 14751 | 1086 | 03 32 40.91 27 48 44.7 | 27.87 0.09 | 29.27 0.17 | 1.40 0.19 | 0.09 | 27.92 0.09 | 2.02 |
| 44154 | 35945 | 03 32 37.46 27 46 32.8 | 27.87 0.09 | 30.4 (3 ) | 2.5 (3 ) | 0.16 | 27.87 0.10 | 2.01 |
| 35084 | 34321 | 03 32 44.70 27 47 11.6 | 27.92 0.09 | 29.86 0.28 | 1.94 0.30 | 0.14 | 27.90 0.09 | 1.93 |
| 42205 | 8904 | 03 32 33.55 27 46 44.1 | 27.93 0.09 | 29.51 0.21 | 1.57 0.23 | 0.11 | 27.91 0.09 | 1.90 |
| 46503 | 7814 | 03 32 38.55 27 46 17.5 | 27.94 0.09 | 29.43 0.20 | 1.50 0.22 | 0.12 | 28.07 0.09 | 1.89 |
| 19953 | 2225 | 03 32 40.04 27 48 14.6 | 27.97 0.09 | 29.50 0.21 | 1.54 0.23 | 0.17 | 27.68 0.10 | 1.85 |
| 52086 | 36786 | 03 32 39.45 27 45 43.4 | 27.97 0.09 | 30.83 0.66 | 2.86 0.66 | 0.11 | 28.04 0.10 | 1.84 |
| 44194 | 35945 | 03 32 37.48 27 46 32.5 | 28.01 0.10 | 30.61 0.54 | 2.60 0.55 | 0.18 | 27.46 0.09 | 1.77 |
| 21111D | 2631 | 03 32 42.60 27 48 08.9 | 28.02 0.10 | 29.69 0.24 | 1.67 0.26 | 0.15 | 28.08 0.10 | 1.76 |
| 462234 | 35506 | 03 32 39.87 27 46 19.1 | 28.03 0.10 | 32.18 2.23 | 4.15 2.23 | 0.14 | 28.10 0.11 | 1.74 |
| 22138 | 32007 | 03 32 42.80 27 48 03.2 | 28.03 0.10 | 30.4 (3 ) | 2.3 (3 ) | 0.14 | 28.14 0.10 | 1.73 |
| (46234)4 | — | 03 32 39.86 27 46 19.1 | 28.05 0.10 | 30.61 0.54 | 2.56 0.55 | 0.12 | 28.30 0.12 | (1.70) |
| 14210 | 978 | 03 32 35.82 27 48 48.9 | 28.08 0.10 | 29.51 0.21 | 1.43 0.24 | 0.10 | 28.16 0.11 | 1.66 |
| 45467 | 35596 | 03 32 43.02 27 46 23.7 | 28.08 0.10 | 30.4 (3 ) | 2.3 (3 ) | 0.11 | 28.25 0.10 | 1.66 |
| 12988D | 30534 | 03 32 38.49 27 48 57.8 | 28.11 0.11 | 30.47 0.48 | 2.36 0.49 | 0.10 | 28.22 0.11 | 1.61 |
| 30359 | 33527 | 03 32 30.14 27 47 28.4 | 28.13 0.11 | 29.58 0.22 | 1.46 0.25 | 0.13 | 28.02 0.11 | 1.59 |
| 11370 | 482 | 03 32 40.06 27 49 07.5 | 28.13 0.11 | 30.45 0.47 | 2.32 0.48 | 0.06 | 28.27 0.08 | 1.59 |
| 24733 | 32521 | 03 32 36.62 27 47 50.0 | 28.15 0.11 | 30.92 0.71 | 2.76 0.72 | 0.13 | 28.34 0.12 | 1.55 |
| 37612 | 34715 | 03 32 32.36 27 47 02.8 | 28.18 0.11 | 29.98 0.31 | 1.80 0.33 | 0.13 | 28.15 0.11 | 1.52 |
| 41918 | 7829 | 03 32 44.70 27 46 45.5 | 28.18 0.11 | 29.81 0.27 | 1.63 0.29 | 0.08 | 28.36 0.10 | 1.52 |
| 21530 | 31874 | 03 32 35.08 27 48 06.8 | 28.21 0.12 | 30.24 0.39 | 2.03 0.41 | 0.12 | 28.35 0.12 | 1.47 |
| 42806 | 8033 | 03 32 36.49 27 46 41.4 | 28.21 0.12 | 30.76 0.62 | 2.55 0.63 | 0.11 | 28.12 0.11 | 1.47 |
| 270325 | 4377 | 03 32 29.45 27 47 40.6 | 28.22 0.12 | 29.55 0.22 | 1.34 0.25 | 0.06 | 28.70 0.12 | 1.46 |
| 52891 | 36697 | 03 32 37.23 27 45 38.4 | 28.25 0.12 | 32.21 2.28 | 3.96 2.28 | 0.16 | 28.34 0.11 | 1.43 |
| 17908 | 1834 | 03 32 34.00 27 48 25.0 | 28.25 0.12 | 29.66 0.24 | 1.41 0.27 | 0.15 | 28.22 0.13 | 1.42 |
| (27029)5 | 4353 | 03 32 29.44 27 47 40.7 | 28.25 0.12 | 29.98 0.31 | 1.73 0.33 | 0.09 | 28.67 0.14 | (1.42) |
| 48989D | 36570 | 03 32 41.43 27 46 01.2 | 28.26 0.12 | 30.4 (3 ) | 2.1 (3 ) | 0.09 | 28.45 0.12 | 1.41 |
| 17487 | — | 03 32 44.14 27 48 27.1 | 28.30 0.12 | 30.10 0.35 | 1.81 0.37 | 0.07 | 28.51 0.11 | 1.36 |
| 18001 | 31309 | 03 32 34.14 27 48 24.4 | 28.40 0.13 | 30.46 0.48 | 2.06 0.49 | 0.14 | 28.59 0.14 | 1.23 |
| 35271 | 6325 | 03 32 38.79 27 47 10.9 | 28.44 0.14 | 29.77 0.26 | 1.33 0.30 | 0.10 | 28.60 0.13 | 1.19 |
| 22832 | — | 03 32 39.40 27 47 59.4 | 28.50 0.15 | 30.46 0.47 | 1.96 0.50 | 0.14 | 28.60 0.13 | 1.13 |
D double. ⋆ star SBM03# 5 (Paper I), outside central UDF. 1 SBM03#1 (Paper I); SiD002 (Dickinson et al. 2004). 2 SiD025 (Dickinson et al. 2004). 3 46574 has a close neighbour visible in the -band (i.e. low redshift.) 4 46234 is close to 46223. 5 27029 is close to 27032.
3 Selection Effects and The Luminosity Function of Star Forming Galaxies at
3.1 Estimate of Star Formation Rate from the Rest-UV
We will base our measurement of the star formation rate for each candidate on the rest-frame UV continuum, redshifted into the -band at and measured from the counts in a -diameter aperture (with an aperture correction to total magnitudes, Section 2.2). In the absence of dust obscuration, the relation between the flux density in the rest-UV around Å and the star formation rate ( in ) is given by from Madau, Pozzetti & Dickinson (1998) for a Salpeter (1955) stellar initial mass function (IMF) with . This is comparable to the relation derived from the models of Leitherer & Heckman (1995) and Kennicutt (1998). However, if a Scalo (1986) IMF is used, the inferred star formation rates will be a factor of higher for a similar mass range.
Recognising the limitations of our earlier studies (Papers I-III) which by necessity focussed on the brighter -drops, we now attempt to recover the rest-frame UV luminosity function from the observed number counts of -drops to faint magnitudes in the UDF. Although our colour cut selects galaxies with redshifts in the range , an increasing fraction of the -band flux is attenuated by the redshifted Lyman- forest. At higher redshifts we probe increasingly shortward of Å (where the luminosity function is calculated) so the -corrections become significant beyond .
Figure 6 demonstrates this bias and shows the limiting star formation rate as a function of redshift calculated by accounting for the filter transmissions and the blanketting effect of the intervening Lyman- forest. By introducing the small -correction to Å from the observed rest-wavelengths longward of Lyman- redshifted into the -band we can correct for this effect. We considered a spectral slope of (where ) appropriate for an unobscured starburst (flat in ), and also a redder slope of which appropriate for mean reddening of the Lyman break galaxies given by Meurer et al. (1997). A more recent determination for this population by Adelberger & Steidel (2000) gives , in the middle of the range. At our limiting magnitude of , we deduce we can detect unobscured star formation rates as low as at and at for spectral slope (Figure 6).
Recognising that contamination by interlopers will only reduce the value, we now compare the comoving star formation rate deduced for galaxies based on our candidate -dropout source counts with predictions based on a range of rest-frame UV luminosity functions. For convenience we assume that there is no evolution over the sampled redshift range, , spanned by the UDF data (equivalent to a range between Gyr after the Big Bang). We take as a starting point the luminosity function for the well-studied Lyman-break -dropout population, reported in Steidel et al. (1999), which has a characteristic rest-UV luminosity (equivalent to mag or for our cosmology). The faint end slope of the Schechter function at is relatively steep () compared with to for lower-redshift galaxy samples (e.g., Lilly et al. 1995; Efstathiou et al. 1988; Blanton et al. 2003 – see Gabasch et al. 2004 for recent determinations at 1500 Å). The characteristic comoving number density at is in our cosmology.
We adopt two approaches to determining the galaxy number density and star formation density at : the first method (Section 3.1.1) is the one used in Papers I & III, an application of the “effective volume” technique (Steidel et al. 1999). The second method (Section 3.1.3) involved comparing the measured surface density of -dropout galaxies with that predicted on the assumption they have the same characteristics as the -dropout population at .
3.1.1 Effective Survey Volume
We have followed the approach of Steidel et al. in calculating the effect of luminosity bias on our sample of LBGs. We account for the -correction: as redshift increases, the -band samples light in the rest-frame of the galaxies at wavelengths that are increasingly far to the blue of 1500 Å, where the LBGs’ luminosity function was calculated. Additionally, at redshifts , Lyman- absorption from the forest enters the -band and makes galaxies fainter still, as there is incomplete coverage of the filter by the continuum longward of Lyman-. Accounting for these luminosity and redshift biases, we compute an effective survey volume using
where is the probability of detecting a galaxy at redshift and apparent magnitude , and is the comoving volume per unit solid angle in a slice at redshift . We integrate over the magnitude range we are sensitive to, and over the redshift range from our colour selection, and calculate that for a spectral slope of (i.e., flat in ) the effective comoving volume is 40 per cent the total volume in the range (i.e., the same as ). For our 11 arcmin2 survey area (excluding the edge regions of the UDF where fewer frames overlap) this is a comoving volume of .
Hence we calculate a volume-averaged comoving star formation density at of for the -dropout galaxies with (). This is plotted on the Madau-Lilly diagram (Figure 11). Data from other groups are shown on this figure, where we have corrected all the datasets to the same limiting star formation rate of (i.e., typically integrating their claimed luminosity functions down to ) to provide a fair comparison of evolution. Integrating the luminosity function down to , as here, represents most of the total luminosity density for faint end slopes (compared with integrating to zero luminosity). If we assume that the Schechter function holds for the unobserved faint galaxies with , then the observed population with represents (87.5%, 78.9%, 56.4%, 32.4%, 17.4%) of the total star formation rate for faint-end slopes .
3.1.2 Colour Selection: spectral slope and forest blanketting
We model the effect of the break below the Lyman- emission line due to blanketting by the forest, where the continuum break (Oke & Korycansky 1982) is defined as
| (1) |
We assumed flux decrements of , consistent with that observed in the SDSS QSOs (Fan et al. 2001). We find that lowering reduces the completeness in the lowest redshift bin for a colour cut. A cut improves the selection somewhat but at the risk of higher contamination from red objects at : we consider this in Stanway, McMahon & Bunker (2004c).
We find that altering the spectral slope of the -drop spectral energy distribution () over the range changes the predicted number of -dropouts by only %.
3.1.3 Surface Density Predictions
First, we compare our observed number of -band dropout galaxies with a simple no-evolution model, which assumes the same luminosity function for Lyman break galaxies at as at (with a faint-end slope , spectral slope and Lyman- forest decrement ). This no-evolution model would predict 169 galaxies satisfying our & selection with a total star formation rate of . This compares with our observed number of 54 -drops (1/3rd that predicted), which have a total star formation rate of (1/6th of the no-evolution prediction). The predicted median redshift of our -drop sample for the no-evolution model is , with the luminosity-weighted average .
Clearly, evolution in the UV luminosity function of Lyman break galaxies is required. To fit this, we constructed a grid of models based upon the luminosity function, varying between and , and between and . We leave the normalization of the luminosity function, , as a free parameter,
We minimize for our grid of model luminosity functions: our best fit (Figure 8) is compatible with no evolution of from , but a large decline in the comoving space density, (by about a factor 6 relative to ). The faint end slope is less well constrained, although no evolution is compatible with the results. At the faintest magnitude bin, there modestly higher counts, perhaps indicating a slightly steeper if the results at the faintest magnitudes are to be trusted (Figure 9).
3.1.4 Comparison with -drop number counts from other groups
Recognizing the very limited area of the UDF and the problems of cosmic variance, it is nonetheless interesting to compare our measured -drop number counts with previous determinations from shallower data sets. The surface density derived in Paper I to is consistent with the present data – we detect only one resolved -dropout this bright: SBM03#1. Note that the UDF pointing was selected to include this object. No other spatially-resolved -dropouts are detected to , implying a surface density of arcmin-2. This is in contrast with the density of arcmin-2 measured by Giavalisco et al. (2004) to the same limit, and arcmin-2 from the completeness-corrected estimate of Bouwens et al. (2003)222Note added in proof: a recent paper by Bouwens et al. (2004), based on number counts of -drops in the ACS parallel observations to the NICMOS UDF field, significantly revises their previous estimate of the number density of -drops from to arcmin-2 (4 objects in 21 arcmin2, consistent with our UDF work presented here). The conclusion of Bouwens et al. (2003) –that the comoving star formation at is consistent with no evolution from – is revised in Bouwens et al. (2004) to be a factor of 3 decline from to . Using the evolution in comoving number density of suggested by Bouwens et al. (2004), this fall in star formation rate at is consistent with our result of a factor of 6 decline from to from the GOODS data in Stanway, Bunker & McMahon (2003), confirmed in this paper from the deeper UDF data. , and the even higher surface density of 2.3 arcmin-2 (after removing stellar contamination) claimed by Yan, Windhorst & Cohen (2003), after correcting for a factor of 4 error in their original flux calibration (see Yan & Windhorst 2004). Clearly, there are large discrepancies from the various groups in the number density measured to the same limiting magnitude of , with measurements up to a factor of 20 higher than our UDF measurement (Yan & Windhorst 2004). These discrepancies may be due to cosmic variance, or too many spurious sources in the samples of these teams, due to working close to the sensitivity limits. By using a high signal-to-noise () cut, we guard against the low- bias: where there are many more objects with intrinsically bluer colours that scatter up into our selection than there are real -drops which scatter out of the colour selection through photometric errors.


From Somerville et al. (2004) we estimate that the cosmic variance for the UDF is 40%, assuming the LBGs are clustered in the same way as the LBGs and assuming a volume of derived by scaling our UDF area with our wider-area GOODS data (with an effective volume of for the 146 arcmin2 of GOODS-S, Paper I). Indeed, the spatial distribution of our -drops on the sky does indicate some clustering (Figure 10), and we had already flagged 6 of our candidates as being “double” sources (Table 1), with another 2 having near neighbours. In the GLARE GMOS/Gemini spectroscopy of the GOODS-South -dropouts, Stanway et al. (2004a) have already spectroscopically identified an overdensity at .

3.2 Implications for Reionization
The increased depth of the UDF enables us to resolve the uncertainties associated with the unobserved portion of the luminosity function (LF) for sources. Our best-fit LF suggest little or no change in over , with less well constrained but consistent with modest evolution, implying the major evolution is a decline in space density (and global star formation rate) by at . This sharp decline, which must represent a lower limit to the true decline given the likelihood of contamination from foreground sources, suggests it may be difficult for luminous star-forming -dropout galaxies to be the main source of ionizing photons of the Universe.
We attempt to quantify this by comparing with the estimate of Madau, Haardt & Rees (1999) for the density of star formation required for reionization (their equation 27):
| (2) |
This relation is based on the same Salpeter Initial Mass Function as we have used in deriving our volume-averaged star formation rate. is the concentration factor of neutral hydrogen, . Simulations suggest (Gnedin & Ostriker 1997). Our comoving star formation rate of from the -drop galaxies we detect is a factor of lower than the original Madau, Haardt & Rees (1999) requirement at . We have updated their equation 27 for the more recent concordance cosmology estimate of the baryon density of Spergel et al. (2003), , and for the predicted mean redshift of our sample ():
| (3) |
The escape fraction of ionizing photons () for high-redshift galaxies is highly uncertain (e.g., Steidel, Pettini & Adelberger 2001), but even if we take (no absorption by H I) this estimate of the star formation density required is a factor of higher than our measured star formation density of at from galaxies in the UDF with SFRs . For faint end slopes of galaxies with account for % of the total luminosity, so would fall short of the required density of Lyman continuum photons required to reionize the Universe. If the faint-end slope is as steep as then there would just be enough UV Lyman continuum photons generated in star forming galaxies at (assuming a Salpeter IMF), but the requried escape fraction for complete reionization would still have to be implausibly high (, whereas all high- measurements to date indicate : Fernánadez-Soto, Lanzetta & Chen 2003; Steidel, Adelberger & Pettini 2001).
AGN are also under-abundant at these epochs (e.g., Dijstra, Haiman & Loeb 2004). If star forming galaxies at redshifts close to were responsible for the bulk of reionization, then a very different initial mass function would be required, or the calculations of the clumping factor of neutral gas would have to be significantly over-estimated. Alternatively another low-luminosity population (e.g., forming globular clusters; Ricotti 2002) could be invoked to provide some of the shortfall in ionizing photons. It is also plausible that the bulk of reionization occured at redshifts well beyond : the WMAP polarization data indicate (Kogut et al. 2003), and it is possible that the Gunn-Peterson troughs seen in QSOs (Becker et al. 2001; Fan et al. 2002) mark the very last period of a neutral IGM.

4 Conclusions
We summarize our main conclusions as follows:
-
1.
We present an -dropout catalogue of star forming galaxy candidates in the Ultra Deep Field (UDF) to a limiting flux () of . This represents a substantial advance over the depths achieved in the GOODS catalogues and enables us, for the first time, to address questions concerning the contribution of the faint end of the luminosity function.
-
2.
We detect 54 resolved sources with in the deepest 11 arcmin2 portion of the UDF and consider this to be an upper limit to the abundance of star forming galaxies at .
-
3.
Using simulations based on lower redshift data, we deduce that, regardless of contamination by foreground interlopers, the abundance of -dropouts detected is significantly less than predicted on the basis of no evolution in the comoving star formation rate from to (integrating to the same luminosity level). The UDF data supports our previous suggestions that the star formation rate at was about less than at (Stanway, Bunker & McMahon 2003).
-
4.
The inferred comoving star formation rate of from galaxies at may poses a significant challenge for models which require that luminous star forming galaxies in the redshift range 610 are responsible for reionizing the Universe.
-
5.
The contamination of our -drop sample of candidate galaxies by cool Galactic stars appears to be minimal at , possibly because we are seeing beyond the Galactic disk at the faint magnitudes probed by the UDF.
Note Added in Proof
A recent preprint by Yan & Windhorst (astro-ph/0407493) independently repeats our selection of candidate galaxies in the Hubble Ultra Deep Field with (astro-ph/0403223 and this paper). The Yan & Windhorst catalogue also pushes to fainter magnitudes than our limit, where the completeness corrections become significant. This subsequent independent analysis recovers almost all of our original -band drop-out galaxies, and the catalogues agree at the 98% level (one discrepant object out of 50). In astro-ph/0407562 (Bunker & Stanway 2004) we present a matched catalogue of these -band dropouts in the Hubble Ultra Deep Field.
Acknowledgements
We thank Steve Beckwith and colleagues at the Space Telescope Science Institute for making the UDF data available as a public database, on schedule and in a manner suitable for immediate analysis. ERS acknowledges a Particle Physics and Astronomy Research Council (PPARC) studentship supporting this study. Based on observations made with the NASA/ESA Hubble Space Telescope, obtained from the Data Archive at the Space Telescope Science Institute, which is operated by the Association of Universities for Research in Astronomy, Inc., under NASA contract NAS 5-26555. These observations are associated with program #9978. We thanks the anonymous referee for some helpful suggestions.
References
- [Adelberger & Steidel 2000] Adelberger K. L., Steidel C. C., 2000, ApJ, 544, 218
- [Barger et al. 2003] Barger A. J. et al., 2003, AJ, 126, 632
- [Becker et al. 2001] Becker R. H. et al., 2001, AJ, 122, 2850
- [Beckwith 2003] Beckwith, S., Somerville, R., Stiavelli, M. 2003, STScI Newsletter vol 20 issue 04
- [Bertin & Arnouts 1996] Bertin E., Arnouts S., 1996, A&AS, 117, 393
- [Blanton et al. 2003] Blanton M. R., et al., 2003, ApJ, 592, 819
- [Bouwens et al. 2003] Bouwens R., et al., 2003, ApJ, 595, 589
- [Bouwens et al. 2003] Bouwens R., Broadhurst T., Illingworth G., 2003, ApJ, 593, 640
- [Bouwens et al. 2004] Bouwens R., et al., 2004, preprint (astro-ph/0403167)
- [Bouwens et al. 2003] Bouwens R. J., Illingworth G. D., Blakeshee, J. P., Broadhurst T., Franx M., 2004, ApJ, 611, L1
- [Bremer et al. 2004] Bremer M. N., Lehnert M. D., Waddington I., Hardcastle M. J., Boyce P. J., Phillipps S., 2004, MNRAS, 347, L7
- [Bunker et al. 2003] Bunker A. J., Stanway E. R., Ellis R. S., McMahon R. G., McCarthy P. J., 2003, MNRAS, 342, L47 [Paper II]
- [Connolly et al. 1997] Connolly A. J., Szalay A. S., Dickinson M., Subbarao M. U., Brunner R. J., 1997, ApJ, 486, L11
- [Cimatti et al. 2002] Cimatti A., et al., 2002, A&A, 381, L68
- [Coleman, Wu & Weedman 1980] Coleman G. D., Wu C.-C., Weedman D. W., 1980, ApJS, 43, 393
- [Dickinson et al. 2004] Dickinson M., et al., 2004, ApJ, 600, L99
- [Dijkestra, Haiman & Loeb 2003] Dijkestra M., Haiman Z., Loeb A., 2004, preprint (astro-ph/0403078)
- [Efstathiou G. et al. 1988] Efstathiou G., Ellis R. S., Peterson B. A., 1988, MNRAS, 232, 431
- [Fan et al. 2001] Fan X., et al., 2001, AJ, 122, 2833
- [Fan et al. 2002] Fan X., et al., 2002, AJ, 123, 1247
- [Ferguson et al. 2004] Ferguson H. C., et al., 2004, ApJ 600 L107
- [Fernández-Soto, Lanzetta & Chen 2003] ernández-Soto A., Lanzetta K. M., Chen H.-W., MNRAS, 342, 1215
- [Fontana et al. 2003] Fontana A., Poli F., Menci N., Nonino M., Giallongo E., Cristiani S., D’Odorico S., 2003, ApJ, 587, 544
- [Ford et al. 2002] Ford H. C., et al., 2002, BAAS, 200.2401
- [Fruchter & Hook 2002] Fruchter A., Hook R., 2002, PASP, 114, 144
- [Gabasch et al. 2004] Gabasch A., et al., 2004, A& A in press, preprint (astro-ph/0403535)
- [Giavalisco & Dickinson 2002] Giavalisco M., Dickinson M., 2002, ApJ, 550, 177
- [Giavalisco et al. 2004] Giavalisco M., et al., 2004, ApJ, 600, L103
- [Gnedin & Ostriker 1997] Gnedin N. Y., Ostriker J. P., 1997, ApJ, 486, 581
- [Gunn & Peterson 1965] Gunn J. E., Peterson B. A., 1965, ApJ, 142, 1633
- [Hawley et al. 2002] Hawley S. L., et al., 2002, AJ, 123, 3409
- [Iwata et al. 2003] Iwata I., Ohta K., Tamura N., Ando M., Wada S., Watanabe C., Akiyama M., Aoki K., 2003, PASJ, 55, 415
- [Kogut et al. 2003] Kogut A., et al., 2003, ApJS, 148, 161
- [Lanzetta et al. 2002] Lanzetta K. M., Yahata N., Pascarelle S., Chen H.-W., Fernández-Soto A., 2002, ApJ, 570, 492
- [Leitherer & Heckman 1995] Leitherer C., Heckman T. M., 1995, ApJS, 96, 9
- [Lilly et al. 1995] Lilly S. J., Tresse L., Hammer F., Crampton D., Le Fèvre O., 1995, ApJ, 455, 108
- [Koekemoer et al. 2002] Koekemoer A. M., Fruchter A. S., Hook R. N., Hack W., 2002, HST Calibration Workshop, Eds. Arribas S., Koekemoer A. M., Whitmore B., (STScI: Baltimore), p. 325
- [Madau et al. 1996] Madau P., Ferguson H. C., Dickinson M. E., Giavalisco M., Steidel C. C., Fruchter A., 1996, MNRAS, 283, 1388
- [Madau, Pozzetti & Dickinson 1998] Madau P., Pozzetti L., Dickinson M., 1998, ApJ, 498, 106
- [Madau, Haardt & Rees 1999] Madau P., Haardt F., Rees M., 1999, ApJ, 514, 648
- [Meurer et al. 1997] Meurer G. R., Heckman T. M., Lehnert M. D., Leitherer C., Lowenthal J., 1997, AJ, 114, 54
- [Oke & Korycansky 1982] Oke J. B., Korycansky D. G., 1982, ApJ, 225, 11
- [Oke & Gunn 1983] Oke J. B., Gunn J. E., 1983, ApJ, 266, 713
- [Ricotti 2002] Ricotti M., 2002, MNRAS, 336, L33
- [Salpeter 1955] Salpeter E. E., 1955, ApJ, 121, 161
- [Scalo 1986] Scalo J. M., 1986, Fund. Cosmic Phys., 11, 1
- [Schlegel, Finkbeiner & Davis 1998] Schlegel D. J., Finkbeiner D. P., Davis M., 1998, ApJ, 500, 525
- [Somerville et al. 2004] Somerville R. S., Lee K., Ferguson H. C., Gardener J. P., Moustakas L. A., Giavalisco M., 2004, ApJ, 600, L171
- [Spergel et al. 2003] Spergel, D. N., et al., 2003, ApJS, 148, 175
- [Stanway, Bunker & McMahon 2003] Stanway E. R., Bunker A. J., McMahon R. G., 2003, MNRAS, 342, 439 [Paper I]
- [Stanway et al. (2004a)] Stanway E. R., et al., 2004a, ApJ, 604, L13
- [Stanway et al. (2004b)] Stanway E. R., Bunker A. J., McMahon R. G., Ellis R. S., Treu T., McCarthy P. J., 2004b, ApJ in press, preprint (astro-ph/0308124) [Paper III]
- [Stanway (2004)] Stanway, E. R., 2004, PhD Thesis (University of Cambridge)
- [Stanway, McMahon & Bunker 2004] Stanway E. R., McMahon R. G., Bunker A. J., 2004c, submitted to MNRAS, preprint (astro-ph/0403585)
- [Steidel, Pettini & Hamilton 1995] Steidel C. C., Pettini M., Hamilton D., 1995, AJ, 110, 2519
- [Steidel et al. 1996] Steidel C. C., Giavalisco M., Pettini M., Dickinson M. E., Adelberger K. L., 1996, ApJ, 462, L17
- [Steidel et al. 1999] Steidel C. C., Adelberger K. L., Giavalisco M., Dickinson M. E., Pettini M., 1999, ApJ, 519, 1
- [Williams et al. 1996] Williams R. E., et al., 1996, AJ, 112, 1335
- [Williams et al. 1998] Williams R. E., et al., 1998, BAAS, 30, 1366 (AAS 193, #75.01)
- [Yan, Windhorst & Cohen 2003] Yan H., Windhorst R. A., Cohen S., 2003, ApJ, 585, L93
- [Yan & Windhorst 2004] Yan H., Windhorst R. A., 2004, ApJ, 600, L1