Cores of Dark Matter Halos Correlate with Stellar Scale Lengths
Abstract
We investigate in detail the mass distribution obtained by means of high resolution rotation curves of 25 galaxies of different morphological types. The dark matter contribution to the circular rotation velocity is well-described by resorting to a dark component whose density shows an inner core, i.e. a central constant density region. We find a very strong correlation between the core radius size and the stellar exponential scale length : , and between and the galaxy dynamical mass at this distance, . These relationships would not be expected if the core radii were the product of an incorrect decomposition procedure, or the biased result of wrong or misunderstood observational data. The very strong correlation between the dark and luminous scale lengths found here seems to hold also for different Hubble types and opens new scenarios for the nature of the dark matter in galaxies.
keywords:
galaxies: kinematics and dynamics – galaxies: spiral – dark matter.1 Introduction
In spite of a large amount of knowledge gathered over the past 20 years on the phenomenon of Dark Matter (DM) in Galaxies, it is only recently that the attention has been focused on its radial density profile. Recall that, according to high-resolution N-body simulations in the -CDM framework, the dark halo density, characterized by the virial halo mass as free parameter, is described by an inner power–law cusp (but see Ricotti 2003):
| (1) |
where and are related parameters (Navarro, Frenk and White, 1996b, hereafter NFW). The DM contribution to the circular velocity can be written as:
| (2) |
where , is the concentration parameter, and . We also have that , and . 111 is the critical density of the universe, is the virial overdensity and is the mean universal density at the galaxy’s redshift. The values for the numerical constants are valid for a -CDM cosmogony with =0.3 and =0.7.
A number of reliable mass modellings, obtained for spirals and low surface brightness galaxies (LSBs) has supported the early claim (Moore, 1994) that dark halos around disk galaxies have a central density distribution much shallower than the NFW one (e.g. Gentile et al., 2004 and references therein; Weldrake, de Blok & Walter, 2003; de Blok & Bosma, 2002). The first studies on elliptical galaxies seem to indicate that also these objects share the same phenomenon (Gerhard et al., 2001; Borriello et al., 2003 ).
This “galaxy by galaxy” comparison between the predicted -CDM density distribution and those actually detected for the dark halos around disk galaxies has been the main goal of several published works. However, although the study of the discrepancy between data and theoretical predictions remains necessary, we believe that time has come that we investigate per se the distribution of DM around galaxies, independently of the existing cosmological implications. In fact, the hot debate on possible falsification of -CDM on galactic scales has carried the research off from the original topic of understanding the DM phenomenon in virialized systems. Let us stress that a direct knowledge on the presence, nature and interaction with baryons of the dark galactic component is still very rough and limited, unlike the complex and refined scenario that theory and simulations have put forward.
In the decomposition of rotation curves (RC’s), the circular velocity is best-fit modelled as the sum of a baryonic component that includes a stellar and a gaseous disk, and a spherical dark halo:
| (3) |
where the labels D, gas and H refers to the corresponding components. It is common to represent the dark halo contribution to the circular velocity by means of the 2-parameter function describing the circular velocity of a pseudo-isothermal (PI) halo:
| (4) |
The central density and the halo density core radius are free parameters to be tuned to fit .
Persic, Salucci & Stel (1996, PSS hereafter) introduced, for the dark halo velocity contribution, an equally simple function,
| (5) |
to fit, once added to the disk contribution, the Universal Rotation Curve (URC) of Spirals, i.e. the ensemble of synthetic RC’s, each one derived from a large number of individual RC’s belonging to objects with a luminosity falling inside a fixed range (see Section 4 of PSS for details). The two free parameters are: the velocity core radius , and , the halo velocity amplitude at .222 is the radius encompassing 83% of the total luminosity of the galaxy. In the case of a (stellar) exponential thin disk is 3.2 times the disk scale length . For the aim of this work, in the region of interest, , the PI circular velocity is indistinguishable from the halo URC of Eq. 5. In fact, the transformation law is obtained from the known quantities and , and by setting the PI free parameters and in Eq. 4 at the values and . Let us notice that and agree with each other within few percent at most, a discrepancy that is completely negligible, in view of the large radial variations of inside galaxies and of the large differences among the halo velocity profiles predicted by different mass models.
Moreover, the velocity profiles of Eqs. 4 and 5, once their free parameters have been properly set, can mimic in the regions where data are available a number of “theoretical” rotation curves, not all necessarily consistent with observations.333e.g. the NFW circular velocity with , in the radial range, is reproduced, within a negligible few percent discrepancy, by and/or by .
Therefore, with the obvious caveat that suitable data are available, by investigating the properties of the density distribution of the dark halos around galaxies by means of the PI/URC profile we neither assume nor reject the theoretical -CDM scenario. On the contrary, by adopting certain values for the free parameters of the chosen halo density profile in order to match the observations, we will be able to probe a density cusp, or a core or even something in between.
In this work, we first obtain the density profile of DM halos around a significant number of galaxies of different Hubble types with high-quality kinematic data. The intrinsic high quality of the data will allow us to disentangle the available kinematics in its dark and luminous contributions and to constrain the DM halo parameters allowing us to investigate the existence of a link between their structural properties and those of the ordinary baryonic matter (i.e. stars and gas).
2 Mass modelling from the Rotation Curves
It is necessary, before building a sample of objects with the mass model properly derived from the kinematics, to discuss the various sources of uncertainties relative to the task we want to undertake. In fact, inferring the halo density profile from a RC is complicated and it is certain that, in spite of applying an effective mass modelling method, we get ambiguous or incorrect results when the observational errors/biases/uncertainties are larger than a certain threshold. It is easy to anticipate that a main requirement for a proper analysis is that the RC’s are of high spatial resolution (see below) and that they do not show any significant non-circular motion: data must allow us to derive, at different radii, a suitable estimate of the circular velocity slope.
In order to detail this delicate point, let us write the halo density as an explicit function of observational quantities, namely the circular velocity, its gradient and the disk scale length, and of a derived quantity, the disk mass (Fall & Efstathiou, 1980):
| (6) |
where , is the disk mass and is a given function (for details see the original paper). It is easy to show that, since in the inner regions of galaxies the two terms in the r.h.s. balance themselves, even mild uncertainties in trigger off very large uncertainties in , even if is known. Small uncertainties in the amplitude and in the slope of the circular velocity are an absolute must for a proper kinematic density modelling of RC’s. Moreover, a high spatial resolution is also required in order to have a sufficient number of independent measurements to beat random errors and to be able to probe the radial constancy of the halo density in the central region, or to follow the NFW profile inside the cuspy zone. Notice also that a tight relationship between the stellar disk scale length and the dark halo core radius such as the one found in this paper cannot arise spuriously from uncertainties in the determination of , as shown in Appendix A.
We select our sample of rotation curves of disk systems by following the PSS and Borriello and Salucci (2001) prescriptions. The selected RC must satisfy the following quality requirements: 1) data extend (at least) out to the optical radius and to the halo core radius (when detected); 2) it is smooth and symmetric; 3) it has small internal r.m.s.; 4) it has high spatial resolution and a homogeneous radial coverage along both arms. The last requirements can be summarised by setting a maximum uncertainty of 3% in the RC amplitude and 0.05 in its logarithmic derivative.
Let us stress that, when the proper mass modelling is applied to the kinematics of galaxies of this suitably selected sample, nothing prevents us from detecting a halo core radius of zero length or with a value uncorrelated to any other galaxy quantity, if this is how Nature has arranged.
In Table 1 we list the sample of the galaxies selected within the above terms that we will use later in the analysis and their relevant parameters. The sample is not restricted to a single morphological type, but includes dwarfs, spirals, LSBs and it considers the most reliable halo density distributions obtained so far.
| Galaxy | type | Ref. | |||
|---|---|---|---|---|---|
| (1) | (2) | (3) | (4) | (5) | (6) |
| 531-G22 | Spiral | 3.3 | 5.9 | 33.4 | 1 |
| 533-G4 | Spiral | 2.7 | 4.7 | 39.2 | 1 |
| 563-G14 | Spiral | 2.0 | 3.5 | 60.9 | 1 |
| M-3-104 | Spiral | 1.5 | 6.3 | 37.7 | 1 |
| N755 | Spiral | 1.5 | 3.3 | 46.4 | 1 |
| U5721 | Dwarf | 0.5 | 1.1 | 123.0 | 2 |
| U8490 | Dwarf | 0.7 | 1.1 | 95.6 | 2 |
| U11707 | Dwarf | 4.3 | 17.5 | 1.2 | 2 |
| F568-V1 | LSB | 4.0 | 14.5 | 2.0 | 2 |
| N6822 | Dwarf | 0.7 | 1.7 | 33.7 | 3 |
| N3992 | Spiral | 6.5 | 23.2 | 2.5 | 4 |
| U4325 | LSB | 1.6 | 3.2 | 72.2 | 5 |
| N1560 | LSB | 1.3 | 2.1 | 29.4 | 5 |
| N3274 | LSB | 0.5 | 1.0 | 132.0 | 5 |
| N4455 | LSB | 0.7 | 2.4 | 22.6 | 5 |
| N4605 | Dwarf | 0.7∗ | 2.6 | 71.0 | 6 |
| F571-8 | LSB | 2.7 | 4.2 | 34.4 | 7 |
| F583-1 | LSB | 1.6 | 3.4 | 14.3 | 7 |
| N3109 | Dwarf | 1.3 | 2.4 | 24. | 8 |
| IC2574 | Dwarf | 2.2 | 6.9 | 5.9 | 8 |
| N5585 | Spiral | 1.6 | 2.2 | 42.5 | 8 |
| N2403 | Spiral | 2.1 | 4.8 | 17.7 | 8 |
| N2976 | Dwarf | 0.7∗ | 1.1 | 100.0 | 9 |
| 116-G12 | Spiral | 1.7 | 2.2 | 53.2 | 10 |
| 79-G14 | Spiral | 4.1 | 5.5 | 23.6 | 10 |
The distances of the galaxies have been taken directly in the original papers. They are computed by means of local calibrators or assuming Hubble flow after correction for Galactic rotation and Virgocentric flow, with =75 km/sec/Mpc. The uncertainties on the distances can be estimated about 0.30 mag, which implies an uncertainty on any galaxy logarithmic linear size of 0.12 dex.
Finally, let us point out that 1) in literature there are about 10 other objects for which the kinematics, although it fails our selection requirements, still provides a solid evidence for the presence of a core radius of which it is however unable to constrain the size (e.g. Salucci et al, 2003); 2) we failed to find objects of high/average quality kinematics that clearly prefer the NFW profile.
3 Mass models
Let us detail the mass model, and Freeman disk+ HI disk + pseudo-isothermal dark halo used to best fit .
3.1 Baryonic Disks
It is usually assumed that light traces the stellar mass via a radially constant mass–to–light ratio, so that the stellar disk contribution is given by ():
| (7) |
where . The circular velocity of the gas has also been included and derived from the surface density of the HI disk. Gaseous helium and metals have been taken into account by a simple rescaling factor of the surface density of 1.33. The contribution of the gaseous disk to the total rotation speed is found to be marginal. Only in the analysis of Borriello & Salucci (2001) and of Bolatto et al. (2002) the gas has not been included. However, both the authors note that its contribution in the explored region would not modify any of their results.
3.2 Dark Halos
We choose the pseudo–isothermal halo profile PI, adopted to model 20/25 of the sample RC’s, as the reference halo profile of this work
| (8) |
where and is the PI core radius. We link the core radius of this profile with that of the URC profile, adopted to model the Universal Rotation Curve, for the remaining 5 RC’s of our sample (those from Borriello & Salucci, 2001) and the sample of ellipticals we consider in the conclusions, by recalling that (see previous section) the two profiles almost coincide when (see also, for some examples, Gentile et al. 2004).
The of NGC 4605 in Bolatto et al. (2002) was fitted with in the original paper power-law density . To homogenise it with the analysis on all the other galaxies we have fitted their best fit profile in terms of Eq. 8 and derived =2.6 kpc.
We remind the reader that the free parameters of our fitting procedure are three, namely: , (or for the URC RCs) and . Finally, let us point out that, for most of the mass models in our Sample a maximun disk is not assumed, but the disk is found to be dominant at , as result of a fitting.
4 Results
A relationship between “halo core radii” and galaxy luminosities was hinted in Persic and Salucci (1988) and in an early (unrefereed) analysis of galaxy structure by Kormendy (1990). Subsequently, PSS found that the synthetic RC’s define an Universal Rotation Curve whose dark halo component has a core radius related to disk scale lengths and I-band magnitudes: . This result can be considered as a serious indication that the DM distribution relates to the properties of the luminous matter. It is, however only indicative in that: 1) the RC’s coaddition procedure and the relative building of the URC was optimised to properly derive the radial behaviour of the dark-to-luminous mass ratio rather than the inner slope of the dark halo density. 2) The relationship we are looking for must be primarily searched for in a sample of individual objects, in order to relate the relevant quantities in each individual object.
In this Section we investigate the properties of this “new entry” in galactic modelling, the DM core length , i.e. the scale length inside which the dark matter density varies very mildly, and outside which, it starts to decline as a power law. Is only a consequence of the fact that a cuspy distribution is a poor representation of actual DM density, or it is a real physical quantity related to the dynamical properties of the galactic systems? Moreover, could core radii arise from observational errors, as recently suggested (Swaters et al., 2003)?
The values of core radii for the objects in our sample, shown in Table 1, help to answer to these questions, revealing a tight correlation between and that we show in Fig. 1. This is well fitted by:
| (9) |
with being the correlation number and r.m.s. the least square scatter. The relation clearly exists at very high statistical confidence, in addition, LSBs and dwarfs follow the spirals’ distribution around the mean line with no segregation.
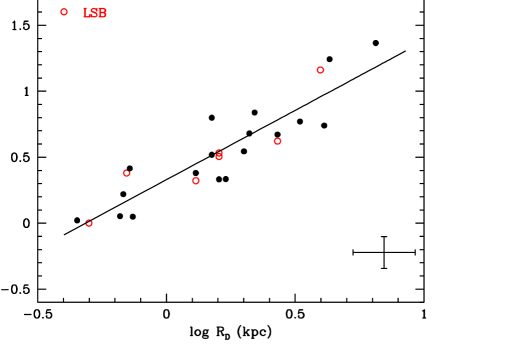
As stressed above, is derived by mere photometric measurements, while is obtained from the kinematics of the regions dominated by the dark matter. A spurious link between these two quantities cannot exist in that they are measured in separate ways, and the tight correlation between and cannot be induced by errors in the determination of (see Appendix A). Then, if: 1) the cored profile did not describe the actual dark matter density in galaxies or 2) the kinematics had serious observational errors/biases or 3) the dark/luminous decomposition was wrongly made, it is very difficult to imagine how such a tight relationship could have emerged.
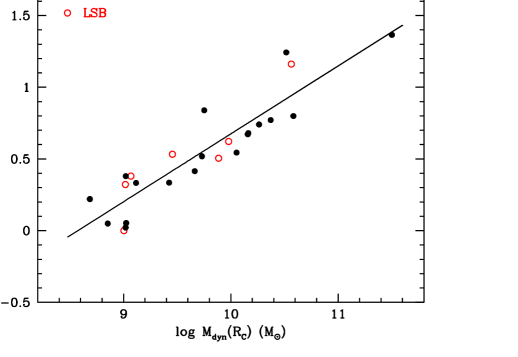
We find also a second tight correlation involving the core radius and the dynamical galaxy mass inside it, , that we plot in Fig. 2:
| (10) |
This is an additional link between an observed quantity, and the core size and there is no conceivable reason that would explain such a very tight relation in terms of observational or modelling biases, while it is very convincing that it simply indicates that the bigger the galaxy, the bigger the core radius. Notice that the slope of 0.47, very different from 1 in Eq. 10 – that relates two variables each one linearly dependent on galactic distance – implies that uncertainties on the latter affect very little both relationships in Eq. 9 and in Eq 10.
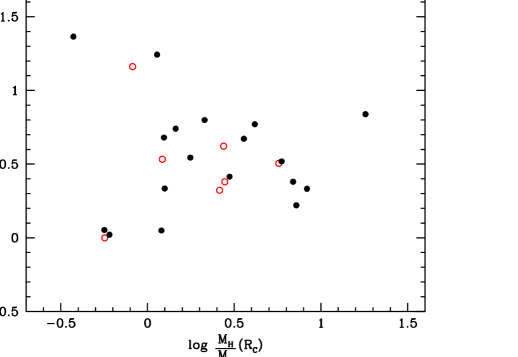
Finally, in the case of incorrect mass decomposition of RC’s, we would expect a particular spurious correlation between the core radius and the dark-to-luminous mass fraction (MF) at , in that both concur and compete to shape the RC profile (see Persic and Salucci 1990). In Fig. 3 we plot as a function of this fraction at : . The absence of a tight correlation is evident, and demonstrates that the values are not affected by gross misfits in the mass decomposition and, more importantly, that the size of the core radii does not seem to be primarily dependent on the fractional amount of DM in this region of galaxies.
Let us further notice that the above lack of a tight correlation cannot be related to the existence, at , of the trend between similar quantities, as implied by the results in PSS. By recalling that such relationship is found only at fixed multiples of disk scale lengths, we point out that the scatter of 0.16 dex in the vs relationship, though statistically small with respect to the length-scale range, is however large enough to imply that corresponds to very different galacto-centric distances in different galaxies, i.e. it corresponds to distances varying from to . As a result, the DM fractions computed at ’s are actually computed at a very different radii in different objects; and we do not expect to find there the correlations we found at each fixed multiple of .
5 Conclusions
There is a mounting evidence that the kinematics of disk galaxies can be explained in terms of the standard disk + halo components only if the density distribution of the latter decreases with radius very slowly from the center out to the radius inside which, instead, the density of CDM halos is predicted to fall as a power law with an exponent between -1 and -2. Here we have investigated this “observational” dark matter scale that is absent in the current theory of galaxy formation. We found that it correlates tightly with the exponential thin disk scale length and with the amount of gravitational mass that it encompasses . The high values for the correlation number, the smallness of the scatter around the relations and especially the fact that the pairs and , as well as and , are measured/derived independently from each others, ensure that we are dealing with real and physical relationships among physical quantities.
Three different levels of consequences follow. First, the claims according to which core radii arise as a consequence of 1) serious observational errors, 2) peculiar or biased kinematics, 3) wrong mass modelling that, until today, have been by-passed by considering a number of test-cases, can be now ruled out. This, on the basis that human/observational error hardly relate to intrinsic properties of galaxies. As an example the suggestion that observers have badly missed the galaxy center and doing so artificially created a core, cannot explain the additional evidence that this core is found to correlate with the galaxy disk scale length within the extraordinarily small scatter of 0.16 dex.
The second level realises that the core radius, the quantity that defines the unexplained feature of the distribution of the dark matter, correlates with the main quantity controlling the distribution of the luminous matter as well as the total mass within this radius. This indicates that the DM density in galaxies has been shaped by a dark–to–luminous matter coupling, a very challenging task if the former is collisionless. However, let us recall that, at least in dwarf systems, according to Navarro et al. (1996a), large mass outflows from galaxies, arising from supernovae explosions, can modify an initial NFW profile into a cored one, for which . From the results of the mass modelling given in PSS, we find , in excellent agreement with relationship (9). In any case, our result points toward some new physics of which it will be a crucial benchmark.
The third level is the realization that the core radius vs disk scale length relationship is Hubble type free, at least within a band of 0.16 dex. For the objects in our sample normal/dwarf spirals and LSB lay on the same vs relationship. Moreover, pioneering analysis on the DM distribution in ellipticals (Gerhard et al. 2001) finds halo core radii of sizes proportional to the half light radii (that correspond to 1.67 ): by analysing the mass model parameters of 21 Giant Ellipticals (shown in Fig 18 Gerhard et al. (2001), and made available by the authors) we find:
| (11) |
in very good agreement with Eq. (9). We caution that the sample of this work is quite limited to fully investigate the morphological dependence of DM properties and that in Gerhard et al.(2001) the data quality is barely sufficient for the intrinsically complicated mass modelling. Nevertheless, the emerging picture is truly impressive, especially when we consider that core radii of galaxies of different Hubble types do not correlate with galaxy luminosity: e.g. a similar value for is found in a spiral, in a LSB and in a giant elliptical. The core radius seems to uniquely relate to the exponential rate with which the stellar surface density decreases with radius.
The next step of this line of research post--CDM crisis would be to thoroughly investigate this DM distribution property in galaxies of different size and Hubble Types (Salucci et al., 2004) and the brightest galaxies because of the slightly non-linear relationship found between and the stellar scale length.
Acknowledgements
P.S. thanks I. Yegorova for help in the presentation.
References
- [1] Bolatto, A.D., Simon, J.D., Leroy, A., Blitz, L., 2002, ApJ, 565, 238
- [2] Borriello, A., Salucci, P., 2001, MNRAS, 323, 285
- [3] Borriello, A., Salucci, P., Danese, L., 2003, MNRAS, 341, 1109
- [4] Bottema, R., Verheijen, M.A.W., 2002, A&A, 388, 793
- [5] de Blok, W.J.G., Bosma, A., 2002, A&A, 385, 816
- [6] de Blok, W.J.G., McGaugh, S.S., Rubin, V.C., 2001, AJ, 122, 2396
- [7] Dutton, A.A., Courteau, S., Carignan, C., de Jong, R., 2003, ApJ subm., astro-ph/0310001
- [8] Fall, S.M., Efstathiou, G., 1980, MNRAS, 193, 931
- [9] Gentile, G., Salucci, P., Klein, U., Vergani, D., Kalberla, P., 2004, MNRAS, 351, 903
- [10] Gerhard, O., Kronawitter, A., Saglia, R.P., Bender, R., 2001, ApJ, 121, 1936
- [11] Kormendy, J., 1990, Proceedings of the Edwin Hubble Centennial Symposium, Berkeley, Astronomical Society of the Pacific, 33
- [12] Moore, B. 1994, Nature, 370, 629
- [13] Navarro, J.F., Eke, V.R., Frenk, C.S., 1996a, MNRAS, 283, L72
- [14] Navarro, J.F., Frenk, C.S, White, S.D.M., 1996b, ApJ, 462, 563 (NFW)
- [15] Persic, M., Salucci, P., 1988, MNRAS, 234, 131
- [16] Persic, M., Salucci, P., 1990, MNRAS, 245, 577
- [17] Persic, M., Salucci, P., Stel, F., 1996, MNRAS, 281, 27 (PSS)
- [18] Ratnam, C., Salucci, P., 2000, NewA, 5, 427
- [19] Ricotti, M., 2003, MNRAS, 344, 1237
- [20] Salucci, P., Ratnam, C., Monaco, P., Danese, L., 2000, MNRAS 317, 488
- [21] Salucci, P. Walter, F., Borriello, A., 2003, A&A, 409, 53
- [22] Salucci, P. et al. 2004, in prep.
- [23] Simon, J.D., Bolatto, A.D., Leroy, A., Blitz, L., 2003, ApJ, 596, 957
- [24] Swaters, R.A., Madore, B.F., van den Bosch, F.C., Blacells, M., 2003, ApJ, 583, 732
- [25] Weldrake, D.T.F., de Blok, W.J.G., Walter, F., 2003, MNRAS, 340, 12
6 Appendix A
For sake of completeness, we investigate how much observational errors in could bias the derivation of the halo density profile and, in particular, the determination of the core radius size . We checked this by means of the 4 high-resolution RC’s of spirals with an exponential thin disk stellar distribution published in Gentile et al. (2004). 444Two of these RC’s meet the requirements in Sect. 2; the other two are, however, of a quality sufficient for the aim of this Appendix: notice below that the effect investigated here leads to intrinsic variations of halo core radii much larger than those that arise from the observational uncertainties of the RC’s. First, we adopted for the photometric values, we best fit the RC’s and derived the DM halo core radii ’s. We then let the ’s to vary by an amount up to %, assuming in this way that the photometric values were wrong by this amount. Finally, we best-fit again the RC’s with these new values and derived the corresponding new values.
As a result, we find that values of even mildly different from the photometric ones could sometime lead to unacceptably high ’s for any value of the free parameters (for example, for the NGC1090 galaxy, =0.70 leads to a reduced , about five times greater than the one obtained for , which is ). This is in agreement with the fact that for , rotation curves are largely dominated by the disk that inprints on it its true disk scale-length value (see Salucci et al., 2000; Ratnam & Salucci, 2000).
The study of the fractional error in the estimate of core radius as a function of the (assumed) error in the disk scale length is shown in Fig. 4.

We realize that an observational error in may trigger an error in the inferred value of we get by fitting the same RC with the wrong value of : . We have 2 possibilities:
Large errors (%): can be large. However: i) in different objects the same (large) error in induces a very different : at a fixed the former spans values that are different among themselves also by 0.5-1 dex (see Figure 4). This is inconsistent with the observed scatter of 0.15 dex of the vs relationship; ii) the slopes of the spurious relationship that gets created in each object are completely different from the observed one of +1 (see Figure 4).
Small (%) errors: in this most likely case (in our sample the typical uncertainty is 5-10%555 The uncertainty on was given in the original paper only in some cases; in the other cases it was estimated by us.) turns out to be related with disk scale lengths (see Figure 4), but only at the level of dex, and therefore the photometric errors cannot possibly create the observed range of 1.2 dex shown by relationship (9).
We conclude the investigation by stressing that we can consider, for the aims of this paper, the (kinematic) measure of and the (photometric) measure of as independent.