Quiet Sun X-rays as Signature for New Particles
Abstract
We have studied published data from the Yohkoh solar X–ray mission, with the purpose of searching for signals from radiative decays of new, as yet undiscovered massive neutral particles. This search is based on the prediction that solar axions of the Kaluza–Klein type should result in the emission of X–rays from the Sun direction beyond the limb with a characteristic radial distribution. These X–rays should be observed more easily during periods of quiet Sun. An additional signature is the observed emission of hard X–rays by SMM, NEAR and RHESSI. The recent observation made by RHESSI of a continuous emission from the non–flaring Sun of X–rays in the 3 to keV range fits the generic axion scenario. This work also suggests new analyses of existing data, in order to exclude instrumental effects; it provides the rationale for targeted observations with present and upcoming (solar) X–ray telescopes, which can provide the final answer on the nature of the signals considered here. Such measurements become more promising during the forthcoming solar cycle minimum with an increased number of quiet Sun periods.
1 Introduction
In order to solve the strong CP problem (why the strong interaction contrary to weak interactions does not violate CP symmetry), a new neutral particle, the axion, with spin–parity has been invented (for recent review articles see, e.g. Raffelt, 1999, 2000; Bradley et al., 2003). Axions, along with Weakly Interacting Massive Particles (WIMPs), are the two leading particle candidates for dark matter in the Universe. If axions exist, they should be abundantly produced inside the solar core. An axion can be seen as a very light neutral pion (), with restmass eV/c2. However, while the interacts strongly and decays to two photons with a mean lifetime of s, the axion interacts very feebly with matter and is expected to decay to two photons () with a lifetime much longer than the age of the Universe. Therefore, detection techniques utilise the axion interaction with the electric field of atoms of underground detectors or strong magnetic fields, in order to (coherently) convert them to real photons. In other words, electric or magnetic fields play the role of a catalyser, which can transform axions into detectable photons. If very light axions ( few eV/) are produced inside the Sun, their thermal energy peaks at keV and they are ultra-relativistic. They mostly stream out of the Sun and can have an impact only on the evolution of a Star through the additional escaping energy (as it happens with neutrinos).
However, in recent theories of extra–dimensions, proposed as extensions of the Standard Model, the ‘conventional’, almost massless axions become as massive as the reaction energies involved. In the case of the solar axions, the expected mass spectrum of all the excited Kaluza–Klein (KK) states extends all the way to keV/c2 (Dienes et al., 2000; DiLella et al., 2000; Dilella & Zioutas, 2003). These high KK–masses imply a relatively shorter lifetime (s), because of the dependence. The underlying axion–photon–photon coupling constant, , which defines the interaction cross-section with ordinary matter, is the same for the ‘conventional’ almost massless axion and for the massive KK–axions. In this work, the KK–axions are taken as a generic example of particles which can be created inside the hot solar core. A small fraction of them (, as it has been estimated by Dilella & Zioutas (2003, hereafter DZ03)), are extremely nonrelativistic and they can be gravitationally trapped by the Sun itself in orbits where they accumulate over cosmic times. As shown in DZ03, their density increases enormously near the solar surface. The estimated mean distance of the KK–axion population from the Sun surface is .
If axions of the KK–type are gravitationally trapped and decay to two photons,111Following the decay mode , the two photons have the same energy and are emitted back–to–back, because of momentum conservation, since they are highly non-relativistic. then the observed X–ray surface brightness from the solar disk and limb can be a signature of the solar axion scenario. In this work, we discuss the expected surface density profile of the derived axion halo around the Sun (DZ03), and we compare it with published data taken by the Yohkoh soft X–ray telescope from the diffuse emission of two quiet Sun observations. In addition, the measured continuous emission of hard X–rays (below ) from the non–flaring Sun during the past years by different orbiting X–ray detectors is also considered.
2 The Signatures
2.1 Radial X–ray distribution
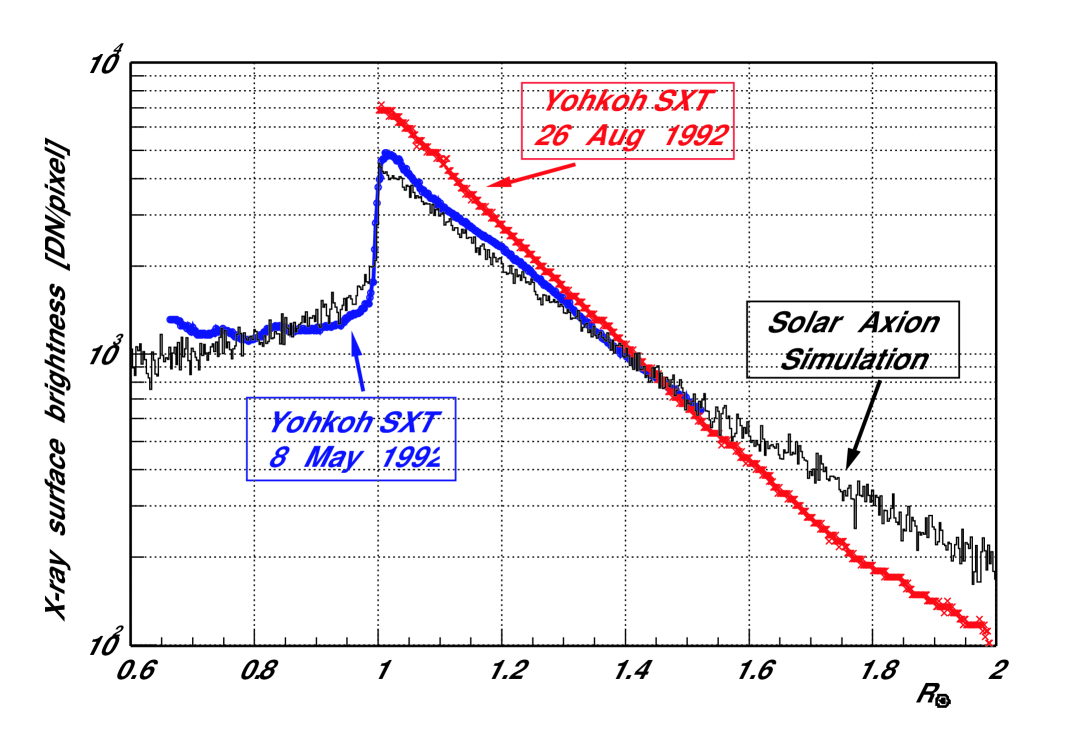
Assuming a spatial density distribution of radiatively decaying particles in the solar periphery as described in DZ03, we calculate the surface X–ray flux expected from inside and outside the solar disk by integrating over the line of sight (see Figure 1). In doing so, if the observed X–rays from the Sun direction are exclusively due to the radiative decay of massive non–relativistic particles along the pointing direction, their density distribution can thus be derived. This is actually a standard procedure applied in Astrophysics. The place around the solar limb, i.e. , provides a characteristic change in surface luminosity, because of the rapid change of the integration path length of the strongly absorbed photons from axion decay.
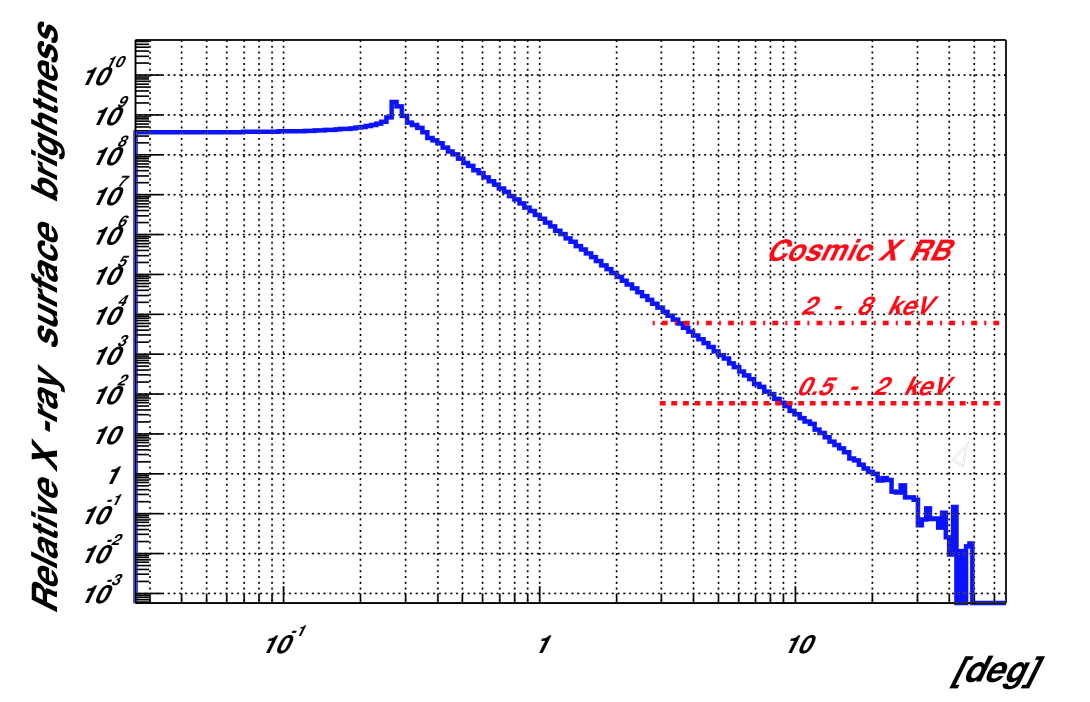
Figure 2 shows again the axion simulation used in Figure 1, covering an elongation angle up to away from the Sun. The level of the cosmic X–ray background (XRB) relative to that expected to come from the Sun is also shown. The XRB defines in fact the size of the predicted solar X–ray halo within the axion model; for the hard and soft energy band, it extends ‘only’ to and , respectively.
We suggest, therefore, that the detection of an extended X–ray halo around the Sun is a signature of KK–axions produced in the core of the Sun, if the contributions from conventional solar dynamical effects, e.g. flares, can be excluded. The X–ray surface brightness resulting from the decay of trapped axions is expected to be continuous and stable with time and to decrease exponentially with increasing distance from the Sun (see Figure 1 and 2). At first, this signature can be studied better during quiet Sun conditions, because any contributions from the dynamic Sun can thus be minimized. These conditions correspond to the Yohkoh solar data which we have used in this work. However, beyond a certain distance from the solar limb where even the impact of the active Sun becomes negligible, one could study continuously the X–ray emission from the periphery of the Sun. The next solar cycle minimum with extended quiet Sun periods can be utilized to perform such measurements. The field–of–view (FOV) of the X–ray telescope should cover the largest possible distances from the solar disk. The limited FOV of all imaging solar X–ray observatories ( at best) can be effectively widened by pointing away from the Sun centre.
Figure 1 shows the spatial distribution of two observations made by the Yohkoh imaging detector in the soft X–ray band ( keV) (Sturrock et al., 1996; Wheatland et al., 1997, hereafter SWA96 and WSA97). To the best of our knowledge, these are radially the most extended measurements of this kind from quiet Sun regions published so far. These two regions were assigned as being ‘quiet’ before this work, i.e. the selection was unbiased, and, it appears that the approach of SWA96 and WSA97 was reasonable. However, it is crucial that possible contributions from active regions on the solar disk into the limb region due to scattering in the X–ray telescope be excluded, because they give rise to a radial distribution similar to that expected from the decaying axions in the solar halo. The treatment of such far–scattering effects, based upon a correction made by Hara et al. (1994) on the Yohkoh PSF, as it was determined by Martens et al. (1995), reached the conclusion that bright nearby regions constitute a small but not insignificant fraction (WSA97).
The bulk of the published work from all solar instruments, operating since years in space, focuses onto the flaring Sun, with the quiet Sun being almost overlooked. However, the soft X–ray energy band of the Yohkoh observatory overlaps with the lower energy range of the axion model, which gives a broad distribution peaking at keV (DZ03). Then, these soft X–rays can be associated with particles of rest mass 2 (a few keV), i.e. they may be used to test the axion scenario (DZ03), extending it thus to lower energies, even though we can not argue quantitatively for this. From the solar axion Monte Carlo simulation, the radial distribution of the assumed KK–axions is actually independent on the axion restmass. Therefore, in this work we look first at the shape of the radial distribution of measured solar X–rays and we compare it with the shape predicted by the axion model. Of course, once X–ray observations at higher energies become available, they will allow a more quantitative comparison between prediction and observation.
The region chosen during the May 1992 observation was cleaned from so–called X–ray brightenings, which were three small regions with enhanced X–ray intensity. Keeping in mind the off–limb scattering considerations given above, this cleaning might explain the surprisingly high degree of agreement of the shape of the radial distribution of the May 1992 run with that expected by the axion model, in comparison with the August 1992 observation (see Figure 1). Therefore, the May 1992 measurement could be taken as the kind of evidence of the axion scenario we search for, if the flux diffusing out beyond the limb is really negligible. Therefore, the off–limb scattering issue must be looked at much more closely. In fact, Fig. 2 of the work by Sturrock et al. 1996 provides the estimated scattering component also across the solar edge, which makes only a 25 change. The tail(s) of the PSF from one or more bright points on the solar disk could in principle result to the observed X-ray intensity off the limb. However, it seems actually difficult to reconcile this picture with the PSF tail(s) with the measured change in brightness by as much as by a factor of 4 across the solar disk. Therefore, compared to the August 1992 run, the evaluated data from May 1992 are distinguished for the reasoning of this work. The measurement from August 1992 has the advantage of increasing the radial distance by a factor of 2, thus covering one solar radius beyond the limb. However, the agreement with the shape of the axion model is certainly not as good as it is the case for the May 1992 run. This is not surprising, since such observations are affected by uncertainties such as the level of contamination by hidden active regions (see above), or contributions from Bremsstrahlung and/or synchrotron radiation by the corona plasma, etc.
In addition, these observations were performed during a solar maximum, and the quiet Sun is not as quiet as during a solar minimum. Therefore, the observed degree of agreement between the two Yohkoh observations and the axion model is even more surprising. To put it differently, let us assume that the variations between the two experimental curves in Figure 1 reflect the underlying fluctuations (whatever the reason) between two independent measurements. Although only these two measurements are available, it is not unreasonable to assume that the underlying distribution should be some curve between them. Then, it would be more reasonable, because less biased, to compare our predictions with a curve obtained by the average of the two Yohkoh observations. In fact, these two observations made months apart show fluctuations from the average of some , while the radial X-ray brightness changes by as much as a factor of .
2.2 Quiet Sun hard X-ray emission
Interestingly, it has been recognized that the solar outer atmosphere is somehow continually and globally heated to MK temperatures, i.e. this heating is a ubiquitous quasi steady–state activity (Moore et al., 1999). We discuss below quiet Sun X–ray observations with photon detectors in space. To find such data is not an easy task, since all relevant missions are primarily interested in solar flares. However, for this work such observations provide important information on the radial X–ray distribution.
The emission of X–rays above 3.5 keV from the non-flaring Sun was first observed in the 1980’s by the HXIS spectrometer on SMM (Simnett, 1998; Simnett, and priv. comm., ). Later (1996–2001), the NEAR spacecraft mission to the asteroid 433 Eros provided quiescent solar X–ray spectra: a) directly with two solar monitors (Trombka et al., 1997), and b) indirectly from the scattered solar X–rays by Eros (Trombka et al., 2000; Starr et al., 2000). The analog X–ray spectra cover the to keV range.
The RHESSI observatory (Hurford & Krucker, 2002; Lin et al., 2002) has confirmed these results: it has observed a continuous X–ray emission, from 3 to keV, with frequent (every few minutes) microflaring (Lin, 2003a), when there are no observable flares present (McTierman, 2003). This continuous emission of hard X–rays is consistent with the solar axion scenario behind this work. For example, Figure 3 gives the measured X–rays by the GOES and RHESSI missions in orbit: a jump in the low energy count rate between 3 and 12 keV when the RHESSI day starts or ends, is clearly visible (Krucker et al., 2002). The GOES X–ray satellite intensity above 3.1 keV is also at its lowest level (around 02:20h), and there is no sign of a flaring Sun from both orbiting instruments. Since during this period the RHESSI counting rate is clearly above the detector background level, this excess X–ray intensity comes from the non–flaring Sun.
Additional observations can be found in Lin (2003b). Moreover, a statistical observation has been made 222In the period from October 2002 through May 2003. with such measurements (McTierman & Klimchuk, 2003). The measuring time–bin is one minute 333For comparison, the time resolution of the detector is msec. during detector daytime (with the Sun being in the RHESSI FOV), and its low energy counting rate is taken at a minimum. In order to avoid microflares, a statistical flatness check was applied one minute before and after each interval. For the so defined “quiet Sun” a temperature distribution of – 8 MK is derived. Such temperature values go well above the usually quoted quiet Sun corona temperature of 1 to 2 MK, and they may require careful interpretation.444Note that the applied procedure is valid within the concept of nanoflares (Klimchuk & Cargill, 2001) (i.e. frequent small energy bursts), which is not strictly compatible with the observed continuous hard X–ray emission (for a critical consideration of the advocated nanoflare hypothesis, which ‘seems to be close to be falsified’, see Berghmans, 2002), predicted this work. For example, it has been already noticed that the resulting Differential Emission Measure does not show a predicted peak near 3 MK (McTierman & Klimchuk, 2003). This might not be a surprise, since in related calculations “the effective line-of-sight thickness of the coronal plasma (or height for observations in the center of the disk) cannot be measured and must be assumed” (Mitra–Kraev & Benz, 2001), while the presence of possible plasma nonuniformities can further complicate the conventional interpretation (Klimchuk & Cargill, 2001).
2.3 Numerical estimates
From Figure 3 one can perform an approximate intercalibration between RHESSI and GOES, by using, for example, flare . The minimum rate above detector background around 02:15h is cts/s, highly significant statistically. This corresponds to a brightness of Watts/m2; i.e., the non–flaring solar X–ray luminosity in the range 3 – 12 keV is erg/s. One should note that the corresponding value used in the solar axion model was erg/s in the energy range 2 – 8 keV. Having in mind the relation 555Combining relation (1) and (2) in DX03. between the X–ray Luminosity and the axion–to–photon coupling constant , the lower X–ray luminosity derived above implies a smaller coupling constant: . However, we made the assumption that flare has the same X–ray energy spectrum as that from the non–flaring Sun. In fact, flares emit higher energy X–rays (as can be seen also in Figure 3 (bottom)), while the RHESSI detection efficiency increases very rapidly with energy. This tends to underestimate the photon intensity for the non–flaring Sun, and therefore, the above value for the coupling constant () is a safe lower limit (a value of 4-5GeV-1 might be reasonable).
Similarly, in order to derive a limit of the coupling constant from the Yohkoh observations, we assume that the axion model can be extended to the lower energy band of Yohkoh ( keV). The estimated quiet Sun X-ray luminosity between and keV is 666Note that at the SXT focal plane and that the pixel size is 2.5 arcsec (Tsuneta et al., 1991; Shimojo et al., 1996), i.e. the Sun disk makes pixels. Furthermore, the following input parameters were used in order to estimate the whole Sun soft X–ray luminosity (Tsuneta et al., 1991; Shimojo et al., 1996, SWA96, WSA97): intensity = 1200 DN/pixel, SXT effective area cm2, energy band width keV and exposure time = 136.5 s. The luminosity so obtained has been normalised to the same energy band width used at higher energies in the axion model (DZ03). For comparison, if we assume that 1 DN corresponds to erg at the Sun (Tsuneta et al., 1991; Shimojo et al., 1996), we arrive to a similar luminosity (however, under the assumption of a MK plasma). Note that RHESSI measured quiet Sun temperatures times higher (McTierman & Klimchuk, 2003), which should result in a lower luminosity. Therefore, the applied procedure is, so to say, model independent. erg/s. This much higher solar soft X–ray brightness implies, again according to the relation, a larger coupling constant, i.e. , in order to achieve a normalization between the two Yohkoh observations and the axion model (DZ03) shown in Figure 1. The value of derived from the keV range is still times smaller than the best experimental limit obtained by CAST (Hoffmann, 2003). For comparison, the corresponding value used in the solar axion model is . The implied simplifications or/and assumptions with the RHESSI and Yohkoh results provide a wide range of allowed values for the coupling constant:
with the axion model value being within these loose bounds. Notice that these are rough numerical estimates, and the solar axion model is a generic one.
3 Discussion
The discovery by Grotrian (1939) that the solar corona is hotter than the underlying photosphere has been a puzzle since then. Remarkably, recent experimental work in this field arrives to the conclusion that ‘… the results have made the coronal heating process even more of a mystery’ (Antiochos et al., 2003). Various conventional approaches (see, e.g., Suzuki, 2002) to understand this strange finding have been suggested in order to explain the coronal heating. The physical origin of the coronal heating remains one of the most fundamental problems in stellar (and solar) astrophysics (Güdel et al., 2003).
The solar axion scenario provides a continuous and steady energy input into the solar atmosphere. However, depending on the local physical conditions, e.g. magnetic field strength, plasma density, etc., an additional axion–to–photon conversion mechanism may enhance locally this energy input. Also, the derived density of the axion cloud is highest near the surface of the Sun. It is conceivable that with such a high density of boson states some additional as yet unforeseen effects might occur, which may be influenced by the physical environment. Then, the phenomenology associated with more elaborated models might provide important feedback to the axion scenario. We mention, for example, models of small–scale reconnection processes (e.g. Sturrock, 1999), which have seen much discussion in recent years (Suzuki, 2002). These models might point to a specific local property of the solar atmosphere, which can have an impact on the ubiquitous trapped axions. Having in mind the solar neutrino problem, it might well be that the solar corona problem points also to a solution based on non–standard (solar) physics. It is this approach that we follow in this work.
The radial distribution of the two independently measured Yohkoh images in soft X–rays and the axion model predictions (Figure 1) appear quite similar, suggesting a possible correlation between them. Interestingly, the findings of the same two quiet Sun investigations (SWA96, WSA97) also favour a mechanism that deposits somehow nonthermal energy as heat beyond the observed range of heights above the limb (R-2) in the quiet corona, consistent with an inward heat flux. Within the adopted model (SWA96, WSA97), there is no evidence for appreciable energy input over this radial range. However, an axion scenario, like the one used in this work, is consistent with these observations, including the continuous emission of hard X–rays from the quiet solar atmosphere. The observed X-rays below keV are much more energetic than the bulk of thermal photons from a MK solar corona plasma (e.g. keV).
4 Conclusion
Our work suggests that the importance of quiet–Sun solar X–rays should not be overlooked. This paper should provide motivation to the solar X–ray community to follow experimentally the arguments presented here and to reduce the uncertainties of relevant observations. The period during the (next) solar cycle minimum should provide still cleaner quiet Sun conditions. For example, offpointing observations with the RHESSI solar X-ray telescope can result to interesting data above keV. Even the pointing tests of the spacecraft on the 8 and 23 May 2003 might well contain useful solar data, in spite of the announcement that ‘data in this period should not be used for solar studies’ 777http://hesperia.gsfc.nasa.gov/hessi/ and http://hessi.ssl.berkeley.edu/dsmith/hessi/HME.html . Similarly, we suggest that the announced offpointing to the Crab Nebula from 16 June 2003 should be evaluated in the light of this work. From Figure 2 and the energy threshold of the RHESSI detectors, it follows that the relevant angular extension from the surface of the Sun is approximately .
Other non–solar X–ray telescopes can be of potential use for this work, provided they can reduce the elongation angle with the Sun. Then, instead of searching for solar axions only here at the site of the Earth, (solar) X–ray telescopes could provide new physics results associated with the solar X–ray halo. At present, these orbiting instruments are highly sensitive to X–rays below keV, which is within the region-of-interest for many astrophysical objects.
In order to explain the experimental approach of this work in a model independent way, an exotic effect like the axion scenario of this paper can be searched for in the following type of solar observations, provided conventional solar dynamical effects can be excluded: a) an off–pointing observation results to an increased radiation level while approaching the Sun. This should be the manifestation of a halo around the Sun whatever its radial distribution, and/or b) the measured level of any cosmic radiation from the blank sky does not diminish completely (according to the performance of the telescope) while pointing towards the solar disk, i.e. solar shadow effect is missing. The search for such a residual radiation from the solar disk direction might be the most sensitive approach, especially at photon energies above a few keV, where practically no emission is expected from the quiet Sun.
In summary, the radial distributions from the re–considered two Yohkoh X–ray observations of the quiet Sun (including the derived inward heat flux in the solar atmosphere of some nonthermal energy deposition beyond solar radius from the Sun surface) can be reconciled with a halo of decaying massive particles near the solar surface. New analyses of existing data may definitely clarify that instrumental scattering effects from bright points on the solar disk are small. More extended radial X–ray distributions (preferentially during a solar cycle minimum) can provide important information for the quiet Sun. An additional and independent evidence in favour of the axion scenario is the observed continuous emission of X-rays from the non-flaring Sun in the 3 to keV range. All these observations, when considered together, might suggest a non–conventional mechanism of the type assumed here. New X–ray measurements could clarify the nature of these relatively high energy effects around the Sun, for which an alternative conventional explanation is still missing.
References
- Antiochos et al. (2003) Antiochos, S.K., Karpen, J.T., DeLuca, E.E., Golub, L., Hamilton, P. 2003, ApJ, 590, 547
-
Berghmans (2002)
Berghmans, D., 10th SPM meeting,
Prague,
ESA SP-506 (2002)
(http://sol.oma.be/Publications/Publications/2002/Berghmans2002_SP506_a.pdf) - Bradley et al. (2003) Bradley, R. et al. 2003, Rev. Mod. Phys. 75, 777
- Cowie et al. (2002) Cowie, L.L. et al. 2002, ApJ, 566, L5
- Dienes et al. (2000) Dienes, K.R., Dudas, E., Gherghetta, T. 2000, Phys. Rev., D62, 105023
- DiLella et al. (2000) DiLella, L., Pilaftsis, P., Raffelt, G.G., Zioutas, K. 2000, Phys. Rev., D62, 125011
- Dilella & Zioutas (2003) DiLella, L., Zioutas, K. 2003, Astroparticle Physics, 19, 145 (DZ03)
- Grotrian (1939) Grotrian, W. 1939, Naturwissenschaften, 27, 214
- Güdel et al. (2003) Güdel, M., Audard, M., Kashyap, V.L., Drake, J.J., Guinan, E.F. 2003, ApJ, 582, 423
- Hara et al. (1994) Hara, H., Tsuneta, S., Acton, L.W., Bruner, M., Lemen, J.R., Ogawa, Y. 1994, PASJ, 46, 493
- Hoffmann (2003) Hoffmann, D.H.H. Conf. proc. Astroteilchenphysik in Deutschland, Karlsruhe, 16–18 September (2003), http://www-ik.fzk.de/workshop/atw/index.html
- Hurford & Krucker (2002) Hurford, G.J., Krucker, S. AAS 200th meeting, Albuquerque, NM, June 2002, Session [76.04], Bulletin of the AAS 34 (2002)
- Klimchuk & Cargill (2001) Klimchuk, J.A., Cargill, P.J. 2001, ApJ, 553, 440
- Krucker et al. (2002) Krucker, S. et al., 2002, Solar Physics, 210, 445
- Lin et al. (2002) Lin, R.P. et al. 2002, Solar Physics, 210, 3; see also Fig. 1 in Krucker et al. (2002)
- Lin (2003a) Lin, R.P. Abstract Nr. 532, in http://www.astronomy2003.com/ABSTRACTBOOK.pdf, p. 68, and, Adv. Space Res. 32 (2003a) 1001
- Lin (2003b) Lin, R.P. http://www-rccn.icrr.u-tokyo.ac.jp/icrc2003/talks/Highlight-Lin.pdf, p. 33, in 28th International Cosmic Ray Conference, July 31-August 7, Tsukuba, Japan (2003b)
- Martens et al. (1995) Martens, P.C., Acton, L.W., Lemen, J.R. 1995, Solar Physics, 157, 141
- McTierman (2003) McTierman, J.M., Klimchuk, J.A. 34th Solar Division Meeting, June 2003, Session [18.08], in Bulletin of the AAS, 35 (3) (2003)
- McTierman & Klimchuk (2003) McTierman, J.M., Klimchuk, J.A. http://sprg.ssl.berkeley.edu/jimm/spd2003poster.ppt
- Mitra–Kraev & Benz (2001) Mitra–Kraev, U., Benz, A.O. 2001, Astron. Astrophys., 373, 318
- Moretti et al. (2003) Moretti, A. et al. 2003, ApJ, 588, 696
- Moore et al. (1999) Moore, R.L., Falconer, D.A., Porter, J.G., Suess, S.T. 1999, ApJ, 526, 505
- Raffelt (1999) Raffelt, G.G. 1999, Ann. Rev. Nucl. Part. Sci., 49, 163
- Raffelt (2000) Raffelt, G.G. 2000, Phys. Rep., 333, 593
- Shimojo et al. (1996) Shimojo, M. et al. 1996, PASJ, 48, 123
- Simnett (1998) Simnett, G.M. in The Many Faces of the Sun. A Summary of the Results from NASA’s Solar Maximum Mission, edts. K.T. Strong et al., Springer Verlag, Berlin (1998) 201
- (28) Simnett, G.M., private communication
- Starr et al. (2000) Starr, R. et al. 2000, ICARUS, 147, 498 (see Fig. 11)
- Sturrock et al. (1996) Sturrock, P.A., Wheatland, M.S., Acton, L.W. 1996, ApJ, 461, L115 (SWA96)
- Sturrock (1999) Sturrock, P.A. 1999, ApJ, 521, 451
- Suzuki (2002) Suzuki, T.K. 2002, ApJ, 578, 598
- Trombka et al. (1997) Trombka, J.I. et al. 1997, J. Geophys. Res., 102 (E10), 23729 (see Fig. 20)
- Trombka et al. (2000) Trombka, J.I. et al. 2000, Science, 289, 2101 (see Fig. 2c)
- Tsuneta et al. (1991) Tsuneta, S. et al. 1991, Solar Physics, 136, 37
- Wheatland et al. (1997) Wheatland, M.S., Sturrock, P.A., Acton, L.W. 1997, ApJ, 482, 510 (WSA97)
The GOES and RHESSI (from top to bottom) X–ray observations during hour of low solar activity. The vertical lines define the spacecraft day. The RHESSI detector background level is measured before and after the daylight part of the orbit (dashed line). The RHESSI count spectrogram plot (bottom) is background subtracted. This Figure is taken from Krucker et al. (2002).