Neutral hydrogen absorption at the center of NGC 2146
Abstract
We present 1.4 GHz H i absorption line observations towards the starburst in NGC 2146, made with the VLA and MERLIN. The H i gas has a rotating disk/ring structure with column densities between 6 and 18 . The H i absorption has a uniform spatial and velocity distribution, and does not reveal any anomalous material concentration or velocity in the central region of the galaxy which might indicate an encounter with another galaxy or a far–evolved merger. We conclude that the signs of an encounter causing the starburst should be searched for in the outer regions of the galaxy.
keywords:
galaxies: starburst – galaxies: individual: NGC 2146 – galaxies: ISM – galaxies: kinematics and dynamics – radio lines: galaxies.1 Introduction
Atomic hydrogen absorption measurements on (sub)arcsecond scales allow us to investigate the distribution and dynamics of neutral gas in the inner regions of starburst galaxies and active galactic nuclei (AGN). While H i emission measurements with current instruments are sensitivity–limited to a maximum resolution of a few arcseconds, absorption studies are limited only by the angular resolution of the telescope and the brightness distribution of the background radio continuum. We present H i absorption measurements of the peculiar spiral galaxy NGC 2146.
It is well established that NGC 2146 is undergoing a strong starburst, even stronger than that in M 82 (e.g. Kronberg & Biermann 1981; Tarchi et al. 2000; later TNG); however, the origin of this starburst is still unclear. A starburst is often triggered by an interaction with another galaxy, which perturbs the potential equilibrium of the gas, causing a flow of gas towards the center which results in an increase in density and thus fueling of the star–formation process.
It therefore seems plausible that a starburst in a galaxy is triggered by an encounter if the galaxy belongs to a group which contains and still is connected by large H i tails, for instance like M 81 – M 82 – NGC 3077 (Yun, Ho & Lo 1994, Walter et al. 2002) and NGC 3627 – NGC3628 – NGC 3623 (the Leo triplet; Zhang, Wright, & Alexander 1993). Such an interaction has been searched for in NGC 2146 since the presence of a large H i cloud is known since 1976.
Using the NRAO 91–m telescope, Fisher & Tully (1976) detected a huge H i cloud extending out to six Holmberg radii ( 120 kpc) around NGC 2146. This cloud could be the consequence of a tidal interaction or of an explosion/ejection in the galaxy. However, there exists no kinematic evidence for the explosion hypothesis, and no companion has been found which may have interacted with NGC 2146. The higher resolution observations of the extended H i around NGC 2146 with the WSRT (Caspers & Shane, 1986) and the VLA (Taramopoulos, Payne & Briggs, 1996) resolved the cloud into a prominent tail, extending out to 90 kpc SE of the body of the galaxy, but no further evidence of an interaction was found at that time. In 1990, Hutchings et al. (1990) suggested instead that NGC 2146 appears to be in the final stage of a fairly gentle far–evolved merger, with the dominant galaxy (NGC 2146) now seen close to edge–on and the stripped companion being on a final plunge toward its center. The putative traces of this merger are, however, not particularly compelling. Evidence of a collision with another galaxy which did not remain embedded in NGC 2146 has been suggested as an alternative triggering mechanism by Young et al. (1988). They drew especially attention to the 10 kpc extended semi–arc of H ii regions (observed in H and [SII]), which is not coplanar with the rotating disk of the galaxy. A more recent analysis by Taramopoulos, Payne & Briggs (2001) (later TPB) of the H i stream suggests today a tidal interaction between NGC 2146 and a Low Surface Brightness (LSB) companion of which a remnant is apparently still seen as a 1.5108 M☉ H i concentration in the southern tail.
In order to study the kinematics and density of gas in the central region of NGC 2146 in the light of the proposed merger/encounter hypothesis, we have mapped the H i absorption towards the nuclear radio continuum emission using the VLA (18 resolution = 130 pc) and MERLIN (02 resolution = 15 pc). At the distance of NGC 2146 (14.5 Mpc, Benvenuti, Capaccioli & D’Odorico 1975), 1′′ is equivalent to 70 pc.
2 The observations and image processing
VLA Observation The H i line was observed towards NGC 2146 for a total of 11 hours on March 16 (5.5 hrs) and 17 (5.5 hrs), 2001, with the Very Large Array111The National Radio Astronomy Observatory is a facility of the National Science Foundation operated under cooperative agreement by Associated Universities, Inc. (VLA) in A–configuration. We observed with four 6.25 MHz IFs centered on the systemic velocity of the galaxy (893 km s-1; De Vaucouleurs et al. 1991). The QSO 0542+498 (21.94 Jy) was used as a flux calibrator; the QSO 0626+820 was used for phase and bandpass calibration. The data were Fourier–transformed using natural weighting to create a data cube with a restoring beam of and a noise level per channel of 0.2 mJy/beam. The radio continuum was subtracted using the AIPS task UVLSF. This task fits a straight line to the real and imaginary parts of selected channels and subtracts the fitted baseline from the spectrum, optionally flagging data having excess residuals. In addition, this procedure provides the fitted continuum as a UV data set, which has been used to create the naturally weighted map (Fig. 1).
MERLIN Observation The H i line in NGC 2146 was observed in June 1999 for 23 hours with MERLIN (6 antennas). The total bandwidth of 8 MHz was divided into 32 adjacent channels of 250 kHz width (52.6 km s-1). Three bad channels, two at the beginning and one at the end of the band, were removed, so that only 29 channels are present in the spectra. The frequency of channel 14 corresponds to a heliocentric velocity of 893 km s-1. The relative gains of the antennas were determined using the point source calibrator 0552+398, with a flux density of 1.754 Jy. The QSOs 3C286 (13.7 Jy) and 0602+780 were used for absolute flux density and phase calibration, respectively. The data were Fourier-transformed using natural weighting to produce a spectral line data cube. A naturally weighted continuum image was obtained by averaging 19 channels free of line absorption (channels 2 to 10 and 19 to 28). This uncleaned image was subtracted from the spectral line cube. Both the continuum image and the continuum-subtracted cube were then deconvolved using the CLEAN algorithm (Högbom, 1974) and convolved with the same beam (). The cleaned continuum was added back to the continuum-subtracted cube. The rms noise levels in source-free areas of the continuum maps and the spectral maps are and , respectively, consistent with the expected thermal noise.
3 The results
3.1 Spatial features and sources


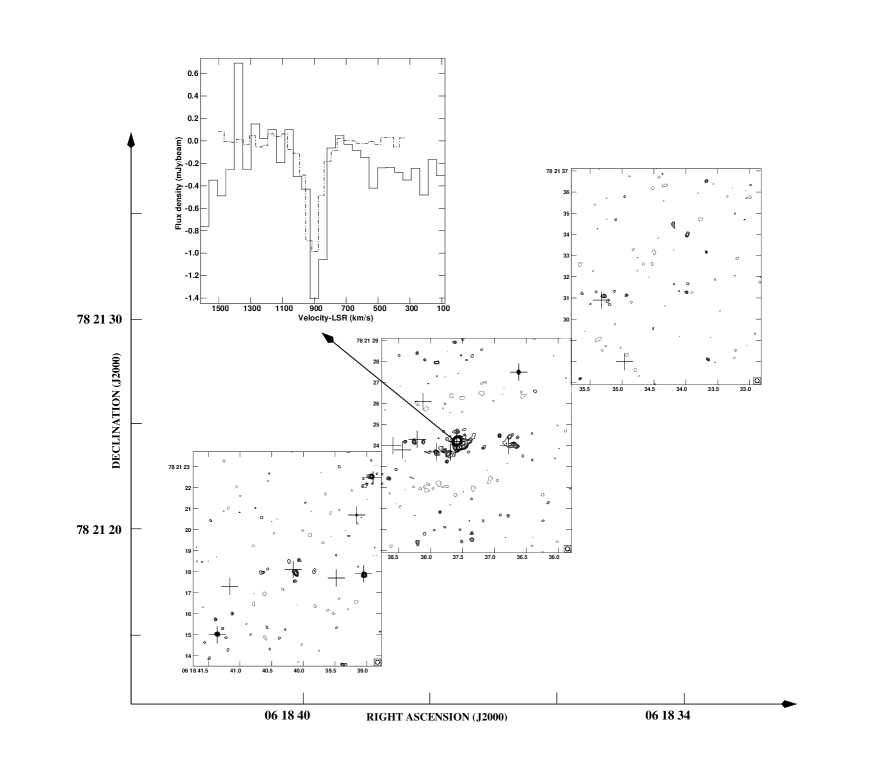
Fig. 1 shows the VLA A–array 1.4 GHz naturally weighted continuum image of the central 4.2 kpc1.8 kpc region of NGC 2146. The 24 mJy peak is at the center of the galaxy; three other weaker regions of emission are also detected. The higher resolution 1.4 GHz MERLIN map, shown in Fig. 3, resolves these emission peaks into individual supernova remnants and compact/ultra–dense H ii regions (TNG). The inserts in Fig. 1 are H i absorption spectra integrated over the brightest 9 pixels () surrounding six selected regions of NGC 2146. Four of these regions are associated with radio continuum emission peaks and two coincide with the position of the water masers reported by Tarchi et al. (2002).
The spectra taken across the 1.4 GHz map contain the H i absorption line. An optical depth cube has been created using the relation
| (1) |
where is the brightness temperature of the line, the brightness temperature of the continuum, and the optical depth of the line. We assume that the adopted excitation temperature of = 100 K is much smaller than .
Fig. 2 shows the average opacity () distribution derived in this way from the optical depth cube, blanking pixels with signal–to–noise ratio below 4. This map is not biased by the strength of the continuum. The H i absorption is seen as an elongated region of 2.4 kpc0.6 kpc extent, thus similar in extent to the starburst region, at a position angle of the major axis of NGC 2146 ( 140o). The extent and axial ratio of the H i absorption (and of the underlying emission) region of 1/4 is also seen in synchrotron emission maps taken at higher frequencies by Lisenfeld et al. (1996). Superimposed on the map of Fig. 2 are the positions of some prominent features in the nuclear region of NGC 2146, viz. the H i kinematic center (HI), the CO kinematic center (CO(C)), the 2.2 m peak of stellar radiation (IR), and the strong central radio continuum point source (P). For the position of the H i kinematic center we adopt the H i emission peak at the systemic velocity (see Fig. 4); the CO kinematic center is taken from Greve et al. (2004); the 2.2 peak is taken from the 2MASS Extended Source Image Server of the NASA/IPAC Infrared Science Archive (http://irsa.ipac.caltech.edu/index.html); the position of the central source is taken from TNG. The coordinates of these features are given in Table 1. When we consider that the CO emission peaks have extensions of a few hundred parsecs, we find from Fig. 2 that the H i opacity peaks coincide clearly with the tangential directions CO(NW, SE) of the molecular ring, but also to some extent with the central CO emission. It appears that the kinematic center of the H i gas coincides with the center of the molecular gas and the stars of the starburst region (see Fig. 2 in Young et al. 1988) to within the errors of the measurements ( 100 pc). Since in addition the orientation (PA) of the H i gas agrees with the orientation of the molecular gas and the stars, we believe that the H i gas is to a large extent co–spatial with these other constituents, thus belonging to the same kinematic body of material of the starburst region.
| Label | Description | R.A. (2000) | Dec. (2000) |
|---|---|---|---|
| 06h18m | 78°21′ | ||
| HI | H i kinematic center | 3758 | 2385 |
| CO(SE) | SE peak CO ring | 403 | 186 |
| CO(C) | CO central peak | 380 | 244 |
| CO(NW) | NW peak CO ring | 350 | 305 |
| IR | 2.2 peak (stars) | 3767 | 251 |
| P | Central radio point source | 3759 | 242 |
We have used the optical depth cube to compute the peak and the integrated optical depth of the lines extracted at the six positions mentioned above. The column density N (in ) of the absorbing material is calculated from
| (2) |
where = 52.6 is the velocity resolution of the observation, and = 100 K as typically used for starburst galaxies (e.g. Weliachew, Fomalont & Greisen 1984). The quantities derived in this way are listed in Table 2. Columns 1 and 2 give the radio continuum peak locations at which the spectra of Fig. 1 are taken; their 1.4 GHz continuum peak flux densities are listed in Column 3. Columns 4 to 8 summarize the H i absorption properties at these locations, i.e. the line velocity and width, and the peak and integrated optical depth derived from Gaussian profiles fitted to the spectra. Column 9 gives the corresponding H i column density.
| R.A. | Dec. | S1.4 | N | direction | ||||
|---|---|---|---|---|---|---|---|---|
| 06h18m | 78°21′ | (km s-1) | (km s-1) | of | ||||
| (J2000) | (J2000) | (FWHM) | ||||||
| 3515 | 305 | 12.2 (0.2) | 1035 (3) | 100 (7) | 0.60 (0.03) | 64 (4) | 11.7 (0.7) | |
| 3664 | 277 | 11.3 (0.2) | 978(4) | 136 (8) | 0.37 (0.02) | 53 (3) | 9.7 (0.5) | H2O maser |
| 3758 | 242 | 23.7 (0.2) | 907 (1) | 99 (3) | 0.40 (0.01) | 42 (1) | 7.7 (0.2) | central source |
| 3758 | 242 | 3.99 (0.08) | 879 (6) | 99 (16) | 0.48 (0.1) | 48 (5) | 9.0 (1) | central source |
| 3863 | 240 | 15.1 (0.2) | 842 (2) | 115 (5) | 0.25 (0.02) | 30 (1) | 5.5 (0.2) | H2O maser |
| 3920 | 200 | 12.7 (0.2) | 817 (1) | 91 (3) | 0.46 (0.03) | 44 (1) | 8.0 (0.2) | |
| 4024 | 182 | 12.0 (0.2) | 778 (0.1) | 58 (0.2) | 0.75 (0.04) | 47 (0.1) | 8.6 (0.02) |
In the 1.4 GHz naturally weighted continuum MERLIN map (Fig. 3) we find 10 of the 18 compact sources detected at 5 GHz as reported by TNG. Of these 10 sources, only the central one, 37.6+24.2 (for the source notation see TNG), shows a clear H i absorption line as illustrated in Fig. 3. This MERLIN spectrum is obtained from an integration over the brightest 9 pixels surrounding the source peak (). The absorption properties of this line are derived in the same way as described for the VLA data and are reported in boldface in Table 2; there exists good agreement between the VLA and MERLIN data. The higher sensitivity VLA observation does not confirm the three other weak absorption features tentatively detected with MERLIN and reported by Tarchi et al. (2001). The other 1.4 GHz MERLIN detected sources are too weak at the MERLIN resolution, and do not show any absorption above the noise level. When assuming an excitation temperature of 100 K and a linewidth of 100 km s-1(two channels), the indicative upper limit for a compact source of 0.7 is . This limit is consistent with the H i column density derived from the VLA data.
3.2 Rotation velocities
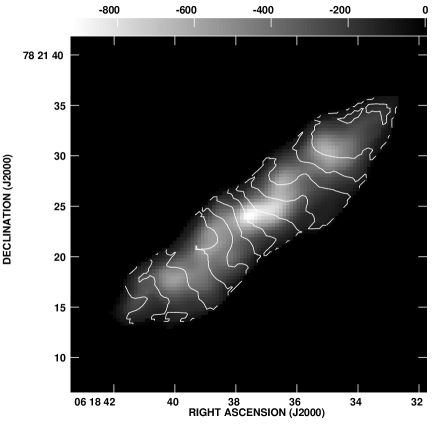
Individual velocity channel maps with significant H i absorption extracted from the continuum–subtracted naturally weighted cube are shown in Fig. 4. Absorption can be traced over 10 channels, with the maximum of the emission shifting with increasing velocity from the east ( 1 kpc) to the west ( 0.9 kpc) of the center. This figure clearly shows the rotation of the H i absorption material, and also indicates the feature of a ring–like emission as seen especially in the CO observations (Jackson & Ho 1988; Young et al. 1988). Fig. 5 shows the integrated total intensity map of the H i absorption, extracted from the continuum subtracted cube, with superimposed the isovelocity contours of the absorbing H i gas. Using a systemic velocity of 893 km s-1, the rotation of the disk of H i gas increases from – 150 km s-1 in the east to + 170 km s-1 in the west.

Finally, in Fig. 6 we compare the rotation velocity of the H i absorption with the rotation velocity of the molecular gas (CO) and the ionized gas (H). We find that the H i material rotates in the same way as the other constituents of the starburst region. This fact confirms that the H i gas seen in absorption is concentrated in, or close to, the starburst region. In addition we find that the rotation of the H i gas, the molecular gas, the ionized gas, and the stars within 2 kpc of the starburst region (Greve et al. 2004) is smooth and does not reveal evidence of any disturbance from a galaxy encounter or a merger.

The H i line width (Table 2) agrees well with the width of the CO lines and the width of emission lines originating in the ionized gas. The spectra of Fig. 1 and the values in Table 2 suggest that the line widths of the absorption features at the maser positions are systematically broader by 28 5 km s-1 than those at the other closeby positions, perhaps indicating a more turbulent medium in the recent star formation region.
4 Discussion
The only previous single–dish study of H i gas in NGC 2146 by Fisher & Tully (1976) did not reveal any absorption, because of the low spatial resolution of the observation ( 10″= 700 pc). The first detection of H i absorption in NGC 2146 is mentioned by Taramopoulos, Payne & Briggs (1996); later TPB reported details of the detection. They found that the absorption is lying in the region of the obscuring dust, having a velocity width of 350 km s-1 (thus covering the whole velocity range of rotation) and an average optical depth of 0.03. However, their VLA D–array observation was unable to spatially resolve the absorption. The higher spatial resolution VLA A–array observation presented here reveals H i absorption in front of the radio continuum emitted in the central 2 kpc of NGC 2146, allowing the construction of a map of its spatial distribution and its rotation. When discussing H i absorption measurements it must be remembered that any absorption depends on the continuum strength against which it is seen. The optical depth images, on the other hand, are less dependent, if not independent, of the continuum and represent the column density distribution of H i (Eq.(2)). The strongest absorption is therefore observed against the brightest compact radio source at the center of NGC 2146, while in the optical depth map of Fig. 2 the regions with the highest column density of H i are instead distributed almost symmetrically with respect to the central source. The optical depth lies between a minimum value of 0.3 and a maximum of 0.9, which for a typical linewidth of 100 km s-1 corresponds to H i column densities between 6 and 18 , respectively. When using the relation between the H i column density (cm-2) and the optical extinction derived by Savage & Mathis (1979), and assuming for NGC 2146 the same gas–to–dust ratio as in our Galaxy, we obtain = 4 11m which is consistent with the extinction of 4m 7m derived by e.g. Benvenuti, Capaccioli & D’Odorico (1975), Smith, Harvey & Lester (1995), and Jackson & Ho (1988).
The H i absorption velocity field (Fig. 5) is very smooth and similar to the rotation of the molecular and ionized gas as shown in Fig. 6, which supports the structure of a rotating disk of H i gas. The coincidence of the spatial distribution of the H i material with the extent of the continuum radiation of the starburst region, and the agreement with the rotation curves of the other constituents, suggests that the observed H i material is close to, or mixed with, the material of the central region. This is also supported by the fact that the H i absorption seems to trace the molecular ring (see Fig. 2) although it is not seen as a distinct feature in the synchrotron radiation (Lisenfeld et al. 1996). The rotation of the gas shown in Fig. 6 indicates a dynamic mass inside 2 kpc of 1.21010 M☉, for a galaxy inclination between 65°to 60°. The dynamic mass concentrated in this region is probably about 1/5 th, or less, of the total mass of the galaxy of at least 51010 M☉ (Benvenuti et al. 1975).
Neutral hydrogen absorption studies of other starburst (and Seyfert) galaxies appear to trace gas in the central disks of the host galaxies to radial extents of a few hundred parsec only (Gallimore et al. 1999). The H i gas is usually aligned to the larger outer disk of the host galaxy. None of the H i absorption studies of the other starburst galaxies shows a clear indication of an interaction by infall or outflow of gaseous material, and NGC 2146 is in this respect no exception. Following the argumentation of Gallimore et al. (1999, their Eq.(2)), the parameters N21 51021 cm-2 (Table 2), vrot 150 km s-1 at r 1 000 pc (Fig. 6) give a surface density ratio of the visible disk of H i absorption material of which is well below the critical density necessary to push the disk to instability.
In other starburst galaxies the interaction is primarily evident from extended H i emission tails linking the interacting companions, as for example clearly seen in the M 81–tiplet (Yun, Ho & Lo 1994, Walter et al. 2002) and the NGC 3628–triplet (Schmelz, Baan & Haschick 1987). This interaction has apparently produced a bar in M 82 and NGC 3628, which fuels the starburst. While NGC 2146 has prominent H i tails, a link to an interacting companion has not been found, and a bar has not been established.
While numerical simulations do confirm that mergers and flyby encounters (with proper geometrical constraints) can be successfull triggers of starburst (e. g. Mihos, Richstone & Bothun 1992), the rapid gas depletion due to the star formation activity limits the duration of such starbursts to between 50 to 150 Myr depending on the interaction’s details (e. g. Mihos & Hernquist 1996).
For NGC 2146, TPB conclude that the trajectory of extended H i gas suggests that a possible interaction was in its most violent phase about years ago. Then there should have been enough time for the gas in the inner region to relax, as observed, into a disk222A simplistic upper limit for the relaxation time () can be obtained from the time of a perturbing wave, caused by the interaction, to cross, at a velocity () equal to the inner-galactic sound speed ( km s-1), the starburst region with a diameter () = 3 kpc. This time is years. However, the starburst, if coeval with the interaction, should be already terminated. On the contrary, the starburst in NGC 2146 is presently powerful (e.g. Kronberg & Biermann 1981) and relatively young (e.g. TNG), e. g. younger than the one in M 82, and thus contradicting a possible age of 109 years. The additional suggestion by TPB that the extended gas is falling into, and will continue to fall into NGC 2146 could explain how the present starburst is fueled. However, in this case we would also expect a sign of gas inflow, while we find instead that the distribution of the gas and stars in the inner 6 kpc is undisturbed and smooth.
We might speculate that recursive short ( years) starbursts have occured since the merging/tidal encounter event, and that today we are witnessing the youngest of them, as it has likely happened in M 82 (e. g. de Grijs, O’Connell & Gallagher 2001). In such a case the necessary amount of gas to fuel the star formation activity would be smaller and the infall of gas less mandatory. This speculation does, however, not cast any light on the origin of the starburst.
Whatever possibility may be correct, the origin and fueling mechanism of the starburst in NGC 2146 must, in our opinion, be searched for at large distances from the center, i.e. outside the body of the galaxy, where distortions of the distribution of gas and stars are seen.
5 Summary and Conclusions
From the 1.4 GHz H i absorption line observations towards the starburst in NGC 2146, made with the VLA and MERLIN, we reach the following conclusions:
– the H i absorption is observed over the entire continuum radiation background which coincides with the starburst region;
– the H i gas towards the starburst region has a column density between 6 and 18 ;
– the H i velocity field has the structure of a rotating disk and ring, as often found in the inner region of similar starburst systems;
– the H i absorption has a uniform spatial and velocity distribution without any indication of an encounter with another galaxy or a far-evolved merger; there is no indication of a bar;
– the absence of anomalous gas concentration or velocities and the agreement of the H i absorption rotation curve with those of different constituents (CO and H), suggest that the inner gas has had time to relax after the encounter; the signs of an encounter causing the starburst must be searched for in the outer regions of the galaxy.
6 Acknowledgments
We are grateful to the VLA and MERLIN staff for technical support. A.T. would like to thank Daniela Vergani and Filippo Fraternali for insightful discussions, and Tom Muxlow, Simon Garrington, and Matteo Murgia for useful comments. We thank the referee for his/her pointed and clarifying comments. This research has made use of the NASA/IPAC Infrared Science Archive, which is operated by the Jet Propulsion Laboratory, California Institute of Technology, under contract with the National Aeronautics and Space Administration.
References
- Benvenuti, Capaccioli & D’Odorico (1975) Benvenuti P., Capaccioli M., D’Odorico S., 1975, AA, 41, 91
- Caspers & Shane (1986) Caspers H. C. M., Shane W.W., 1986, in Light on Dark Matter, D. Reidel Publishing Company, p. 445
- de Grijs, O’Connel & Gallagher (2001) de Grijs R., O’Connell R. W., Gallagher J. S., III, 2001, AJ, 121, 768
- De Vaucouleurs et al. (1991) De Vaucouleurs G., De Vaucouleurs A., Corwin H. G. Jr., Buta R. J., Paturiel G., Fouque P., 1991, Third Reference Catalogue of Bright Galaxies, Version 3.9
- Fisher & Tully (1976) Fisher J. R., Tully R. B., 1976, A&A, 53, 397
- Gallimore et al. (1999) Gallimore J. F., Baum S. A., O’Dea C. P., Pedlar A., Brinks E., 1999, ApJ, 524, 684
- Greve et al. (2004) Greve A., Neininger N., Sievers A., Tarchi A., 2004, in preparation
- Högbom (1974) Högbom J. A., 1974, A&AS, 15, 417
- Hutchings et al. (1990) Hutchings J. B., Lo E., Neff S. G., Stanford S. A., Unger S. W., 1990, AJ, 100, 60
- Jackson & Ho (1988) Jackson J. M., Ho P. T. P., 1988, ApJ, 324, 5
- Kronberg & Biermann (1981) Kronberg P. P., Biermann P., 1981, ApJ, 243, 89
- Lisenfeld et al. (1996) Lisenfeld U., Alexander P., Pooley G. G., Wilding T., 1996, MNRAS, 281, 301L
- Mihos, Richstone & Bothun (1992) Mihos C. J., Richstone D. O., Bothun G. D., 1992, ApJ, 400, 153
- Mihos & Hernquist (1996) Mihos C. J., Hernquist L., 1996, ApJ, 464, 641
- Savage & Mathis (1979) Savage B. D., Mathis J. S., 1979, ARA&A, 17, 73
- Schmelz, Baan & Haschick (1987) Schmelz, J. T., Baan, W. A., Haschick, A. D., 1987, ApJ, 315, 492
- Smith, Harvey & Lester (1995) Smith B. J., Harvey P. M., Lester D. F., 1995, ApJ, 442, 610
- Taramopoulos, Payne & Briggs (1996) Taramopoulos A., Briggs F. H., Payne H., 1996, in 2nd Hellenic Astronomical Conference: proceedings, Hellenic Astronomical Society, p. 441
- Taramopoulos, Payne & Briggs (2001) Taramopoulos A., Payne H., Briggs F. H., 2001, A&A, 365, 360; TPB
- Tarchi et al. (2000) Tarchi A., Neininger N., Greve A., Klein U., Garrington S. T., Muxlow T. W. B., Pedlar, A., Glendenning, B. E., 2000, A&A, 358, 95; TNG
- Tarchi et al. (2001) Tarchi A., Neininger N., Klein U., Pedlar A., Greve A., 2001, in Galaxy Disks and Disk Galaxies, eds. José G. Funes, S. J., Enrico Maria Corsini, ASP Conference Series, p. 507-508
- Tarchi et al. (2002) Tarchi A., Henkel C., Peck A. B., Menten K. M., 2002, A&A, 389, 39
- Walter et al. (2002) Walter F., Weiss A., Martin C., Scoville N., 2002, AJ, 123, 225
- Weliachew, Fomalont & Greisen (1984) Weliachew L., Fomalont E. B., Greisen E. W., 1984, A&A, 137, 335
- Young et al. (1988) Young J. S., Claussen M. J., Kleinmann S. G., Rubin V. C., Scoville N., 1988a, ApJ, 331, 81L
- Yun, Ho & Lo (1994) Yun M. S., Ho P. T. P. Lo, K. Y., 1994, Nature, 372, 530
- Zhang, Wright, & Alexander (1993) Zhang X., Wright M., Alexander P., 1993, ApJ, 418, 100