Radio continuum observations of the Virgo cluster spiral NGC 4522
The signature of ram pressure
Abstract
Radio continuum observations at 20 and 6 cm of the highly inclined Virgo spiral galaxy NGC 4522 are presented. Both, 20 and 6 cm total emission distributions are asymmetric with an extended component to the west where extraplanar atomic gas and H emission are found. The 6 cm polarized emission is located at the eastern edge of the galactic disk. Its peak is located about 1 kpc to the east of the total emission peak. We argue that this phenomena is a characteristic feature for cluster galaxies which are experiencing significant pressure from the intracluster medium. The degree of polarization decreases from the east to the west. The flattest spectral index between 20 and 6 cm coincides with the peak of the 6 cm polarized emission. These findings are consistent with a picture of a large scale shock due to ram pressure located at the east of the galaxy where cosmic rays are accelerated. We conclude that it is likely that the galaxy experiences active ram pressure.
1 Introduction
The Virgo cluster spiral galaxy NGC 4522 is one of the few Virgo galaxies where we can directly observe the effects of ram pressure due to the galaxy’s rapid motion in the intra-cluster medium. Kenney & Koopmann (1999) observed this galaxy in the optical and the H line with the WIYN telescope. Whereas the highly inclined, old stellar disk appears symmetric, the distribution of ionized gas is highly asymmetric. The H disk is sharply truncated beyond 0.35 . Ten percent of the H emission arises from extraplanar Hii regions that are exclusively located to the west of the galactic disk. Kenney & Koopmann (1999) argue that this ionized gas distribution is reminiscent of a bow shock morphology, which suggests that the gas is pushed to the west by ram pressure.
Vollmer et al. (2000) obtained an H velocity field with the Fabry-Perot Interferometer at the Observatoire de Haute Provence. The galactic disk shows a symmetrically rising rotation curve. The velocities of the extraplanar emission regions are not part of this regular rotation. Their kinematic behaviour cannot be reproduced by rotation within a gravitational potential of any known disk or halo model. Thus this gas is located out of the galactic plane and/or is accelerated/decelerated.
NGC 4522 has a large line-of-sight velocity with respect to the cluster mean (1300 km s-1) and is located at a distance of 3.3o (1 111We use a distance of 17 Mpc to the Virgo clusterMpc) south from the Virgo cluster center (M87). The intracluster medium (ICM) density at these distances might not be high enough to strip the gas at a galactic radius of 0.35 . This is why Vollmer et al. (2000) argued that NGC 4522 has been severely affected by ram pressure in the past and the extraplanar filaments represent gas that has been pushed to larger distances from the galaxy center and is now falling back onto the galactic disk.
Recently, Kenney et al. (2003) observed NGC 4522 in the Hi 21 cm line with the VLA. They found an atomic gas distribution that is similar to that of the ionized gas: a truncated Hi disk with two high column density blobs in the north-west and the south-west. The Hi velocity field of the extraplanar emission regions shows clear deviations from the overall rotation pattern.
Even with the distributions and velocity fields of the atomic and ionized gas it is still unclear if the galaxy is experiencing ongoing ram pressure stripping or if the extraplanar gas is falling back to the galaxy after a past ram pressure stripping event. On the one hand the galaxy’s location and radial velocity excludes a simple radial orbit advocated by Vollmer et al. (2000), on the other hand with the ongoing stripping scenario it is not clear if ram pressure is strong enough at such a large distance from the cluster center where the ICM density is lower than average.
Observations of the polarized radio continuum radiation can give important and complementary information on the gas dynamics as has been shown for the barred galaxy NGC 1097 (Beck et al. 1999). This radiation traces the ordered large scale (1 kpc) magnetic field in galactic ISM. This magnetic field is very sensitive to (i) compression and (ii) shear motion, which are both difficult to detect in radial velocity fields. Thus, enhanced polarized radio continuum radiation can be a sign of compression or strong shear motion in the gas. Both kinematic features are present during a ram pressure stripping event (see e.g. Vollmer et al. 2000): a galaxy on a highly eccentric orbit within the cluster experiences compression due to ram pressure when it passes through the cluster core (compression phase); after the core passage ram pressure ceases and the gas starts to fall back onto the galactic disk, which gives rise to strong shear motions.
Observationally, there are only two Virgo cluster galaxies observed deeply in the polarized 6 cm radio continuum, because this is very time consuming (NGC 4254, Soida et al. 1996, and NGC 4654, Chyzy et al. in prep.). Both galaxies show an asymmetric distribution of polarized radio continuum emission.
In order to interpret the polarization data, numerical modeling is important, because different dynamical features, such as compression or shear, can produce polarized emission maxima. Otmianowska & Vollmer (2003) solved the induction equation using the velocity fields of Vollmer et al. (2002) in order to calculate the evolution of the large scale magnetic field during a stripping event. In a second step they calculated the polarized radio continuum emission and made maps of its evolution that can be directly compared to observations. We will apply this method to a dynamical model designed for NGC 4522 in a forthcoming paper.
In this article we present radio continuum observations at 6 cm and 20 cm obtained with the VLA. The outline of the article is as follows. The observations are described in Sec. 1. The results are discussed in Sect. 2. We compare our results to radio observation of field galaxies (Sect. 4) and compare our data with existing Hi and H maps (Sect. 5). The discussion in Sect. 6 is followed by the conclusions in Sect. 7.
2 Observations
NGC 4522 was observed on December, 26 and 31, 2001 with the Very Large Array (VLA) of the National Radio Astronomy Observatory (NRAO)222NRAO is a facility of National Science Foundation operated under cooperative agreement by Associated Universities, Inc. D array configuration. The observation times were 9 h at 6 cm and 1 h at 20 cm. The band passes were MHz at 6 cm and 20 cm. We used 3C286 as flux calibrator and 1254+116 as phase calibrator, which was observed every 40 min. The beam sizes of the final maps are at 20 cm and at 6 cm. Solar activity caused interferences at short baselines at 20 cm. Therefore, we had to remove a considerable amount of visibilities. This increased our final rms of the 20 cm map. Maps where made for both wavelengths using the AIPS task IMAGR with ROBUST=0, which is in between pure uniform weighting (-5) and pure natural weighting (5). We ended up with an rms of 150 Jy/beam at 20 cm in total intensity and 10 Jy/beam at 6 cm in total and polarized emission.
In addition, we use the Hi 21 cm line continuum of Kenney et al. (2003) an effective bandpass of 68 channels e.g. 3.3 MHz. NGC 4522 was observed during 6.7 h with the VLA CS array configuration, which lead to a 20 cm continuum rms of 160 Jy/beam at a resolution of .
The total power flux of the low resolution 20 cm D array data is 24.3 mJy and that of the Hi line continuum data is 25.2 mJy. Both values are very close to the NVSS (Condon et al. 1998) flux of 22.3 mJy. The total power flux at 6 cm is 7.6 mJy.
3 Results
3.1 20 cm data
Since the two sets of 20 cm continuum data have very different angular resolution, we present them separately.
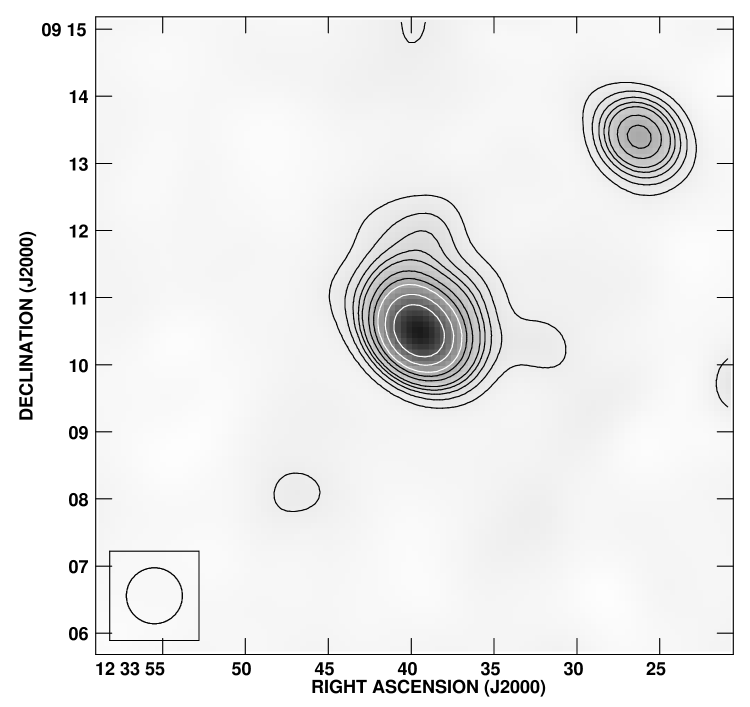
The D array 20 cm total emission is shown in Fig. 1. The disk of NGC 4522 is clearly detected. The visible asymmetries in the north and the south-west are due to point sources as can be seen in the 6 cm data (Sect. 3.2), which have a 3 times higher resolution. Along the minor axis, the emission is slightly more extended to the west.
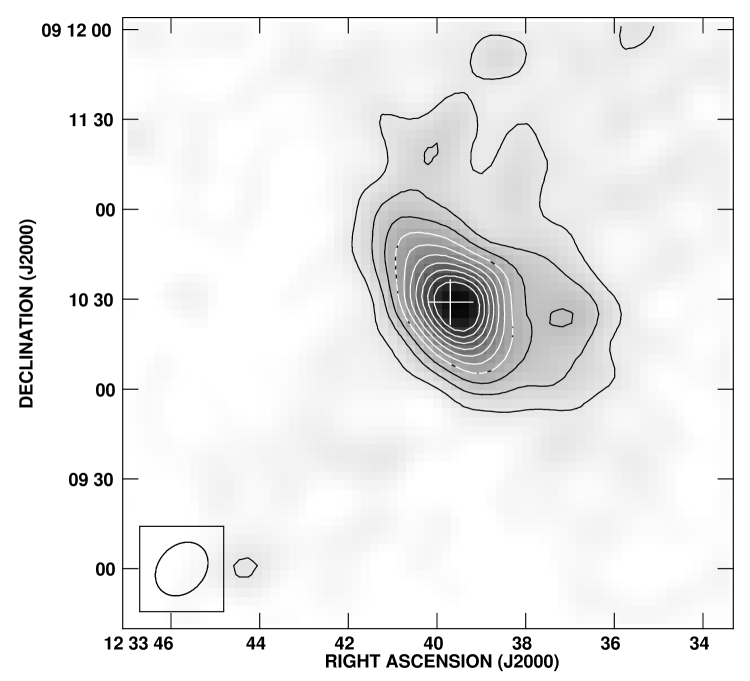
The CS array Hi line continuum data are shown in Fig. 2. The point source in the north of NGC 4522 is now clearly visible. The continuum emission of NGC 4522 is asymmetric, i.e. it is more extended to the west.
However, we do not confirm the extended low surface brightness tail presented in a preliminary image by Kenney & Koopmann (2001) to the west of the galaxy.
3.2 6 cm data
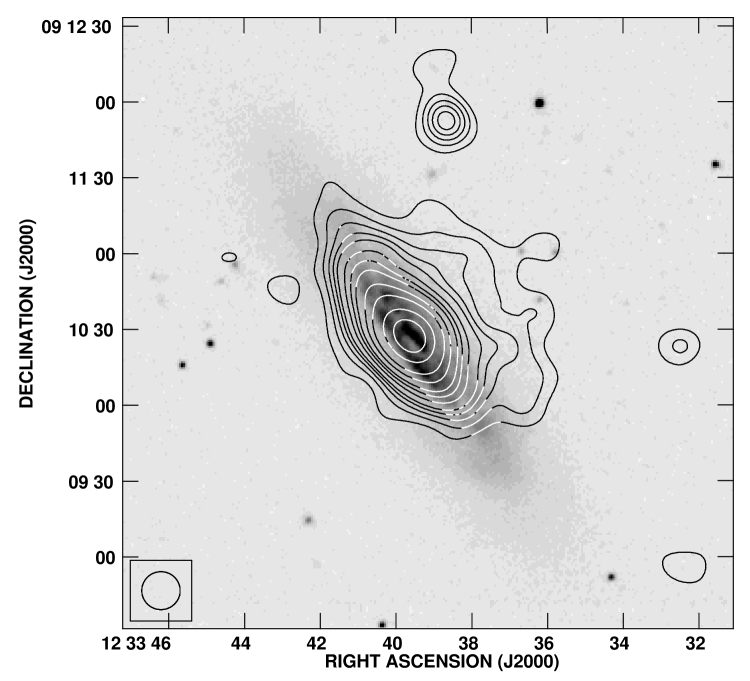
The 6 cm total emission on an optical R band image (Kenney & Koopmann 1999) is shown in Fig. 3. Two point sources, one to the north and the other to the west of the galaxy center, are clearly visible (cf. Sect. 3.1). The emission from the disk is asymmetric, i.e. it is more extended to the north-east. In addition, extended emission in the west of the galactic disk is detected.
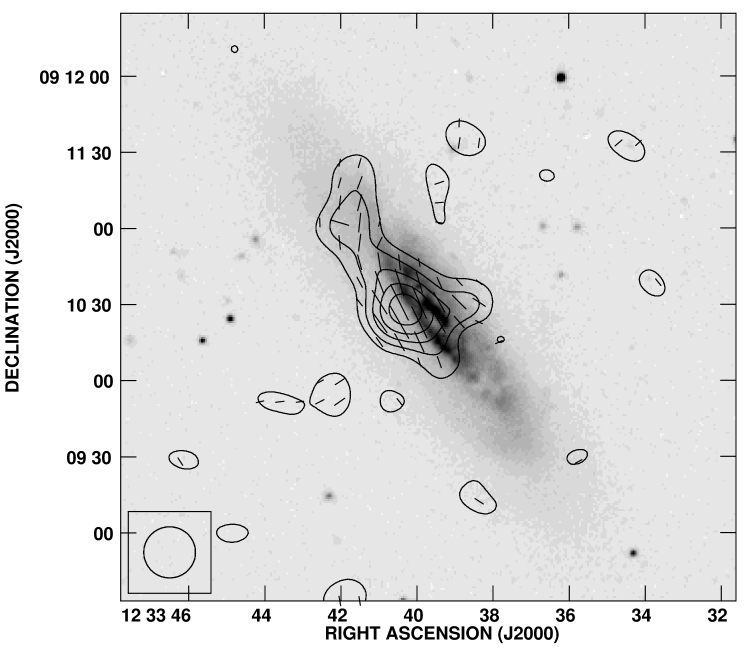
The polarized 6 cm radio continuum emission together with the vectors of the magnetic field uncorrected for Faraday rotation on an R band image (Kenney & Koopmann 1999) is shown in Fig. 4. In the absence of Faraday rotation, the magnetic field vectors are perpendicular to the measured vectors of the electric field. From experience with edge-on galaxies (Dumke et al. 2000) we expect that Faraday rotation at 6 cm is smaller than 20o. The polarized emission is clearly asymmetric. Its maximum is shifted 12′′ (1 kpc) to the east and a few arcseconds to the north with respect to the peak of the total emission. It is elongated along the major axis of the galactic disk and is asymmetric. It extends mainly to the north-east. There is also an elongation along the minor axis that extends 15′′ to the north of the galactic center (the 6 cm total emission peak). The magnetic field uncorrected for Faraday rotation is parallel to the galactic disk near the maximum of the polarized emission and bends northwards to the north.
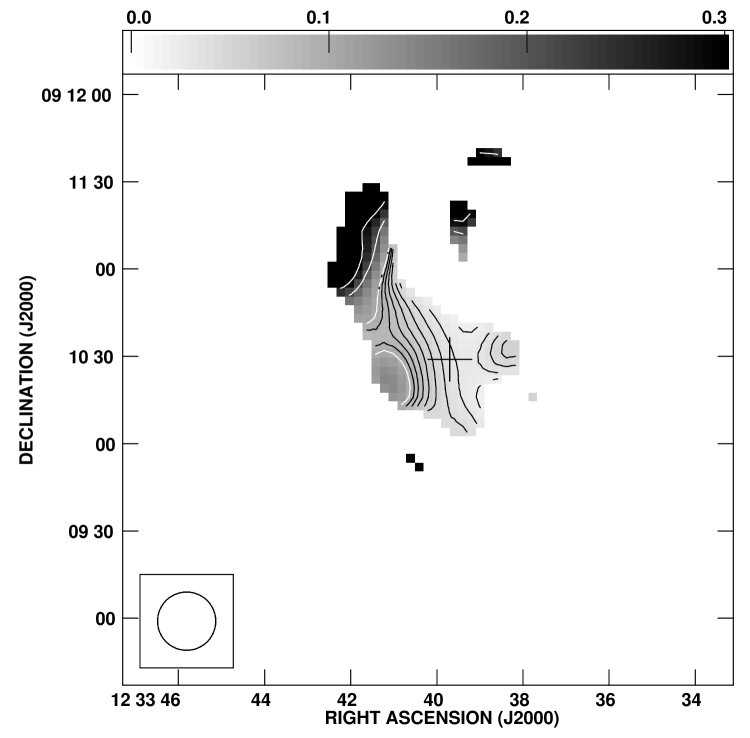
Fig. 5 shows the degree of polarization of the 6 cm data. The 6 cm total emission map has been convolved to a beamsize of 20′′. The total emission has been clipped at 40 Jy, the polarized emission at 20 Jy. We observe a clear gradient in the west-east direction, with a rising degree of polarization to the eastern edge of the galaxy. The degree of polarization along the minor axis decreases from the east (13%) to the west (3%). The maximum of the degree of polarization (35%) is located at the northeastern edge of the galactic disk.
4 Comparison with field galaxies
We find an asymmetric 6 cm polarized emission distribution showing a ridge along the north-eastern edge of the galaxy. Such polarized emission ridges are also observed in two other Virgo spiral galaxies: NGC 4254 (Soida et al. 1996) and NGC 4654 (Chyzy et al., in prep.). Are these asymmetric polarized emission ridges at the edges of the galaxies characteristic for cluster galaxies or can we also observe them in field galaxies?
First, we compare the polarized emission distribution of NGC 4522 to that of highly inclined field galaxies. Polarized radio continuum emission data at 20 cm exist for NGC 4631 (Hummel et al. 1988), NGC 891 (Hummel et al. 1991), NGC 4565 (Sukumar & Allen 1991), and NGC 5907 (Dumke et al. 2000). Whereas NGC 4631, NGC 891, and NGC 4565 show fairly symmetric polarized emission distributions, NGC 5907 has a polarized ridge in the south-west. However, one has to take into account that these data suffer from severe Faraday depolarization, because of the long line of sight through the whole galactic disk. Thus one mainly sees the part of the galaxy which is closer to the observer. This effect already causes an asymmetry along the minor axis. Spiral arms can then cause asymmetries along the major axis. Therefore, it is necessary to observe these galaxies at shorter wavelengths, where Faraday depolarization is small. Sukumar & Allen (1991) observed the nearby edge-on galaxy NGC 891 at 6 cm with the VLA. They found a fairly symmetric double peaked distribution with a more prominent north-eastern peak. The degree of polarization rises up to 32% to the edges of the galaxy. Dumke et al. (2000) observed NGC 5907 at 6 cm in polarization. They found that, despite the asymmetric distribution of the polarized emission at 20 cm, the 6 cm polarized emission distribution is almost symmetric. Thus, we conclude that highly inclined field galaxies can have heavily asymmetric polarized emission distributions at 20 cm, but not at 6 cm.
Second, we compare the polarized emission distribution of NGC 4522 to that of field galaxies with smaller inclination angles (more face-on). A compilation of imaging polarization measurements of 17 nearby galaxies at 6 cm with the VLA, ATCA, and the Effelsberg 100m telescope is available on the website of the Max-Planck-Institut für Radioastronomie Bonn333http://www.mpifr-bonn.mpg.de/staff/wsherwood/mag-fields.html. None of the non-interacting, isolated galaxies (NGC 2276 has a companion, M 101 is a member of a group) show prominent maxima or ridges of 6 cm polarized radio continuum emission at the outer edge of the galactic disk as it is observed for NGC 4254, NGC 4654, and NGC 4522. We conclude that these maxima are characteristic for cluster spiral galaxies.
5 Comparison with other wavelengths
5.1 Total emission
In order to investigate the relationship between the radio continuum emission distribution on the one hand and the distributions of massive star formation and atomic gas on the other hand, we compare our data with the H data of Kenney & Koopmann (1999) (Fig. 6) and the Hi map of Kenney et al. (2003) (Fig. 7). All images have been convolved to the same resolution. The total 6 cm disk emission is very similar to that of the H emission, except that its northern part deviates much less from the major axis than the H emission. Moreover, the radio emission is more extended to the east along the minor axis. The radio data also show extraplanar emission to the west. Whereas both, Hi and H emission, are weak along the minor axis relative to their strength in the south-western extraplanar peak, the radio continuum emission is equally strong at the minor axis and at the location of the south-western extraplanar Hi and H peak.
The total 6 cm emission coincides with the atomic gas distribution in the southern part of the galaxy and in the large western extraplanar peak. In the north the radio emission deviates less from the major axis than the atomic gas distribution. However, the H emission shows the same deviation from the major axis as the Hi gas distribution, which extents much further out. Thus, along the minor axis and in the north of NGC 4522 the 6 cm total continuum emission deviates from both, the H and Hi emission distribution.
5.2 Polarized emission
An overlay of the 6 cm polarized radio continuum emission on the Hi gas distribution is shown in Fig. 8. The polarized emission ridge traces the outer north-eastern edge of the gas distribution.
The strong polarized emission can be due to an enhanced regular magnetic field or an increased density of cosmic ray electrons. Since the total radio emission is not enhanced in this region, the latter possibility can be excluded. In order to investigate the link between the enhancement of the regular magnetic field and the galaxy kinematics, the 6 cm polarized radio continuum emission is plotted on the Hi velocity field in Fig. 9. The velocity field in the region of the maximum of the polarized emission is very regular. The most interesting feature is located to the west of the galactic center. There, the polarized emission lies at the edge of a region of strong kinematic perturbation. This region not only shows bent isovelocity contours, but also an unusually large linewidth of 100 km s-1 (Kenney et al. 2003). Shear velocities in the perturbed regions of the velocity field might be responsible for the western extension of the polarized radio emission.
6 Discussion
Both 6 cm and 20 cm radio continuum maps show a symmetric disk together with a region of extended emission to the west. The 6 cm radio continuum emission distribution follows the Hi gas distribution (Fig. 7) more closely than the distribution of massive star formation (H, Fig. 6). In the south-western extraplanar gas H emission is concentrated in the southern part and its maximum does not coincide with the Hi emission maximum. In the region between the two extraplanar gas maxima only a small amount of H emission is observed, but radio continuum emission is clearly detected. (Fig. 6). This can be for two reasons: (i) extinction affecting the H data or (ii) the radio data traces electrons that diffuse into the the region between the two extraplanar gas maxima. In order to discriminate between the two possibilities we show the spectral index map between 20 cm (Fig. 2) and our 6 cm data in Fig. 10. Both maps were convolved to a resolution of . In the discussed region the spectral index is steeper than -1. This excludes a hidden star formation region which is not visible in the H map, because such a region would show a shallower spectrum due to an increased thermal electron population. The cosmic ray gas that escapes from the galactic disk expand leading to a decreasing cosmic ray particle density away from the disk. Since the synchrotron emission depends on the cosmic ray particle density, the radio emission from magnetized gas is stronger if it is located close to the disk. We thus conclude that the total 6 cm radio emission in the region between the northern and southern extraplanar Hi maxima is due to diffusion of accelerated electrons suggesting that this atomic gas is located close to the galactic disk.
The northern extraplanar atomic gas is not seen in the 6 cm total radio continuum emission. We suggest that this is, because it is located farther away from the galaxy plane than the region between the two extraplanar gas maxima.
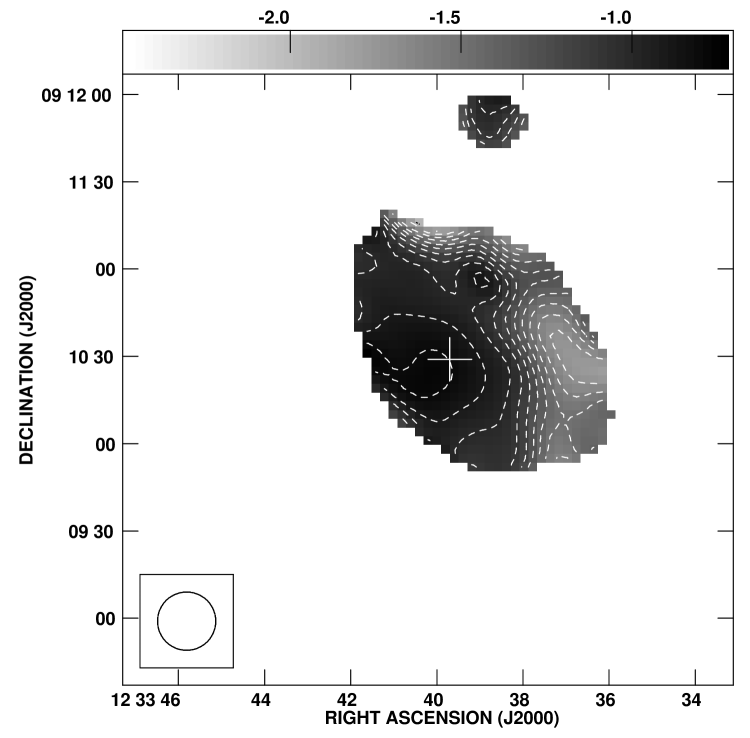
The spectral index map (Fig. 10) clearly shows a steepening of the spectral index to the west from -1 in the disk to values smaller than -2 in the south-western extraplanar gas. This is consistent with diffusion and aging of the electrons producing the synchrotron emission out there. Since the radio spectrum of the galactic disk emission is already relatively steep, the fraction of thermal electrons cannot exceed %. Thus, away from the disk it is unlikely that the steepening of the spectral index is due to a variation of the fraction of thermal emission.
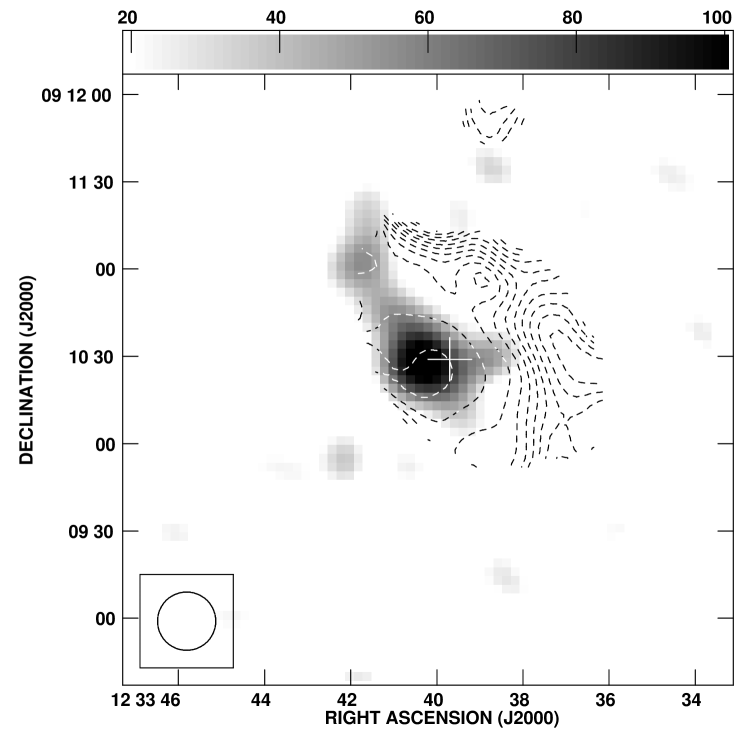
An even more remarkable effect is that the flattest part of the index distribution does not coincide with the H/total radio emission peak, i.e. the galactic center, but with the peak of the polarized radio emission as it can be seen in Fig. 11. To our knowledge such a shift has never been observed before. In general the flattest part of the spectral index distribution coincides with that of the radio emission peak (see, e.g., Duric et al. 1998). A possible interpretation would be that the electrons are accelerated to relativistic velocities in the large scale (kpc) shock that produces the eastern polarized radio emission ridge (Duric 1986). The radio emission of such an electron population has a spectral index of -0.5 (Bell 1978). The observed spectral index of -0.7 would then be due to subsequent energy loss via synchrotron emission.
The enhanced polarization proves that the radio continuum ridge is due to a shock and not to enhanced star formation. Star formation would lead to enhanced turbulent motions that would destroy the ordered magnetic field. In addition, the energy density of the ordered magnetic field is at least an order of magnitude smaller than that of the turbulent magnetic field, because the total power emission is not significantly enhanced in this region.
Polarized radio continuum emission is a powerful tool to detect interactions of spiral galaxies with the cluster ICM. In the case of NGC 4522 the shock may be due to the compression of the ISM due to ram pressure. An alternative scenario where the shock would be caused by stripped gas falling back onto the galactic disk from the north (Otmianowska-Mazur & Vollmer 2003) is no longer viable. The HI gas distribution and kinematics (Kenney et al 2003) and our radio contiuum observations rule out that the gas is currently falling back. If the shock is caused by ongoing ram pressure the galaxy must be moving eastward in the plane of the sky. If one assumes trailing spiral arms, the eastern edge of NGC 4522 is located closer to the observer. The galaxy then rotates counter-clockwise. The blueshift of the northern extraplanar gas maximum (Kenney et al. 2003) and our conclusion (that it is located far away from the galactic plane) are consistent with this picture, because this part of the ISM is accelerated by ram pressure.
6.1 Future work
In order to corroborate our scenario of active ram pressure stripping, VLA observations at 3.6 cm will be needed. With these data, (i) a more reliable spectral index map can be made, (ii) thermal and non-thermal emission can be separated, and (iii) a rotation measure map can be obtained. In the case of active ram pressure stripping one expects a constant or increasing rotation measure along the minor axis from the east to the west, because the stripped gas is pushed to the west. Since the eastern edge of the galaxy is closer to the observer, the stripped, partially ionized gas is located between galaxy’s disk and the observer and thus acts as a Faraday screen. The absence of Faraday rotation would speak against the active stripping scenario.
Polarized radio continuum emission is a powerful tool to detect interactions of spiral galaxies with their cluster environment. A systematic polarization survey of cluster spiral galaxies can give us unique informations about ISM–ICM interactions. When an asymmetric polarized radio emission distribution is detected, the direction of the galaxy’s tangential velocity can be determined and its absolute value estimated. The combination of the Hi and radio continuum data allows us to estimate the galaxy’s 3D distance from the cluster center. Polarized radio continuum data thus give important and complementary information to Hi and H observations.
7 Conclusions
We present VLA D array observations at 6 and 20 cm of the highly inclined Virgo spiral galaxy NGC 4522. The results are
-
1.
the 20 cm and 6 cm total emission distributions are asymmetric; they are more extended to the west, where extraplanar H and Hi emission is found,
-
2.
the 6 cm polarized emission is located at the eastern edge of the galactic disk; its peak is displaced to the east of the total emission peak,
-
3.
the degree of polarization increases from the galaxy center towards the eastern peak and towards the northeastern edge of the disk,
-
4.
the spectral index between 20 and 6 cm decreases from west to east and its maximum coincides with the peak of the 6 cm polarized emission,
-
5.
polarized radio continuum emission is a powerful tool to detect interactions of spiral galaxies with their cluster environment.
Points 3 and 4 are consistent with a picture of a large scale shock due to ram pressure located at the east of the galaxy possibly associated with particle acceleration. We argue that the asymmetry of the 6 cm polarized emission is characteristic for cluster galaxies and is a sign of interaction with its cluster environment. We conclude that it is probable that the galaxy experiences active ram pressure, but it is not clear whether we are observing it before, during, or after peak ICM pressure.
References
- (1) Beck R., Ehle M., Shukurov A., & Sokoloff D. 1999, Nature, 397, 324
- (2) Bell A.R. 1978, MNRAS, 182, 147
- (3) Condon J.J., Cotton W.D., Greisen E.W., et al. 1998, AJ, 115, 1693
- (4) Dumke M., Krause M., & Wielebinski R. 2000, A&A, 355, 512
- (5) Duric N. 1986, A&A, 304, 111
- (6) Duric N., Irwin J., & Bloemen H 1998, A&A, 331, 428
- (7) Hummel E., Lesch H., Wielebinski R., & Schlickeiser R. 1988, A&A, 197, L29
- (8) Kenney J.P.D. & Koopmann R.A. 1999, AJ, 117, 181
- (9) Kenney J.P.D. & Koopmann R.A. 2001, in: Gas & Galaxy Evolution, ASP Conference Series, ed: J.E. Hibbard, M.P. Rupen, and J.H. van Gorkom, Vol. 240, p.577
- (10) Kenney J.P.D., van Gorkom J., & Vollmer B. 2003, ApJ, submitted
- (11) Kotanyi C., van Gorkom J.H., & Ekers R.D. 1983, ApJ, 273, L7
- (12) Otmianowska-Mazur K. & Vollmer B. 2003, A&A, 402, 879
- (13) Soida M., Urbanik M. & Beck R. 1996, A&A, 312, 409
- (14) Sukumar S. & Allen R.J. 1991, ApJ, 382, 100
- (15) Vollmer B., Marcelin M., Amram P., Balkowski C., Cayatte V., & Garrido O. 2001, A&A 364, 532
- (16) Vollmer B., Cayatte V., Balkowski C., & Duschl W.J. 2001, ApJ, 561, 708