The Status of the HESS Project
Abstract
The High Energy Stereoscopic System (HESS) - is a system of four, 107 m2 mirror area, imaging Cherenkov telescopes under construction in the Khomas Highland of Namibia (1800 m asl). The HESS system is characterised by a low threshold ( 100 GeV) and a 1% Crab flux sensitivity resulting from the good angular resolution and background rejection provided by the stereoscopic technique.
The first two telescopes are operational and first results are reported here. The remaining two telescopes (of HESS Phase-I) will be commissioned early in 2004.
1 System Design
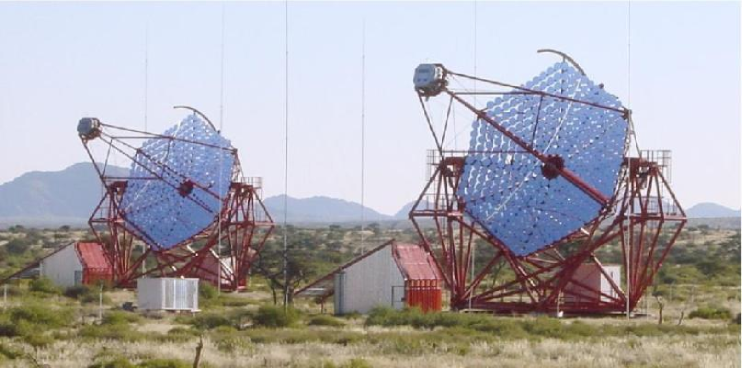
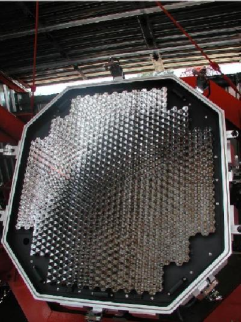
HESS is an array of 4 identical telescopes arranged in a square with 120 m sides. Each telescope has a focal length of 15 m and a 13 m diameter. The reflectors comprise 380 quartz-coated round facets (60 cm diameter), arranged with Davies-Cotton optics.
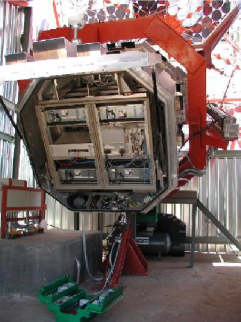
The HESS cameras consist of 960 pixels of angular size providing a total field of view of . A pixel consists of a photomultiplier tube (PMT) with a Winston cone light collector. The PMTs (Photonis XP2960) are organised into drawers of 16 PMTs with associated read-out electronics. All triggering and read-out electronics are contained inside the camera body.
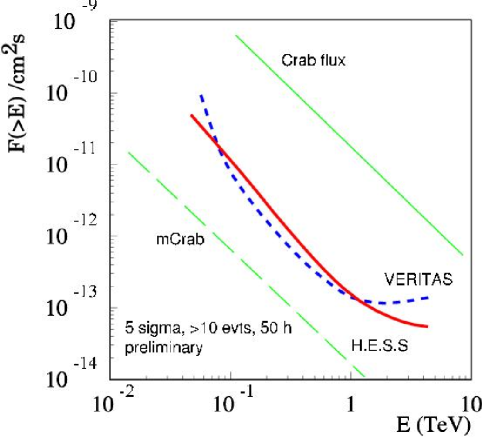
Monte-Carlo simulations predict a sensitivity for the 4 telescope system of around 1% of the Crab flux (5, 50 hours) and an energy threshold of 100 GeV (see Fig. 1).
2 Construction Status
The first telescope of HESS (referred to as CT3 for historical reasons) was completed in June 2002 and immediately began Cherenkov observations. The second telescope completed (CT2) began operations in March 2003. Some improvements were made to the second camera (and upgrades to the first), primarily a reduction in digitisation and readout time (from 1.6 ms to 0.6 ms) (Fig. 2).
As of April 2003, the steel work and drive systems are complete on the two remaining telescopes. The camera shelters, lightening masts, residence and control buildings are all complete. The remaining work is the installation of mirrors on CT1 and CT4 and the installation and commissioning of the cameras on these telescopes. The central trigger system for the array will be installed in June 2003. All mirror facets and PMTs for the 4 telescope system are in hand and the two remaining cameras are mechanically complete and undergoing electronics installation and testing in Paris. Completion of the construction of Phase-I is expected in early 2004.
3 Telescope Performance
The optical support structure and positioning system of the HESS telescopes have been designed for a high level of mechanical rigidity – we therefore expect to achieve good telescope tracking precision which can be followed by small off-line corrections based, for example, on CCD measurements. The telescope drive systems are equipped with encoders for control and monitoring. The RMS deviation from nominal encoder values (over a period of 9 months) was of the order 1 arcsecond. The slewing/positioning speed of the telescopes is /minute.
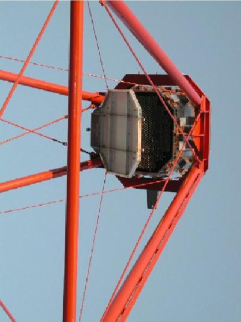
To allow remote alignment, each mirror is equipped with two alignment motors. The alignment procedure uses the image of a star on the closed lid of the PMT camera, viewed by a CCD camera at the centre of the dish. The optical point spread function of the telescope is measured in the same way. These procedures are described in detail in HESS_O2 .
The absolute telescope pointing accuracy has been measured using images of stars on the camera lid. Uncorrected star images deviated from nominal position with an RMS error of 28”. Using a 12-parameter model to correct for misalignments of the telescopes axes etc., a pointing precision of 8” is reached. Finally, using a guide telescope attached to the dish for online corrections, the pointing error can be reduced to to 2.5” RMS. HESSshould therefore be able to locate bright -ray sources to a few arc-seconds.
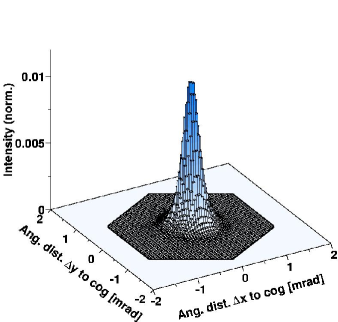
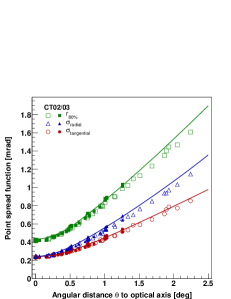
Figure 4 shows the optical point spread function (PSF) for the HESS telescopes. The 80% light containment radius is smaller than half the pixel diameter up to off-axis. Measurements of the PSF over several months show no evidence for degradation since the installation of the camera on CT3, without need for mirror alignment. The design and performance of the optical system of HESS is described in detail in HESS_O1 and HESS_O2 .
4 Optical Crab Pulsar
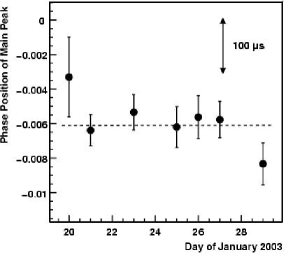
A prerequisite of deep -ray observations of pulsed -ray emission from pulsars is to verify the absolute timing system and phase reconstruction algorithm used. The observation of optical pulsations from the Crab has been used by several groups to provide this verification (see for example WHIPPLE ; CELESTE ).
Optical pulsar observations have been made using a custom-built detector installed on the closed lid of the first Cherenkov camera (CT3). This instrument comprises a single PMT with current sampling every 50 s and analog response time of 150 s. Each sample is accompanied by a timestamp derived from the the GPS clock of the HESS central trigger system.
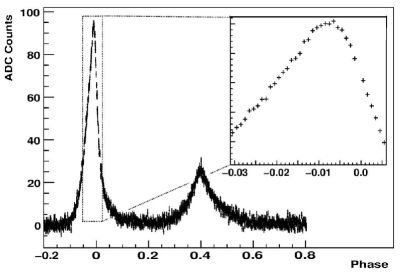
The large mirror area and narrow PSF of the HESS telescopes allows a very high signal/noise measurement of the pulsar light curve to be made. Fig. 5 shows the light curve derived from 3 hours of observations spread over one week in January 2003. Fig. 5b shows the mean optical flux versus phase (relative to the peak of the primary radio pulse).
5 Camera Performance
Since June 2002 the first camera of the HESS system has been taking Cherenkov data – operating at typical trigger rates of Hz (at 30∘ zenith, 4 pixels 5 photoelectrons). The trigger rate of the telescope is seen to vary smoothly with threshold. At thresholds as low as 4 pixels 4 photoelectrons there is no significant contribution of night sky background triggers to the rate. The observed night sky background level (from PMT currents and pedestal widths) is close to 100 MHz in dark regions, as expected.
Measurements of the PMT gain and flat-field coefficients (derived from laser and LED calibration systems) show variations on the 10% level over the nine months of operation. After flat-fielding the performance of the camera is measured using muon-ring images which provide the best measurement of the detector response to Cherenkov light.
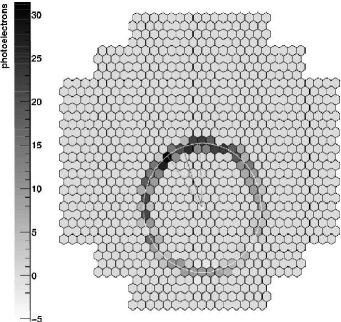
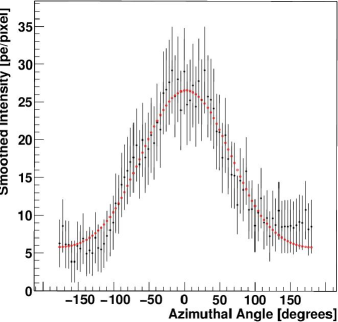
Single muon images provide a powerful tool for absolute calibration of Cherenkov Telescopes. The expected images are readily calculable and easily recognisable in the data (as ring-like images). The overall brightness of the rings (or the normalisation of the intensity profile azimuthally around the ring) provides a measurement of the through-put of the system, including attenuation in the lower 500 m of the atmosphere, mirror reflectivity, Winston cone collection efficiency, and PMT quantum efficiency.
Figure 6 shows a sample muon-ring image and the azimuth distribution of intensity around the ring. The overall system efficiency can be deduced from a single ring with 10% precision; such rings occur in our data at Hz. Averaging over muon rings in many runs the through-put of the first telescope seems to be 10% less than predicted by the simulations - within the systematic errors in the calculation.
Run-to-run fluctuations in the through-put deduced from muon images are at the few percent level.
6 Gamma-Ray Observations
Between July 2002 and March 2003 many target objects have been observed using the first HESS telescope. The list of targets is primarily composed of objects claimed as sources by the Durham DURHAM_INST and CANGAROO CANGAROO groups.
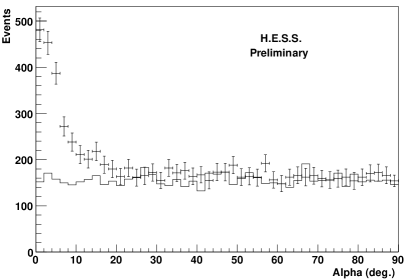
The Crab nebula is a standard candle in the VHE -ray field and was observed during autumn 2003 to test predictions of the performance of a single HESS telescope. Observations were taken over a zenith angle range of 45∘ to 50∘ during October and November 2003. A total live-time of 4.7 hours on-source, and an equal amount of off-source, data were acquired. After applying optimised cuts (box cuts or supercuts) on reconstructed Hillas Parameters, a steady rate of 3.6 ’s/minute is observed with a significance of . Figure 7 shows a pointing angle -plot for these data. Because of the large zenith angle of these observations the post-cut energy threshold is 800 GeV. From Monte Carlo simulations (CORSIKA plus telescope simulation) we calculate a preliminary integral flux of () m-2 s-1 (TeV).
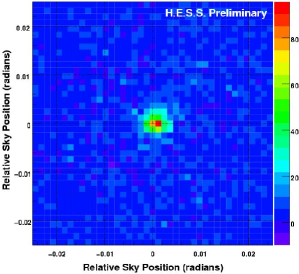
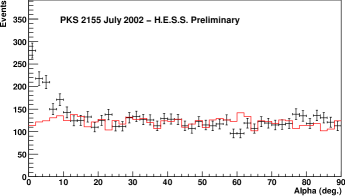
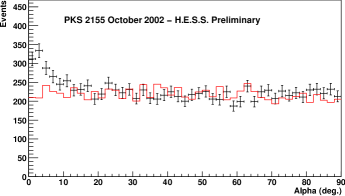
Amongst the targeted extra-galactic objects was the BL-Lac object PKS 2155-304. Our observations in July and October 2002 confirm the identification of this object as a VHE -ray source by the Durham group DURHAM_PKS . Observations in July with 2.2 hours of live-time on-source show an excess of ’s/minute with a significance of 9.9 (see Fig. 8). The measured flux in October was significantly lower (’s/minute, 6.6).
7 First Stereo Observations
In March 2003 the first simultaneous observations with two HESS telescopes were made. In the initial mode of operation the stereoscopic events are matched in software using GPS times. Figure 9 shows the distribution of the image length/size for single telescope and coincident events from these data. The prominent peak in the first plot is due to single muon images which are clearly absent in the stereoscopic data, as expected.

The installation of a hardware central triggering system (expected in June 2003) will allow us to substantially reduce the camera trigger thresholds whilst maintaining acceptable levels of dead-time ().
8 Conclusions
Two of the four telescopes of HESS Phase-I are complete and operational. The optical and mechanical performance of these telescopes meets all specifications. -ray observations of the Crab confirm the simulated performance of a single HESS telescope. We confirm the BL-Lac PKS 2155-304 as a strong VHE -ray source.
The full HESS system should begin operations early in 2004.
References
- (1) Weeks, T. C. et al., Astropart. Phys. 17 (2002) 221.
- (2) Hofmann, W., In: Proceedings of the 27th ICRC, Hamburg (2001) OG 2.05.
- (3) Cornils, R. et al., APh 20 (2003) 129.
- (4) Bernlöhr, K. et al., APh 20 (2003) 111.
- (5) Lessard, R. W. et al., Astrophys.J., 531 (2000) 942.
- (6) de Naurois, M et al., Astrophys.J., 566 (2002) 343.
- (7) Straubmeier, C. et al., Exp. Astron. 11 (2001) 157.
- (8) Armstrong, P. et al., Exp. Astron. 9 (1999) 51.
- (9) Enomoto, R. et al., In: Proceedings of the 28th ICRC, Tsukuba (2003) OG 2.2.
- (10) Chadwick, P. M. et al., Astrophys.J., 513 (1999) 161.