The Spectral Energy Distributions of Narrow-line Seyfert 1 Galaxies
Abstract
Narrow-line Seyfert 1 galaxies are identified by their uniform optical spectral properties. Studies of samples of NLS1s reveal, however, a range of X-ray spectral and variability behavior, and UV spectral behavior. We describe the range of behavior observed, illustrating with a comparison of the XMM-Newton and HST data from the NLS1s 1H 0707495 and Ton S180, and discuss how the spectral energy distribution may causally link the UV and X-ray properties.
1 Introduction
Narrow-line Seyfert 1 galaxies are identified by their optical emission line properties. They have narrow permitted optical lines (FWHM of H), weak forbidden lines ([O III]/H; this distinguishes them from Seyfert 2 galaxies), and frequently they show strong Fe II emission.[1] In 1992, it was demonstrated by Boroson & Green[2] that the optical emission-line properties around H are strongly correlated with one another. A principal components analysis allowed the largest differences among optical emission line properties to be gathered together in a construct commonly known as “Eigenvector 1”. The strongest differences hinge on the strength of the Fe II and [O III] emission, and the width and asymmetry of H. These are just the properties that define NLS1s. During the 1990’s, it was found that the X-ray properties are also manifested in these correlations: NLS1s are observed to have steeper soft X-ray spectra,[3] steeper hard X-ray spectra,[4, 5] and higher amplitude X-ray variability.[6] Properties of UV spectra also appear in Eigenvector 1: NLS1s tend to have higher Si III]/C III] ratios, stronger low-ionization lines, weaker C IV, and stronger N V.[7]
These sets of strong correlations are remarkable, because they involve dynamics and gas properties in emission regions separated by vast distances. This pervasiveness leads us to believe that we are observing the manifestation of a primary physical parameter. A favored explanation is that it is the accretion rate relative to the black hole mass onto the active nucleus. This is easily understood from the X-ray variability properties as follows. NLS1s have systematically higher fractional amplitude of variability at a particular X-ray luminosity than do Seyfert 1 galaxies with broad optical lines in ASCA observations (Fig. 1).[6] Since the ASCA observations are all nearly the same length, a higher fractional amplitude of variability implies a shorter variability time scale. A shorter time scale implies a smaller emission region, which corresponds to a smaller black hole mass, assuming that the geometry, etc., are uniform among Seyfert 1s. Assuming a constant efficiency of conversion of gravitational potential energy to radiation, the X-ray luminosity corresponds to the absolute accretion rate. Thus, for a given luminosity or accretion rate, NLS1s have a smaller black hole mass, and therefore have a higher accretion rate relative to the Eddington value.
The high-accretion-rate scenario is attractive and simple. However, it appears to be incomplete. In the process of analyzing the ASCA X-ray spectra from NLS1s, I found that their properties did not appear to be uniform. Specifically, there is a correlation between their fractional amplitude of variability and a parameter, , that measures the strength of the X-ray soft excess (Fig. 1).[5] Objects with very prominent soft excesses show high-amplitude variability, and objects with moderate soft excesses show lower-amplitude variability. Thus, a connection between the shape of the X-ray spectrum and the variability among NLS1s is observed.

The ASCA data were invaluable for understanding the properties of NLS1s; however, because of the limited signal-to-noise ratio, we could not investigate the nature of the soft excess or the variability in detail. The large effective area of XMM-Newton vastly improves the situation. We can gain some insight into the correlation shown in Fig. 1 by looking at archival XMM-Newton data from two NLS1s, 1H 0707495 and Ton S180, with different locations in the correlation plot.
2 X-ray Properties of 1H 0707495 and Ton S180
1H 0707495 and Ton S180 were observed using XMM-Newton for and ks, respectively. We obtained the data from the archive; both of these data sets have been published.[8, 9]
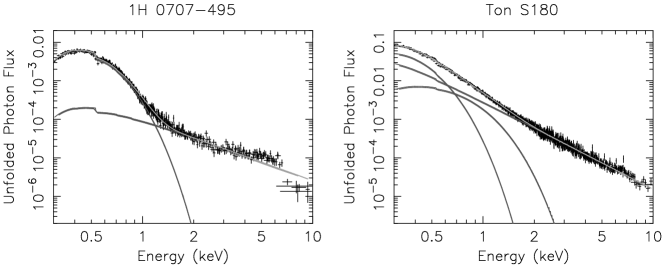
Let’s look first at the spectral properties. The most notable feature is that the character of the soft excess in these two objects is completely different. In 1H 0707495, the soft excess is very prominent and can be modelled very well by a single-temperature black body (Fig. 2). In contrast, the soft excess in Ton S180 is shallower and it requires two blackbodies to model it successfully; the spectrum was modelled successfully using two Comptonized plasmas in Ref. \citenrf:8. These differences suggest that the process responsible for the soft excess is different.
Turning next to the variability, we show in Fig. 3 the full-band light curves. We renormalized by dividing by the average count rate to emphasize the differences. We can clearly see that amplitude of variability is much higher in 1H 0707495 than in Ton S180, as expected from the ASCA behavior.
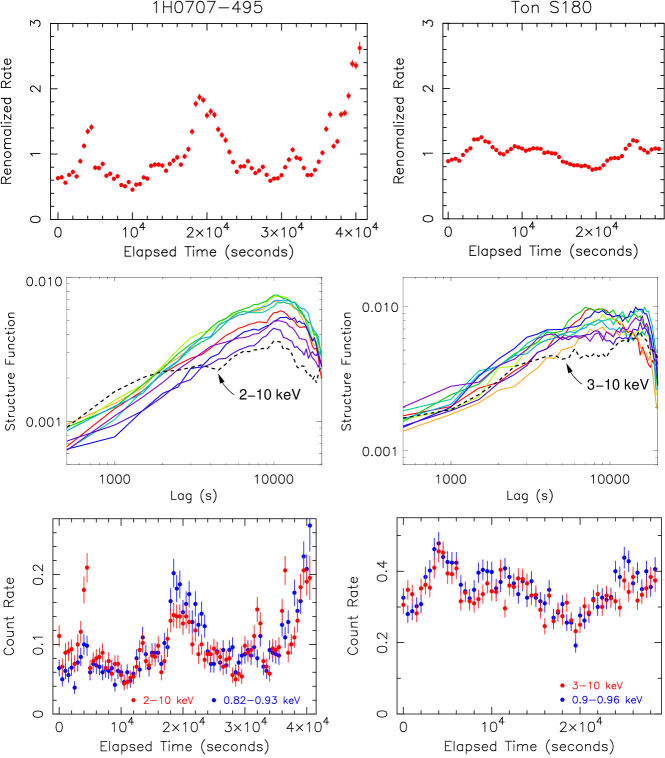
It is often illuminating to examine at the variance as a function of energy. In these two observations, however, the variance is constant, suggesting that there is little spectral variability.[8, 9] The variance is the integral over the power spectrum from to , where and are the length of the observation and the bin size, respectively. Performing the integral averages over all time scales so that information about variability on different time scales is lost.
Computing the variance was about all one could do with the ASCA data, because of the low signal-to-noise ratio. We can do more with the XMM-Newton data. Fig. 3 shows the structure function (SF) of energy-sliced light curves. The behavior of most of the SFs run parallel to one another, indicating no spectral variability. The exception is the highest energy band. In 1H 0707495, the 2–10 keV SF is flatter toward short time scales than the SFs in the other bands, indicating more power on shortest time scales. We can understand this result by examining the energy-sliced light curves, shown in Fig. 3. In Ton S180, the hard and soft light curves are nearly identical. But in 1H 0707495, several high-amplitude, short time-scale flares are seen in the hard band. It is worth noting that in the 2002 Chandra observation of 1H 0707495, similar behavior was observed, except that the hard X-rays were much more variable on all time scales than the soft X-rays.[10]
My interpretation of these results is as follows. In 1H 0707495, there is a soft excess and power law, and the difference in variability implies that they come from two physically distinct, although coupled, emission regions. In Ton S180, although the spectrum is parameterized in terms of a soft excess and a power law, the correlated variability suggests that these components are not distinct; perhaps Comptonization is occurring in gas with clumps having a range of optical depths and temperatures.
3 The UV Properties of NLS1s
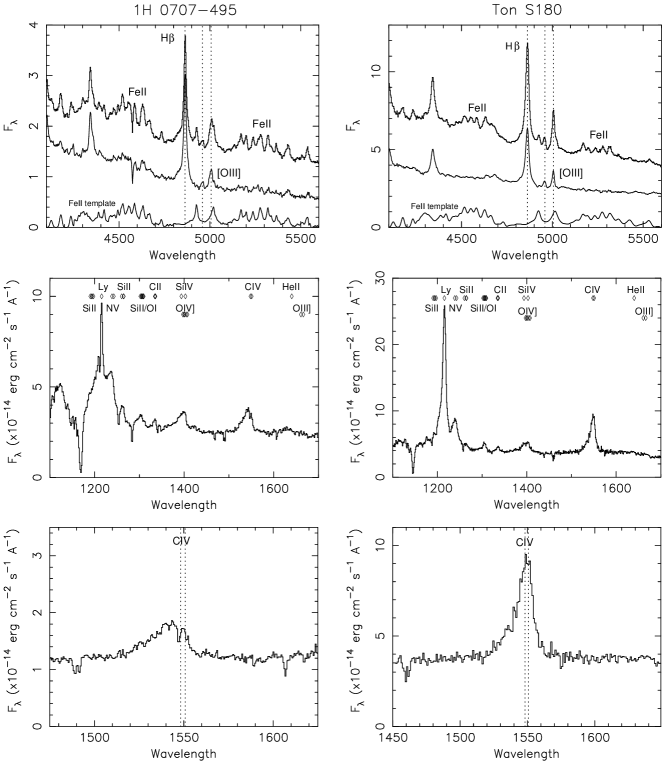
Turning now to the optical spectra, shown in Fig. 4, we see the narrow H, strong Fe II, and weak [O III] characteristic of NLS1s. There is little difference between 1H 0707495 and Ton S180, as expected. The interesting differences appear in the UV spectra. In both cases, the broadband continuum is similar. In the far-UV spectrum we find that 1H 0707495 shows stronger N V, and stronger Si II. The most interesting differences are in the C IV profile. In 1H 0707495, the line is strongly blueshifted, with the largest part of the line blueward of the rest wavelength. In Ton S180, while there is a blueshifted tail, the largest part of the line is roughly centered at the rest wavelength.
Considering a larger sample of 16 NLS1s, we see that the C IV differences are part of a trend (Fig. 5).[11] The C IV equivalent width is strongly anticorrelated with a parameter that describes the asymmetry of the line which is defined as the fraction of the emission blueward of the rest wavelength. We suggest that C IV may be comprised of two components, a blueshifted portion that is emitted in a wind, and a narrow part that is emitted in low-velocity gas perhaps associated with the accretion disk or base of the wind. In some NLS1s, such as 1H 0707495, the C IV line is dominated by wind emission.

What determines the presence of a wind? There are theoretical arguments and observational evidence that suggests that it is the spectral energy distribution. Fig. 5 shows 111 is defined as the point-to-point energy index between 2500Å and 2 keV. as a function of the asymmetry parameter.[11] This shows that objects with blueshifted lines are also X-ray weak. This makes perfect sense, if the acceleration mechanism for the wind is radiative-line driving, because strong UV emission is needed to drive the wind, while the X-rays should be weak in order to prevent the wind from being over-ionized.[12] Fig. 6, showing the spectral energy distributions of 1H 0707495 and Ton S180, reveals that the SED is softer in 1H 0707495.

Let us next look at the intermediate- and low-ionization lines. One of the peculiar properties of the UV spectra of NLS1s is the fact that they contain strong very high ionization lines, such as N V, and very strong low-ionization lines, such as Si II and Fe II. Also, the intermediate-ionization lines emitted tend to be those with lower ionization potentials (i.e., Si III] and Al III rather than C III]).[11] This may have a natural explanation in terms of the wind scenario described above. If the continuum is transmitted through or is “filtered”222We differentiate between a “shielded” continuum, which is assumed to have been transmitted through highly ionized gas,[13] and a “filtered” continuum, which is assumed to have been transmitted through the wind while ionizing and exciting it before illuminating the disk or low-velocity base of the wind and producing the observed intermediate- and low-ionization lines. by the wind before illuminating the relatively dense, low-velocity gas that emits the intermediate- and low-ionization lines, then it will lack photons beyond the helium edge (Fig. 6) and will be unable to produce high-ionization line emission. The intense continuum still excites the gas, causing it to emit strong low-ionization lines, and lower I.P. intermediate-ionization lines. This scenario and supporting photoionization modeling is discussed in much more detail in Ref. \citenrf:14.
We acknowledge that the anticorrelation between and the emission line asymmetry is not very strong. Most of the X-ray and UV observations used to determine were not simultaneous, a fact that would tend to reduce the correlation. However, we find the same results in several objects studied in detail. Coordinated FUSE and ASCA observations of RE 1034+39 revealed flat of ; this object is well known for its very hard spectral energy distribution.[14] A hard spectral energy distribution should yield narrow high-ionization lines centered at the rest wavelength; no wind is present because the strong X-ray emission overionizes the gas. Indeed, we find that all of the emission lines, including the very high-ionization line O VI, can be modeled with nearly the same narrow profile.[16] In contrast, coordinated HST and Chandra observations of the luminous NLS1 PHL 1811 reveal a very soft, intrinsically X-ray weak continuum.[17] A soft spectral energy distribution should produce blueshifted high-ionization emission lines, and indeed, that is what we find.
4 Discussion
In this talk, I presented a discussion of the X-ray spectral and variability properties exhibited by NLS1s, drawing from studies of ASCA spectra,[5, 6] and UV properties, drawing from studies of HST spectra.[11, 14] I showed that although NLS1s are identified by fairly uniform optical spectral properties, they exhibit a range of X-ray and UV spectral behaviors.
I also presented an explicit comparison of X-ray and UV properties of two NLS1s, 1H 0707495 and Ton S180. These two objects show distinctly different X-ray spectral and variability behaviors. This suggests that something about their central engines is different; perhaps there are differences in geometry resulting from different accretion rate. There are also differences in their UV properties; here I discussed the differences in the C IV profile, but note that there are other patterns in the range of behaviors exhibited by NLS1s that are discussed in detail in Ref. \citenrf:11.
The spectral analysis and photoionization modeling presented in Ref. \citenrf:14 indicates that the shape of the spectral energy distribution may be responsible for the range of UV spectral behaviors. Specifically, when the UV continuum is blue and strong, and the X-ray continuum is weak, a resonance-line driven wind is produced that contributes blueshifted high-ionization emission lines. This wind filters the continuum before it illuminates the intermediate- and low-ionization line-emitting region, causing it to emit strong low-ionization lines, and lower I.P. intermediate-ionization lines. In contrast, when the X-rays are strong relative to the UV, the gas that would form the wind is overionized, and the resonance-line driving fails. In that case, the high-ionization lines are narrow and centered at the rest wavelength.
The spectral energy distribution is produced in the central engine. X-ray properties are key for understanding the central engine, because the X-rays are emitted very close to the black hole. I propose that the differences seen in the X-ray properties of 1H 0707495 and Ton S180 are manifested in their spectral energy distributions, and perhaps also the geometry of the central engine, which then influences their UV emission line properties. This suggests a chain of causality linking the X-ray and UV behaviors perhaps arising from a range in some intrinsic parameter among members of the class of NLS1s.
Acknowledgements
KML would like to thank Andrea Crews, Chiho Matsumoto, John Moore, and Darrin Casebeer for contributions to the work presented here.
References
- [1] D. E. Osterbrock & R. W. Pogge, \AJ108,1985,187
- [2] T. A. Boroson & R. F. Green, \JLApJS,80,1992,109
- [3] T. Boller, W. N. Brandt, & H. Fink, \JLA&A,279,1993,53
- [4] W. N. Brandt, S. Mathur, & M. Elvis, \JLMNRAS,285,1997,L25
- [5] K. M. Leighly, \JLApJS,125,1999,317
- [6] K. M. Leighly, \JLApJS,125,1999,297
- [7] B. J. Wills, A. Laor, M. S. Brotherton, D. Wills, B. J. Wilkes, G. J. Ferland, & Z. Shang, \JLApJL,515,1999,53
- [8] S. Vaughan, T. Boller, A. C. Fabian, D. R. Ballantyne, W. N. Brandt, & J. Trümper, \JLMNRAS,337,2002,247
- [9] T. Boller, et al. \JLMNRAS,329,2002,L1
- [10] K. M. Leighly, A. Zdziarski, T. Kawaguchi, & C. Matsumoto, 2002, Proc. “Workshop on X-ray Spectroscopy of AGN with Chandra and XMM–Newton”, eds. Th. Boller, S. Komossa, S. Kahn, H. Kunieda, & L. Gallo (MPE: Garching) p. 259, astro-ph/0205539
- [11] K. M. Leighly & J. R. Moore, submitted to ApJ, astro-ph/0402453
- [12] D. Proga, J. M. Stone, & T. R. Kallman, \AJ543,200,686
- [13] N. Murray, J. Chiang, S. A. Grossman, \AJ451,1995,498
- [14] K. M. Leighly, submitted to ApJ, astro-ph/0402452
- [15] E. M. Puchnarewicz, K. O. Mason, & A. Siemiginowska, \JLMNRAS,293,1998,52P
- [16] D. Casebeer, K. M. Leighly, to be submitted to ApJ
- [17] K. M. Leighly, J. P. Halpern, & E. B. Jenkins, in Proc. AGN Physics with the Sloan Digital Sky Survey, eds. G. T. Richards & P. B. Hall (ASP: San Francisco), astro-ph/0402535