An XMM-Newton observation of Ark 120: the X-ray spectrum of a ‘bare’ Seyfert 1 nucleus
Abstract
We report on a long ( ks) XMM-Newton observation of the bright Seyfert 1 galaxy Arakelian 120. The source previously showed no signs of intrinsic reddening in its infrared–ultraviolet continuum and previous observations had shown no evidence for ionized absorption in either the ultraviolet or X-ray bands. The new XMM-Newton RGS data place tight limits on the presence of an ionized X-ray absorber and confirm that the X-ray spectrum of Ark 120 is essentially unmodified by intervening matter. Thus Ark 120 can be considered a ‘bare’ Seyfert 1 nucleus. This observation therefore offers a clean view of the X-ray spectrum of a ‘normal’ Seyfert galaxy free from absorption effects. The spectrum shows a Doppler broadened iron emission line ( km s-1) and a smooth, continuous soft excess which appears to peak at an energy keV. This adds weight to the claim that genuine soft excesses (i.e. those due to a real steepening of the underlying continuum below keV) are ubiquitous in Seyfert 1 spectra. However, the detailed shape of the excess could not be reproduced by any of the simple models tested (power-laws, blackbodies, Comptonised blackbodies, accretion disc reflection). This observation therefore demonstrates both the need to understand the soft excess (as a significant contributor to the luminosity of most Seyfert 1s) and the inability of the existing, simple models to explain it.
keywords:
galaxies: active – galaxies: nuclei – galaxies: Seyfert – X-rays: galaxies1 Introduction
Arakelian 120 (aka Mrk 1095) is a luminous Seyfert 1 galaxy at a redshift . It was the subject of an early attempt at reverberation mapping, and was important in demonstrating the compact size of the optical broad line region (Peterson et al. 1985; Peterson & Gaskell 1991). More recent optical monitoring campaigns have yielded an estimate of the mass of the central black hole of (Wandel, Peterson & Malkan 1999). The bolometric luminosity for the nucleus is erg s-1 (Edelson & Malkan 1996 estimated the total luminosity to be erg s-1). This would suggest it is radiating at , where is the Eddington luminosity for a black hole. The nucleus is radio-quiet but shows a slight extension in its radio image (Condon et al. 1998; Ho 2002). Ward et al. (1987) used broad-band photometry to identify Ark 120 as a ‘bare’ Seyfert nucleus, i.e. one free from significant reddening or contamination from the host galaxy. The host is a low-inclination spiral galaxy (Hubble type S0/a, inclination ; Nordgren et al. 1995) .
Ark 120 has been observed with most of the major X-ray observatories. An EXOSAT observation showed Ark 120 to have a steep soft X-ray spectrum (Turner & Pounds 1989), as did a subsequent ROSAT observation (Brandt et al. 1993). Furthermore, these X-ray observations showed no indication of any ‘warm absorption’ features – i.e. discrete absorption features often found in the soft X-ray band and caused by absorption in photoionized gas along the line-of-sight to the nucleus. Warm absorption systems are common in Seyfert 1s (Reynolds 1997; Crenshaw, Kraemer & George 2003). Observations in the ultraviolet (Crenshaw et al. 1999; Crenshaw & Kraemer 2001) showed Ark 120 to be one of the Seyfert 1 galaxies that showed no intrinsic ultraviolet absorption. Thus Ark 120 is a rare example of a bright Seyfert 1 galaxy that is not significantly affected by any kind of complex absorption – its emission spectrum is that of a ‘bare’ Seyfert 1 nucleus.
The paper presents the results of a long XMM-Newton observation designed to characterise the intrinsic X-ray emission spectrum of a Seyfert 1 galaxy. The rest of this paper is organised as follows. Section 2 discusses the observation details and data reduction. Section 3 gives details of the X-ray variability observed in Ark 120 and section 4 describes a ‘first look’ at the X-ray spectrum. The spectrum is then examined in detail using the Reflection Grating Spectrometer (RGS) in section 5. This is followed by an analysis of the European Photon Imaging Camera (EPIC) data first over the keV band (section 6) and then the over the full band-pass (section 7). Section 8 briefly discusses an analysis of archival RXTE observations of Ark 120. Finally, the results are discussed in section 9.
2 Observation and data reduction
XMM-Newton (Jansen et al. 2001) observed Ark 120 during the period 2003 August 24 05:35:43 – 2003 August 25 12:44:33. XMM-Newton carries three co-aligned X-ray telescopes each with an EPIC CCD array as its focal-plane detector. There are two types of EPICs used: two MOS cameras (Turner et al. 2001a) and one pn camera (Strüder et al. 2001). The two telescopes that focus onto the MOS cameras also focus onto RGS instruments (den Herder et al. 2001). During the Ark 120 observation all the EPIC cameras were operated in small window mode using the thin filter. The short frame-time possible in small window mode meant photon pile-up (which can distort the spectrum of bright sources; Ballet 1999) was negligible.
The extraction of science products from the Observation Data Files (ODFs) followed standard procedures using the XMM-Newton Science Analysis System (SAS v5.4.1). The EPIC and RGS data were processed using the standard SAS processing chains to produce calibrated event lists. These removed events from the position of known defective pixels, corrected for Charge Transfer Inefficiency (CTI) and applied a gain calibration to produce a photon energy for each event. Source data were extracted from circular regions of radius ′′from the processed images and background events were extracted from regions in the small window least effected by source photons. These showed the background to be relatively low and stable throughout the observation. The total amount of ‘good’ exposure time selected was ks from the pn, ks from the MOS and ks from the RGS. (The lower pn exposure is due to the lower ‘live time’ of the pn camera in small-window mode, per cent; Strüder et al. 2001). The total number of source photons extracted was for the pn, for each MOS, and and counts for the RGS1 and RGS2, respectively.
The spectral analysis was performed using XSPEC v11.2 (Arnaud 1996) and, in order to allow effective use of the method of minimization for spectral fitting, the EPIC spectra were grouped such that each energy bin contains at least counts. The RGS data were grouped to contain at least counts per bin. The quoted errors on the derived model parameters correspond to a per cent confidence level for one interesting parameter (i.e. a criterion), unless otherwise stated, and fit parameters are quoted for the rest frame of the source. Values of km s-1 Mpc-1 and are assumed throughout the paper.
3 Timing analysis
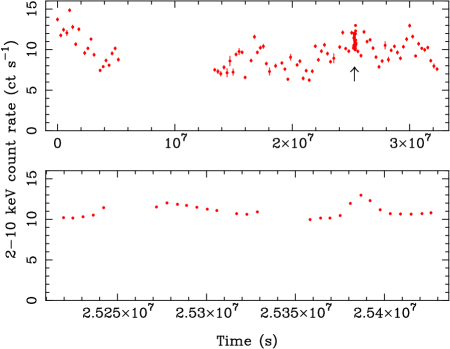
Fig 1 shows the broad band X-ray light curve obtained using the pn camera. This light curve has been background subtracted and corrected for exposure losses. The source shows only very mild variations in flux. Fitting the light curve with a constant gave an unacceptable fit ( for degrees of freedom), rejecting the constant hypothesis with very high significance ( per cent) and demonstrating the observed variations are intrinsic to the source. The measured amplitude of variations, estimated using the statistic (see Vaughan et al. 2003), was only per cent.
The data were divided into four energy bands (, , and keV) in order to investigate the spectral dependence of the variations. The individual light curves show similar trends. The ratios of these light curves in the four bands were used to test of spectral variability. A constant was fitted to each of the ratios and the resulting value recorded. Spectral variability was clearly detected, with a constant hypothesis being rejected at per cent confidence in five of the six ratios, and rejected at per cent confidence for the ratio (). The time series of this ratio is shown in Fig. 1. The variability amplitude was measured in each of the four bands and used to define the rms spectrum (Fig. 2). There was an obvious enhancement of variability amplitude at higher energies.


4 A first look at the X-ray spectrum
The X-ray spectrum in true flux units was estimated using the procedure discussed in Vaughan & Fabian (2004). The counts to flux conversion was carried out using an XMM-Newton observation of 3C 273 as a ‘standard star.’ 3C 273 is a bright source and has a relatively simple spectrum in the EPIC band (a hard power-law plus smooth soft excess modified by Galactic absorption; Page et al. 2004a), and in particular does not contain any strong, sharp spectral features. The ratio of the spectra of Ark 120 and 3C 273 was calculated and then normalised by a spectral model for 3C 273 (see Vaughan & Fabian 2004 and also Page et al. 2004a). Fig 3 shows the resulting spectrum and clearly reveals the strongest spectral features in Ark 120, namely the smooth, featureless continuum and the iron line peaking at .
This spectrum was corrected for Galactic absorption. The low Galactic latitude of Ark 120 () means foreground Galactic absorption is high. The column density towards Ark 120 has been estimated from cm surveys of the surrounding sky to be cm-2 (using the data of Stark et al. 1992) or cm-2 (using the data of Dickey & Lockman 1990). Either of these values can be consistent with the estimate based on fits to the ROSAT soft X-ray spectrum (Brandt et al. 1993), although which one depends on the assumed form of the underlying spectrum. In the analysis below the Galactic absorption was assumed to be given by the smaller of these two column density estimates (unless stated otherwise) and was modelled using the TBabs code of Wilms, Allen & McCray (2001). The relatively large correction for Ark 120 introduced spurious features into the fluxed spectrum at low energies. This is because the source spectrum was convolved through the detector response but the absorption model used for the correction was not. This lead to a spurious ‘inverted edge’ feature appearing near the Galactic O i edge. Furthermore, the 3C 273 observation used the medium filter while the Ark 120 observation used the thin filter, this will systematically distort the fluxed spectrum of Ark 120 at the lower energies. Due to these issues the fluxed spectrum is shown only above keV.
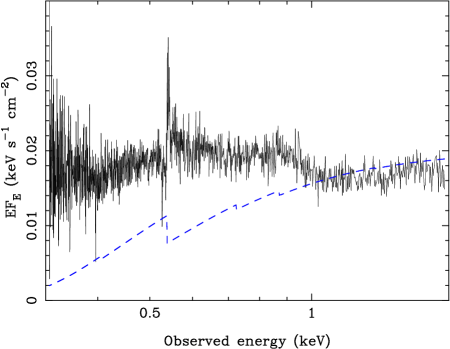
Figure 4 shows the X-ray spectrum compared to the overall SED obtained from non-simultaneous observations. The multi-wavelength fluxes (VLA, NRAO, IRAS, optical) were obtained from the NASA/IPAC Extragalactic Database (NED). The ultraviolet HST spectrum was taken with the Faint Object Spectrograph (FOS) on-board HST and was previously published by Crenshaw et al. (1999). These data were obtained through the Multi-Mission Archive at Space Telescope (MAST) and de-reddened assuming . The SED was produced using data obtained over a number of years by a number of observers and so should not be taken to represent the single-epoch SED of Ark 120. Nevertheless this SED does provide a strong indication of the general shape of the broad-band SED of Ark 120, which must peak in the far-ultraviolet region. Interestingly, the soft X-ray excess (see section 7) does not appear steep enough to be the high energy tail of the blue-ultraviolet bump.

5 RGS spectral analysis
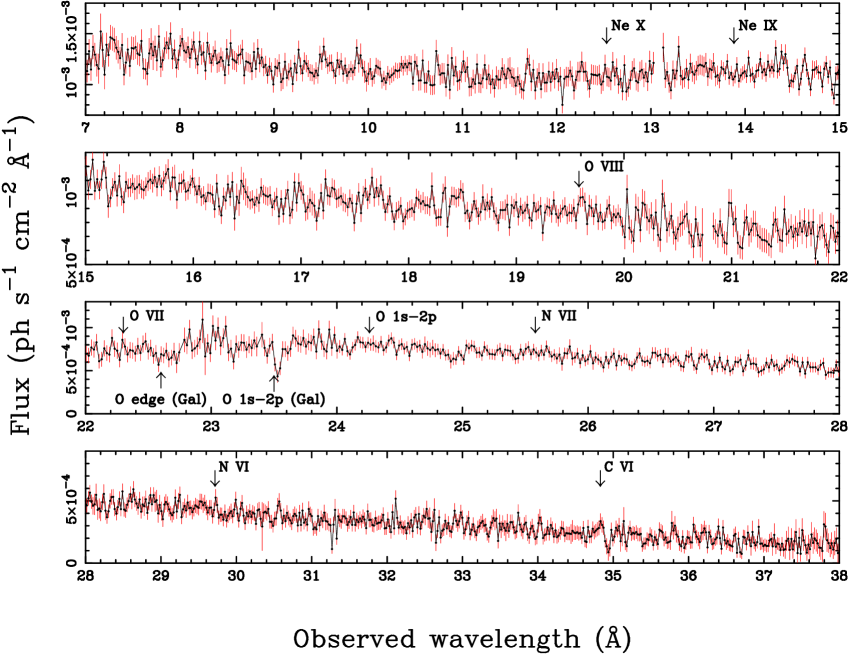
The combined RGS1+RGS2 spectrum is shown in true flux units (as a function of energy) in Fig 5. This was corrected for Galactic absorption using the TBabs model (which accounts only for photoelectric absorption) and assuming cm-2. Due to small inaccuracies in both the RGS response and the interstellar absorption model (see de Vries et al. 2003) this resulted in a spurious ‘spike’ in the corrected data at keV. Fig 6 shows a closer examination of the fluxed RGS spectrum as a function of wavelength. In this case no correction was made for the Galactic absorption and the only obvious features were those due to absorption by interstellar O. Excepting this, the intrinsic soft X-ray spectrum appears, to first order at least, as a smooth continuum with no obvious, strong, discrete features.
5.0.1 Intrinsic warm absorption
In order to test for traces of ionized (warm) absorption local to Ark 120 the RGS data were searched for resonance absorption lines of C, N, O and Ne. In particular, the (source frame) wavelengths corresponding to the resonance transitions in He- and H-like ions of N, O and Ne as well as H-like C were examined. The relevant atomic data (wavelengths and oscillator strengths) were obtained from Verner, Verner & Ferland (1996). The expected (source frame) wavelengths of these transitions are shown in Fig. 6.
In order to measure the parameters of each line a region of the spectrum Å either side of the expected transition was fitted with a power-law modified by Galactic absorption. A narrow ( eV) absorption line was then added to the data at the wavelength expected for the transition (after correcting for the redshift). In the case of all seven possible transitions no significant improvement in the fit was found upon adding an absorption line to the model. Upper limits were obtained on the equivalent widths of these lines as shown in Table 1. These limits were derived after allowing for moderate red/blue shifts (up to km s-1) in the lines. Changing the wavelength range fitted did not substantially alter these results.
These equivalent width limits place constraints on the possible columns of ionized absorbing material as follows. Any weak absorption lines are likely to be unsaturated and thus on the linear part of the curve-of-growth. For a given transition the measured equivalent width thus corresponds to an ionic column density given by the following (Spitzer 1978):
| (1) |
where is the equivalent width and is the wavelength (in cm) of the line, is the ionic column density and is the oscillator strength. The derived limits on the ionic column densities are given in Table 1.
5.0.2 Interstellar absorption
As mentioned above, the column density of Galactic interstellar gas is uncertain but estimated to lie in the range cm-2. The RGS spectrum clearly shows discrete structure due to absorption by local interstellar O i (see Fig. 6; note that the region of the spectrum around O i is sampled only by RGS1). The depth of the O i absorption line can provide an independent estimate of the column density. The line is a simpler diagnostic than the O i K-edge which is broader and complicated by instrumental absorption (see de Vries et al. 2003). The equivalent width of the line ( m Å) corresponds to an absorbing column density (see Fig 3 of de Vries 2003). The main source of uncertainty in the column density estimate is the turbulent velocity width of the line; the line is deep enough that it does not lie on the linear part of the curve-of-growth. This column of neutral O corresponds to an equivalent hydrogen column density of cm-2 (assuming an O/H abundance of as given by Wilms et al. 2000). The column density estimate is therefore consistent with the cm measurements but does not improve upon them.
The neutral absorption intrinsic to the host galaxy of Ark 120 was estimated by measuring the O i line in the redshifted frame of the galaxy. The limit on its equivalent width is given in Table 1. This corresponds to column densities of cm-2 and cm-2. The interstellar absorption intrinsic to Ark 120 is therefore negligible compared to the foreground absorption.
| line | ( Å) | (m Å) | |
|---|---|---|---|
| C vi | |||
| N vi | |||
| N vii | |||
| O vii | |||
| O viii | |||
| Ne ix | |||
| Ne x | |||
| O ia | |||
| O ib |
6 EPIC keV spectral analysis
The fluxed spectrum (section 4) demonstrated that the X-ray emission from Ark 120 appears as a reasonably smooth continuum and the RGS showed no evidence for warm absorption (section 5). This section describe an analysis of the EPIC spectrum, starting with an examination of the iron line.
6.1 Iron K emission line
The keV spectrum was fitted, after excluding the keV region which may contain Fe K features, with a simple model comprising a power-law modified only by Galactic absorption. The pn and MOS spectra gave differing spectral slopes. The photon index of the power-law fitted to the pn data was steeper than that fitted to the MOS data. The two MOS spectra were in good agreement with each other. Similar discrepancies have been seen in other observations (Molendi & Sembay 2003; Vaughan & Fabian 2004). Hence, in the following spectral analysis, the power-law slope was always allowed to differ between the pn and the MOS (but with the slope for the two MOS spectra tied together).
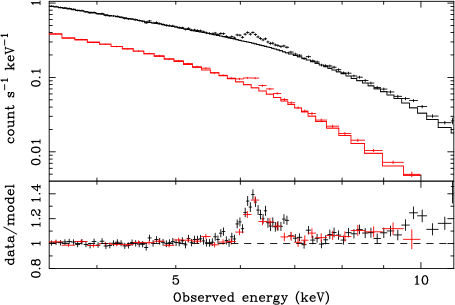
The fluxed spectrum clearly showed Fe emission (Fig 3), if this is produced by fluorescence in an optically thick medium then there may also be an associated Compton reflection continuum (Lightman & White 1988; George & Fabian 1991), which would show as a flattening of the spectrum at higher energies. Thus the spectral slope was estimated using only the keV region – this is free from absorption effects and contains no significant contribution from either the line or reflected flux. The slope was measured to be (from the pn). Fig 7 shows the residuals from this fit after the model was extrapolated to high energies. The excess residuals due to Fe emission are obvious. There also appears to be a slight up turn in the continuum at energies above the line which could be due to reflection (see sections 6.2 and 8).
The line could in principle be composed of lines at energies of keV which could have profiles ranging from unresolved ( eV) to very broad and asymmetric. A set of trial models were compared to the data to test the most plausible possibilities for the line structure. The continuum was assumed to be a simple power-law between keV (modified by Galactic absorption). The line was then fitted with a variety of alternative models including unresolved, narrow lines (modelled using narrow Gaussians of width eV), broad Gaussians and relativistically broadened line profiles (the diskline model of Fabian et al. 1989).
| E | EW | |||||||
| Model | (keV) | (eV) | (eV) | () | () | (deg) | ||
| (1) | (2) | (3) | (4) | (5) | (6) | (7) | (8) | |
| narrow | ||||||||
| narrow+ | ||||||||
| narrow | ||||||||
| narrow+ | ||||||||
| narrow+ | ||||||||
| narrow | ||||||||
| broad | ||||||||
| broad+ | ||||||||
| narrow | ||||||||
| diskline | ||||||||
| diskline+ | ||||||||
| narrow |
The best-fitting parameters and fit statistics are listed in Table 2. The seven different models tested were as follows: () one, () two and () three narrow Gaussians; () one broad Gaussian; () one broad and one narrow Gaussian; () a diskline; () a diskline and one narrow Gaussian. The data were not consistent with a model for the iron line comprising just one or two unresolved emission lines. That said, the data did not strongly favour any one of the more complex models, models all provided reasonable fits to the data (rejection probability ). However, the two models that include both a broad and a narrow line (models and ) gave superior fits.
The best description for the iron line in Ark 120 is thus in terms of a narrow line (with equivalent width eV) and a stronger, broader line (with equivalent width eV). The broad line was described well in terms of either a Gaussian or a diskline profile. In the case of the broad Gaussian, the line width ( eV) corresponds to a velocity width of km s-1. This is far broader than the broad, permitted optical lines ( km s-1; Wandel et al. 1999) and so places the X-ray line emitting region within the optical Broad Line Region (BLR). Assuming the line originates from a Keplerian disk about a black hole the width measured from the broad Gaussian fit places the line emitting material within a few hundred of the black hole (depending on the inclination).
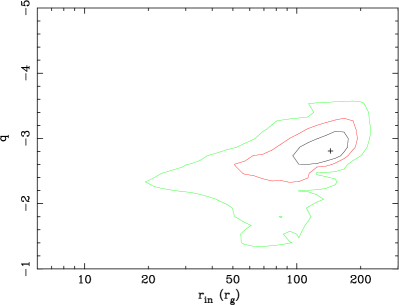
In the case of the diskline model the line profile was broad but reasonably symmetric – the large inner disk edge and high inclination angle mean Doppler shifts will dominate over gravitational redshift. The inner disc radius was constrained to lie beyond , the innermost stable circular orbit (ISCO) expected for an accretion disc about a non-spinning (Schwarzschild) black hole. Fixing the inner radius to (in model ) gave a significantly worse fit even with all the other line profile parameters left free (). That said, the -space is complicated and smaller inner radii can be permitted provided the emissivity index ( where emissivity is ) is flatter and inclination angle is lower, as illustrated by Fig. 8. Nevertheless always lies outside the per cent confidence region of the best-fitting model (model ).
The best-fitting energy of the line is rather unusual, at keV in both Gaussian and diskline models. A line energy of keV, corresponding to neutral iron, gives a substantially worse fit to the data ( compared to model 7, Table 2). This best-fitting energy corresponds to the line emission being dominated by mildly ionized iron (Fe xx-xxii) meaning that resonant trapping and the Auger effect (see e.g. Ross, Fabian & Brandt 1996) should destroy the line.
6.1.1 Additional iron line complexity
The high inner radius of the diskline model can be alleviated if the intrinsically narrow line component is replaced by a second diskline. Fixing and for the pair of lines (with energies and emissivity indices free to vary independently) gave a good fit (), comparable to the best fits given in table 2. The line energies and emissivity indices were as follows: keV, and keV, . The best-fitting inclination angle was . Thus it remains plausible that as long as there are two components to the Fe K line from the disc, each with flat emissivity laws.
The only noticeable residuals that remained after the narrow and broad lines had been fitted (with either model or ), appeared as a slight excess at keV and a slightly deficit at keV. The former of these could plausibly be accounted for by emission at keV by the Ly line of H-like Fe, or keV emission the by the K line of neutral Fe, or some combination of the two. Adding an additional narrow Gaussian to model 5 (Table 2) improved the fit by with best fitting energy keV and an equivalent width eV. The intrinsic width was poorly constrained when left free ( eV). The ratio of flux in the main Fe lines to the flux in the keV line was for the broad line and for the narrow line. The expected ratio of K/K flux is for neutral iron. Thus the weak line at keV could be accounted for as the K line accompanying the broader of the two K lines. However, some contribution from Fe Ly and/or a narrow, neutral K line cannot be ruled out.
The negative residual at keV again seemed marginally significant. Including a narrow Gaussian absorption line improved the fit by a further with best fitting energy keV and an equivalent width eV. The identification of this feature is less obvious. As it is only a tentative detection, rather weak (in equivalent width terms) and has no clear identification, a detailed analysis of this possible feature is not given in this paper.
6.2 Reflection spectrum
As noted above the X-ray continuum appears to be slightly curved compared to a power-law. This curvature is in the same sense as expected if there is a Compton reflection continuum component present in the data. Furthermore, an archival RXTE spectrum covering the keV range (see section 8) supports the presence of a reflection continuum. A simple hypothesis would be that the spectral curvature in the keV EPIC spectrum is caused by a reflection continuum which originates in the same material as that responsible for the iron line. Assuming a neutral slab with solar abundances (George & Fabian 1991; Matt, Fabian & Reynolds 1997) the equivalent width of the broad line ( eV) corresponds to a reflection strength of (where represents the ratio of the normalizations of the observed and reflected power-law continua) depending on the viewing inclination.
As a first test of this, a reflection continuum was included in the model using the pexrav code (Magdziarz & Zdziarski 1995). This component, which accounts for only the continuum produced by Compton reflection and photoelectric absorption (not any associated fluorescent/recombination emission) was added to the basic model of a power-law continuum plus two Gaussian iron lines (model of Table 2). The quality of the fit was only very slightly improved () and the relative reflection strength was constrained to lie in the range . This calculation was performed assuming the reflector was inclined at with respect to the line of sight but almost identical constraints were obtained assuming an inclination angle of . Thus the XMM-Newton/EPIC data are consistent with the presence of a moderate strength Compton reflection component (), which would match the strength of the iron line, but are not sufficient to give a significant detection (but see section 8). The line parameters do not change substantially upon the inclusion of a reflection component to the model.
In order to test for the possible presence of a strongly gravitationally redshifted emission line this reflection plus double Gaussian model was refitted including an addition Laor emission profile (Laor 1991). The inner and outer radii of the disc were fixed at and to simulate only the very innermost region of a disc extending close to the black hole. Assuming a neutral line and an emissivity power-law index of , the upper limit on the equivalent width of this feature was eV for inclination angles of respectively. At high inclinations, the line emission from this region of the disc is smeared over such a large energy range that, even in this relatively high quality spectrum, it was difficult to constrain. It is clear however that unless the disc inclination angle is high there can be no strong, gravitationally redshifted component to the line.
The possibility of reflection was examined further using the reflection code of Ross & Fabian (1993) to model the line emission and Compton reflection continuum self-consistently. The computed reflection spectrum was convolved with a diskline kernel to account for possible Doppler and gravitational broadening. The ionization of the reflector was kept fixed at its minimum allowed value () and an additional narrow, neutral ( keV) iron line was included using a ( eV) Gaussian profile. This model therefore accounts for both the strength and profile of the broad iron line as well as the strength of the Compton reflection continuum. The best-fitting model provided an acceptable fit to the data () with parameters as follows: , , and . These results are consistent with both the diskline model discussed above (section 6.1) and the RXTE fitting described in section 8, and show the broad iron line and weak reflection continuum are consistent with a common origin.
7 The broad-band EPIC spectrum

The broad-band X-ray spectrum shown in Fig 3 is that of a smooth, curving continuum, closely resembling that seen in the X-ray spectra of some other Seyfert 1 galaxies including Ton S180 (Vaughan et al. 2002), PKS 0558-504 (O’Brien et al. 2001a) and Mrk 478 (Marshall et al. 2003). In order to gain a better view of the shape of the broad-band spectrum, Fig 9 shows the data/model residuals when the simple model described in section 6.1 was extrapolated to lower energies (compare with Fig 3). Clearly there is a strong, smooth soft excess which dominates at energies below keV. A similar pattern of residuals is seen in all three EPIC spectra. This differs from the soft excesses seen previously in e.g. Ton S180 and Mrk 478 in that the excess appears to roll-over at energies below keV (at least when compared to the underlying hard X-ray model). This represents a ‘characteristic energy’ of the soft excess; the spectrum of the excess changes from steeper than above keV to a flatter spectrum at lower energies (see also Fig. 5). A similar roll-over in the soft excess has previously been seen in a few Seyfert 1 galaxies (e.g. Mrk 359, O’Brien et al. 2001b; NGC 4051, Collinge et al. 2001). This cannot be accounted for in terms of excess neutral absorption, the curvature predicted by absorption does not match the observed spectral form. The remainder of this section describes the results of fitting variety of continuum models to the data in an attempt to account for the soft excess spectrum (see Vaughan et al. 2002 for more discussion of these soft excess models).
For the purposes of this analysis the following assumptions were made. The Galactic absorption was modelled using TBabs with the column density allowed to vary in the range cm-2 and there was assumed to be no absorption intrinsic to Ark 120. The models tested all accounted for the hard X-ray continuum using a power-law (see section 6.1). In addition a reflection spectrum was included (using the pexrav code unless stated otherwise) as was a two-component iron line (modelled using the double Gaussian model discussed in section 6.1). The relative strength of the reflection () as well as the normalizations of the two iron lines were accepted as free parameters (but with the energies of the lines held fixed). This model acted as the ‘baseline’ model to which various continuum components were added in an attempt to model the soft excess. The differences in the spectral slopes between the pn and the MOS (see section 6.1) can cause problems when attempting to simultaneously fit broad-band continuum models to both datasets. Therefore only the analysis performed on the pn data is explicitly described, but at each stage a ‘sanity check’ was performed by fitting to the MOS data independently.
The trial soft excess models were as follows: () an additional, soft power-law, () a break in the hard power-law, () two breaks in the power-law, () a blackbody, () two blackbodies, () three blackbodies, () a bremsstrahlung thermal spectrum, () a thermal Comptonization spectrum (using the CompTT code of Titarchuk 1994), () a disc blackbody spectrum (using the diskpn code of Gierliński et al. 1999), () thermal plasma (using the mekal code of Kaastra 1992 and Liedahl, Osterheld & Goldstein 1995); () ionized disc reflection and () ionized reflector plus bremsstrahlung () two separate ionized reflectors. For models the pexrav reflection model and broad Gaussian were replaced with the ionized reflection model of Ross & Fabian (1993) including convolution by a relativistic kernel (using the Laor code; Laor 1991) to model emission from an ionized accretion disc. Table 3 summarises the results of fitting these different models to the broad-band EPIC pn spectrum. In no case was the fit acceptable111For this reason the intervals are not very meaningful as confidence intervals and so are not quoted. ( per cent).
| Model | ||
|---|---|---|
| 1 | plpexravpl | |
| 2 | bknpopexrav | |
| 3 | 2bknpopexrav | |
| 4 | plpexrav1bb | |
| 5 | plpexrav2bb | |
| 6 | plpexrav3bb | |
| 7 | plpexravbremss | |
| 8 | plpexravCompTT | |
| 9 | plpexravdiskpn | |
| 10 | plpexravmekal | |
| 11 | plrf93 | |
| 12 | pl2rf93 | |
| 13 | plrf93bremss | |
| 14 | plrf93pl |
7.1 Power-law continua
The two-slope power-law models (double power-law) and (singly broken power-law) were unable to account for the roll-over in the soft excess and produced very large data/model residuals in the soft X-ray band. The power-law models were able to fit down down to keV, the point at which the spectrum starts to roll-over, but below this energy the source spectrum flattens substantially. This is the case even after allowing for additional absorption; including extra absorption in the model did not alter the fit and could not account for the roll-over in the soft X-ray spectrum. Thus the observed roll-over in the soft excess must be intrinsic to the source and not an effect of line-of-sight absorption. However, the addition of a much flatter power-law slope at the lowest energies greatly improved the fit (model ). In this model the hard continuum has a slope of down to keV where is steepened to , accounting for the upturn in the spectrum. Below keV the spectrum becomes very hard, with , corresponding to the low energy roll-over in the soft excess.
7.2 Thermal continua
The models based around thermal continuum emission (multiple blackbodies, Comptonised blackbody, disc blackbody or bremsstrahlung) provided comparably good fits and managed to account for some degree of the roll-over. Unsurprisingly, given the lack of emission lines in the RGS spectrum, the mekal model gave a very poor fit using solar abundances. When allowed to be free the best-fitting abundance was zero, which essentially reproduced a thermal bremsstrahlung continuum. Model , shown in Fig 10, provided the best fit of the thermal models, using three blackbodies to model the soft excess (with temperatures of eV). The broad-band ( keV) unabsorbed luminosity (predicted by this three-blackbody model) was erg s-1.
7.3 Ionized reflection features
The spectrum was also fitted with ionized reflection models including relativistic smearing. For all the reflection-based models the disc emission was very centrally concentrated (e.g. for model and for model ). In fact, the best-fitting emissivity index was often unreasonably steep () and so the fits were performed with kept as a fixed parameter. Furthermore, the steep emissivity meant the fitting was insensitive to the parameter, this was therefore kept fixed at .
It was not possible to model the entire soft excess in terms of emission from an ionized accretion disc (models and ). A single ionized reflector (model ) was unable to fit the soft and hard bands simultaneously. The spectrum above keV was well fitted with only weak ionization (section 6.2), in which case the reflector does not produce enough soft X-ray emission to account for any of the soft excess. Allowing for an additional, independent ionized reflector (with much higher ionization; ) still gave a poor fit to the data (model ). The primary reason for this failure is that the highly ionized reflector, while producing a strong soft excess, also produced very strong, broad spectral features in the Fe K-band. Thus the bulk of the soft excess cannot be explained in terms of ionized reflection (see also discussion in Vaughan et al. 2002).
Ogle et al. (2004) recently proposed that weak structures in the soft excess of the bright Seyfert 1 galaxy NGC 4051 can be explained by O viii recombination emission (both the lines and radiative recombination continuum, RRC) from a relativistic accretion disc. Models and work on a similar principle to the model of Ogle et al. (2004), in that the bulk of the soft excess is accounted for using a continuum component (thermal bremsstrahlung or power-law) and the relatively weak residual structures are fitted using emission from an ionized, relativistic accretion disc). These models gave quite competitive fits to the data, superior to the ionized reflection models without an additional soft X-ray continuum component. In each case the disc was only mildly ionized () and so the fits were performed with the ionization parameter kept fixed at . At this low level of ionization the reflector contributed modest equivalent width, broad emission features to the soft X-ray spectrum (mainly from recombination to O6+ and O7+). For example, the equivalent widths of the emissions lines predicted by model were eV and eV for O vii He and O viii Ly, respectively.
These models did provide reasonable fits to the data (compared to the other models) and so it is at least plausible that some spectral structure in the soft excess of Ark 120 could be accounted for by ionized disc emission. Model accounts for the majority of the soft excess using a keV bremsstrahlung continuum whilst model used a power-law. Notably the bremsstrahlung continuum provided a better fit to the soft X-ray spectrum than the power-law (see Table 3). However, a problem with both these models is that the width of the observed Fe K line in over-predicted (see section 6.1) by the strong gravitational redshift on the reflection spectrum (implied by the small inner radius).
It should be noted that the Ross & Fabian (1993) code was chosen to model the soft X-ray emission expected from an ionized disc, instead of fitting the O viii emission independently as was performed by Ogle et al. (2004). The model used by Ogle et al. (2004) neglected a number of effects that must be important in a realistic disc. Firstly it did not account for emission lines from other species (e.g. O vii) nor from other ions (e.g. C, N, Fe) which should also contribute to the soft X-ray spectrum (e.g. Ballantyne, Ross & Fabian 2002). Secondly it did not include the associated Compton reflection continuum. Thirdly, the O viii Lyman series line ratios were calculated in the optically thin limit, whereas a realistic accretion disc is expected to be optically thick to the lines. This means that, before they can escape the disc, photons from higher-order Lyman series lines (e.g. Ly etc.) will be degraded into lower energy photons from other series and Ly photons. Thus the higher-order Lyman lines should be strongly suppressed, compared to the optically thin case, and the emission dominated by the Ly line. Therefore, a realistic accretion disc spectrum would be expected to produce negligible emission in the higher order Lyman lines. These effects are all included in the Ross & Fabian (1993) model. (See also Dumont et al. 2003 for more details of line transfer effects in ionized discs.)

7.4 Residual problems
Even the best of the models discussed above gave a statistically unacceptable fit to the data. The most prominent fit residuals were confined to three regions: keV, keV and keV. The first set of residuals were almost certainly due to instrumental Si and Au features (see e.g. Vaughan & Fabian 2004). The keV residuals could plausibly due due to low level, broad emission structures (see above), but they coincide with the instrumental and Galactic oxygen edges (at keV). The RGS data showed that there were no strong, narrow emission/absorption lines at keV ( Å). The MOS spectral residuals showed noticeably less structure than the pn residuals in this region. Thus, given the present calibration uncertainties, it is not yet possible to unambiguously assess the shape and significance of these residuals. Apart from these two specifics, the remaining residuals were smaller than per cent and so the best of the above models could be considered reasonable fits to the data (even though the over-all values were poor). The slight down-turn in the residuals below keV (e.g. Fig. 10) may indicate that even for the best-fitting models the spectral curvature was not enough to explain the spectral roll-over.
8 RXTE data
Ark 120 has been monitored by RXTE for several years. Fig 11 shows a section of the RXTE light curve spanning approximately one year which clearly reveals the source is variable but over timescales longer than sampled by XMM-Newton. Marshall et al. (2004) discuss the RXTE monitoring in more detail.
Over the period 1998 Dec 15–18 RXTE observed Ark 120 rather more intensively, resulting in ks of useful data from 3 PCUs. These data were reduced using standard methods (see e.g. Markowitz, Edelson & Vaughan 2003) and a time averaged keV spectrum was extracted. The spectrum clearly reveals the iron line and also suggests the presence of a reflected continuum.
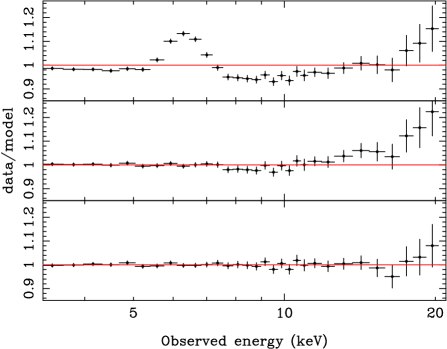
Three simple models were compared to the data as detailed in Table 4. These were () a power-law, () a power-law plus Gaussian and () a power-law plus Gaussian and reflection continuum. The reflection continuum was modelled using the pexrav code. Galactic absorption was included in all three models. The iron line was modelled using a single broad Gaussian, which was adequate given the low spectral resolution of the RXTE PCA. Fig 12 shows the residuals from each model. The simple power-law provided an unacceptable fit. The fit became acceptable once a Gaussian was added, but was significantly improved by the addition of a reflection continuum. Although these RXTE data were taken almost five years prior to the XMM-Newton observation, the RXTE spectrum lends weight to the XMM-Newton results by confirming the presence of an iron line and supporting the existence of a weak () reflection continuum.
| Model | Parameter | |
|---|---|---|
| power-law | ||
| power-law + | ||
| Gaussian | keV | |
| eV | ||
| eV | ||
| power-law + | ||
| Gaussian + | keV | |
| eV | ||
| eV | ||
| reflection |
Very similar results were obtained from an analysis of the time average spectrum of the long timescale monitoring (excluding the 1998 Dec 15-18 intensive monitoring data).
9 Discussion
9.1 The X-ray properties of Ark 120
This paper describes the results of a long XMM-Newton observation of the luminous Seyfert 1 galaxy Arakelian 120. The X-ray emission from the source was only weakly variable on the short timescales probed by XMM-Newton (section 3) but archival RXTE data revealed ‘normal’ Seyfert 1 variability traits on longer timescales (section 8; cf. Edelson & Nandra 1999; Uttley et al. 2002; Markowitz et al. 2003b). The X-ray spectrum showed a notable absence of warm absorption features (section 5). The lack of absorption means that these data represent the ‘bare’ X-ray emission spectrum of a fairly typical Seyfert 1.
The spectrum above keV can be explained using a fairly conventional spectral model (sections 6.1 and 6.2) comprising a power-law continuum () plus Doppler broadened emission from the surface of a weakly ionized reflector (with relative reflection strength ). The RXTE data support this model (section 8). The spectrum below keV becomes dominated by a steep, smooth, broad soft excess component which appears to peak at keV.
9.2 The iron line of Ark 120
The results of the spectral fitting indicated an iron emission line that is the composite of a weak, narrow line originating in distant material and a stronger line showing significant Doppler broadening.
A narrow, neutral iron line appears to be ubiquitous in Seyfert 1 galaxies (e.g. Yaqoob, George & Turner 2002; Page et al. 2004b; Yaqoob & Padmanabhan 2004) and may have an original in the optical broad-line region or the putative molecular torus (see discussion in Yaqoob et al. 2001; Reeves et al. 2004). The lack of neutral absorption intrinsic to Ark 120 (section 5) confined this material to lie out of the line of sight, which in turn implies the covering fraction of the line emitting material must be below unity. The relative strength of the narrow line ( eV) further suggests the sky covering fraction of the material is small (; Nandra & George 1994) or the optical depth is small (; Leahy & Creighton 1993) or both.
The broad component to the line has a velocity width km s-1, far broader than the broad optical lines (e.g. km s-1; Wandel et al. 1999). However, there is no requirement for the line emitting region to extend into the region of strong gravity about the black hole ( ) which would produce an asymmetric redward tail on the line profile (section 6.1). The best-fitting parameters of the disc line model are slightly unusual; the inclination angle is high (), the inner radius is rather large () and the rest-frame energy is unusual ( keV). One plausible origin for this line is a weakly ionized accretion disc. The fact that the inner radius is greater than could mean the disc is truncated. However, the unusual energy of the line (corresponding to mildly ionized iron) might allow for a simpler alternative. If the disc survives down to the ISCO but rapidly becomes ionized with decreasing radius then, depending on the detailed ionization structure, the innermost regions may produce little observable line emission (see e.g. Ross, Fabian & Young 1999).
However, as demonstrated by Fig. 8 there is sufficient leverage in the fit to allow for a smaller inner radius (), and also lower inclination angle, provided the emissivity law is quite flat (). As mentioned in section 6.1 a good fit can be obtained with and provided that there are two co-existing Fe K emission lines arising in the disc (at energies of and keV) and no intrinsically narrow component. This may be feasible if the disc is clumpy or inhomogeneous (Ballantyne, Turner & Blaes 2004). The required flat emissivity can be produced if the disc is illuminated from a great height. Figure 13 shows the effect of altering in a ‘lamppost’ geometry [i.e. the disc was assumed to be flat and illuminated by a central point source raised by a height , in which case the emissivity law is given by ]. This demonstrates that if the X-illumination is provided from a height the emissivity will be quite flat out to similarly large radii. Illumination from a large height would require a non-standard geometry for the X-ray emitting region, one possibility is the ‘aborted jet’ model of Ghisellini, Harrdt & Matt (2004).
9.3 Ark 120 as a ‘bare’ Seyfert 1
These new X-ray observations showed Ark 120 to posses no evidence of an X-ray warm absorber and placed upper limits on the ionic column densities that are substantially lower than those of more typical, absorbed Seyfert 1s. For example, NGC 3783 shows O vii and O viii absorption with column densities two orders of magnitude higher (Kaspi et al. 2002). Kaastra et al. (2000) observed NGC 5548 and measured C vi, N vi, O vii and O viii absorption lines with corresponding ionic column densities an order of magnitude higher than the limits obtained for Ark 120. A last counter example is IRAS 13349+2438 (Sako et al. 2001) which shows absorption lines of C vi, N vi, O vii, O viii, Ne ix and Ne x, with column densities an order of magnitude higher than Ark 120.
These X-ray observations therefore confirm that Ark 120 is indeed a ‘bare’ Seyfert 1 nucleus, as suspected based on its broad band spectral energy distribution (SED; Edelson & Malkan 1986; Ward et al. 1987) and the lack of ultraviolet absorption seen in HST/FOS spectrum (Crenshaw et al. 1999). Other ultraviolet observations have been made with the Goddard High-Resolution Spectrograph (Penton, Stocke & Shull 2000) and with FUSE (Wakker et al. 2003). Using these data Wakker et al. (2003) showed that the line-of-sight through the Galaxy towards Ark 120 possesses a very low column of O vi. A preliminary examination of these data suggest there may be weak traces of ionized absorption intrinsic to Ark 120.

9.4 Other bare Seyferts
Shortly after the original discovery of the X-ray warm absorber (Halpern 1984), this phenomenon was found to be common in Seyfert 1 galaxies. Low resolution spectra from EXOSAT and Ginga suggested per cent of Seyfert 1s showed evidence for warm absorption (Turner & Pounds 1989; Nandra & Pounds 1994). Subsequent observations with the better spectral resolution afforded by ASCA suggested the incidence of warm absorbers was possibly higher ( per cent; Reynolds 1997; George et al. 1998). Similar results were found for the ultraviolet absorber based on HST FOS spectra (Crenshaw et al. 1999).
The increased sensitivity and resolution offered by XMM-Newton and Chandra have allowed for even more sensitive searches for absorption. These have confirmed that there remains a significant population of Seyfert 1s that lack a strong X-ray warm absorber. In addition to Ark 120, other Seyfert 1s that show a distinct lack of warm absorption in both their HST FOS ultraviolet and XMM-Newton/Chandra X-ray spectra include Mrk 478 (Marshall et al. 2003a), Mrk 335 (Gondoin et al. 2002), Fairall 9 (Gondoin et al. 2001) and Mrk 205 (Reeves et al. 2001). All four of these were in the sample of Crenshaw et al. (1999) and classified as having no intrinsic ultraviolet warm absorber. Other objects known to lack X-ray absorbers include PKS 0558–504 (O’Brien et al. 2001a), MCG–2-58-22 (Weaver et al. 1995) and Ton S180222 There is some debate about Ton S180. Różańska et al. (2004) re-examined the Chandra LETGS observation and claim to have found several resonance absorption lines. The lines are very weak and in most cases of borderline significance (many have equivalent widths consistent with zero). Furthermore, the spectral analysis was complicated by the presence of contaminant on the Chandra ACIS which affects the LETGS/ACIS calibration (see Marshall et al. 2003b). Thus the existence of an X-ray warm absorber in Ton S180 is still not well established and in any case must be extremely weak. (Turner et al. 2001b; Vaughan et al. 2002).
These objects are probably not completely without ionized absorption systems. Kriss (2002) reported weak absorption by the O vi Å resonance doublet in both Ton S180 and Mrk 478 based on high resolution FUSE data (see also Turner et al. 2002 for the FUSE observation of Ton S180). Such absorption is too weak to have been detected in the Crenshaw et al. (1999) ultraviolet survey. The corresponding X-ray warm absorbers in these objects may be present but so weak as to have a negligible effect on the available data.
The reason for the lack of an X-ray warm absorber is unclear. The most obvious explanation is that overall column density is lower in these objects (by at least an order of magnitude) compared to more typical, absorbed Seyferts. However, it is also plausible that a similar column of ionized gas exists but is either too highly ionized to show significant spectral features or lies out of the line of sight (requiring a covering fraction less than unity). A detailed survey comparing the X-ray and ultraviolet emission/absorption line spectra of a large sample of bright Seyferts may be able to answer this question (see discussions in Crenshaw et al. 2003). A more speculative solution, recently proposed by Gierliński & Done (2004), is that objects that lack narrow absorption lines may be dominated by a deep, broad absorption trough produced by an absorption system with such high dispersion velocity that no individual lines can be resolved. This model would require the underlying power-law continuum to be rather steep, which then makes explaining the upturn above keV more difficult to explain.
9.5 How common are soft X-ray excesses?
These observations have clearly revealed a luminous soft excess in Ark 120, in the sense that an extrapolation of the hard ( keV) continuum into the soft X-ray band revealed a very significant upturn. Steep soft X-ray spectra were first seen in Seyferts using HEAO-1 A2 data (Pravdo et al. 1981) and subsequently seen as excesses over the hard power-law by EXOSAT (Arnaud et al. 1985) and Einstein (Bechtold et al. 1987). Early soft X-ray surveys (e.g. the EXOSAT survey of Turner & Pounds 1989) suggested that per cent of all Seyferts possessed a soft excess component. The ROSAT survey of Walter & Fink (1993) also suggested a high incidence of soft excesses. These numbers were highly uncertain, however, because many of the sample members were absorbed. Complex soft X-ray absorption can mask, or in some cases even mimic, the steeper soft X-ray spectrum indicative of a soft excess.
The recent XMM-Newton and Chandra observations would seem to indicate that all Seyfert 1s without strong X-ray warm absorption do show a strong soft excess. However, many of the well-known examples (e.g. Ton S180, PKS 0558-504, Mrk 478, NGC 4051 and Mrk 359) are narrow-line Seyfert 1s (NLS1s; Osterbrock & Pogge 1985). NLS1s are a subclass of Seyfert 1s defined by their narrow permitted optical lines ( km s-1) but noted for their often exceptionally steep soft X-ray spectra (Boller et al. 1996; Laor et al. 1997; Vaughan et al. 1999; Leighly 1999). Until recently it was possible that the soft excess appeared ubiquitous in unabsorbed Seyferts only because many of the well-studied examples were NLS1s (i.e. the sample of unabsorbed Seyferts was biased towards the soft NLS1s).
Ark 120 is an interesting counter example, being both unabsorbed and a ‘normal,’ broad-line Seyfert 1 (BLS1) with km s-1 (Wandel et al. 1999). Yet it too shows a strong soft excess. Other notable BLS1s that also lack absorption include Mrk 205 (Reeves et al. 2001), Mrk 335 (Gondoin et al. 2002) and Fairall 9 (Gondoin et al. 2001), all of which showed soft excesses in their XMM-Newton observations. Although a complete and unbiased survey of the soft X-ray spectra of Seyfert 1s has yet to be conducted, it does seem highly plausible that all unabsorbed Seyfert 1s (whether NLS1 or BLS1) possess a soft excess. Assuming that there is no fundamental difference in the underlying X-ray continuum spectra of absorbed and unabsorbed Seyfert 1s then implies that soft X-ray excesses are ubiquitous to Seyfert 1s. The mini-survey of XMM-Newton spectra by Pounds & Reeves (2002) showed that in all six Seyfert 1s they studied, the soft X-ray spectrum ( keV) was always per cent higher than an extrapolation of the hard X-ray power-law would predict. Furthermore, detailed studies of Seyfert 1s with complex, strong X-ray warm absorbers often conclude that an additional soft X-ray emission component is required behind the warm absorber (e.g. Collinge et al. 2001; Netzer et al. 2003; Blustin et al. 2003).
This therefore underlines the need to understand the soft excess as a common (perhaps ubiquitous) and significant contributor to the luminosity of Seyferts. In the case of Ark 120 the best-fitting models are a doubly-broken power-law with an anomalously flat slope below keV, or multiple, soft blackbodies. The blackbody origin is difficult to explain as the temperatures are far too high to correspond to any standard accretion disc. The expected temperature for the inner region () of a geometrically thin, optically thick disc about a black hole is eV if radiating at and eV if radiating at . This emission should therefore not contribute to the observed X-ray spectrum. The temperatures of the best-fitting blackbody components were at at least an order of magnitude higher than this. In addition, the size of the emission region implied by these high temperatures is far too small (). The alternative models tested (reflection, disc blackbodies and bremsstrahlung) all produced the wrong spectral shape. At present there is no single model that can account for the known properties of the soft excess (see also the discussion in Vaughan et al. 2002).
Acknowledgements
Based on observations obtained with XMM-Newton, an ESA science mission with instruments and contributions directly funded by ESA Member States and the USA (NASA). We would like to thank the SOC and SSC teams for making possible the observations and data analysis, and an anonymous referee for a helpful report. SV acknowledges financial support from PPARC. This research has made use of the NASA/IPAC Extragalactic Database (NED) which is operated by the Jet Propulsion Laboratory, California Institute of Technology, under contract with the National Aeronautics and Space Administration. This research also made use of observations made with the NASA/ESA Hubble Space Telescope, obtained through the data archive at the Space Telescope Science Institute. STScI is operated by the Association of Universities for Research in Astronomy, Inc. under NASA contract NAS 5-26555.
References
- [1] Arnaud K., et al. , 1985, MNRAS, 217, 105
- [2] Arnaud K., 1996, in Jacoby G., Barnes J., eds, Astronomical Data Analysis Software and Systems, ASP Conf. Ser. Vol. 101, p17
- [3] Ballantyne D. R., Ross R. R., Fabian A. C., 2002, MNRAS, 336, 867
- [4] Ballantyne D. R., Turner N. J., Blaes O. M., 2004, ApJ, in press (astro-ph/0311390)
- [5] Ballet J., 1999, A&AS, 135, 371
- [6] Bechtold J., Czerny B., Elvis M., Fabbiano G., Green R. F., 1987, ApJ, 314, 699
- [7] Bianchi S., Matt G., Balestra I., Perola G. C., 2003, A&A. 407, L21
- [8] Blustin A. J., et al. , 2003, A&A, 403, 481
- [9] Branduardi-Raymont G., Sako M., Kahn S. M., Brinkman A. C., Kaastra J. S., Page M. J., 2001, A&A, 365, L140
- [10] Brandt W. N., Fabian A. C., Nandra K., Tsuruta S., 1993, MNRAS, 265, 996
- [11] Boller Th., Brandt W. N., Fink H,. 1996, A&A, 305, 53
- [12] Collinge M. J.,et al. , 2001, ApJ, 557, 2
- [13] Crenshaw D. M., Kraemer S. B., Boggess A., Maran S. P., Mushotzky R. F., Wu C.-C., 1999, ApJ, 516, 750
- [14] Crenshaw D. M., Kraemer S. B., 2001, ApJ, 562, L29
- [15] Crenshaw D. M., Kraemer S. B., George I. M., 2003, ARA&A, 41, 117
- [16] Condon J. J., Yin Q. F., Thuan T. X., Boller Th., 1998, AJ, 116, 2682
- [17] den Herder J. W., et al. 2001, A&A, 365, L7
- [18] de Vries C. P., den Herder J. W., Kaastra J. S., Paerels F. B., den Boggende A. J., Rasmussen A. P., 2003, A&A, 404, 959
- [19] Dickey J. M., Lockman F. J., 1990, ARA&A, 28, 215
- [20] Dumont A-M., Collin S., Paletou F., Coupé S., Godet O., Pelat D., 2003, A&A, 407, 13
- [21] Edelson R. A., Malkan M. A., 1986, ApJ, 308, 59
- [22] Edelson R., Nandra K., 1999, ApJ, 514, 682
- [23] Fabian A. C., Rees M. J., Stella L., White N. E., 1989, MNRAS, 238, 729
- [24] George I. M., Fabian A., 1991, MNRAS, 249, 352
- [25] George I. M., Turner T. J., Netzer H., Nandra K., Mushotzky R. F., Yaqoob T., 1998, ApJ, 114, 73
- [26] Ghisellini G., Haardt F., Matt G., 2004, A&A, 413, 535
- [27] Gierliński, M., Zdziarski, A. A., Poutanen, J., Coppi, P. S., Ebisawa, K., Johnson, W. N. 1999, MNRAS, 309, 496
- [28] Gierliński, M., Done C., 2004, MNRAS, submitted (astro-ph/0312271)
- [29] Gondoin P., Lumb D., Siddiqui H., Guainazzi M., Schartel N., 2001, A&A, 373, 805
- [30] Gondoin P., Orr A., Lumb D., Stantos-Lleo M., 2002, A&A, 388, 74
- [31] Halpern J. P., 1984, ApJ, 281, 90
- [32] Ho L. C., 2002, ApJ, 564, 120
- [33] Jansen F. et al. 2001, A&A, 365, L1
- [34] Kaastra J. S. 1992, An X-Ray Spectral Code for Optically Thin Plasmas (Internal SRON-Leiden Report, updated version 2.0)
- [35] Kaastra J., Mewe R., Liedahl D. A., Komossa S., Brinkman A. C., 2000, A&A, 354, L83
- [36] Kaspi S. et al. , 2002, ApJ, 574, 643
- [37] Kriss G. A., 2002, in Crenshaw D. M., Kraemer S. B., and George I. M., eds., Mass Outflow in Active Galactic Nuclei: New Perspectives, ASP Conf. Ser. Vol. 255, p69
- [38] Laor A., 1991, ApJ, 376, 90
- [39] Laor A., Fiore F., Elvis M., Wilkes B. J., McDowell J. C., 1997, ApJ, 477, 93
- [40] Leahy D. A., Creighton J., 1993, MNRAS, 263, 314
- [41] Liedahl D. A., Osterheld A. L., Goldstein W. H. 1995, ApJL, 438, 115
- [42] Leighly K., 1999, ApJS, 125, 317
- [43] Lightman A. P., White T. R., 1988, ApJ, 335, 57
- [44] Magdziarz P., Zdziarski A.A., 1995, MNRAS, 273, 837
- [45] Markowitz A. et al. 2003a, ApJ, 593, 96
- [46] Markowitz A., Edelson R., Vaughan S., 2003b, 598, 935
- [47] Marshall H., Edelson R., Vaughan S., Malkan M. A., O’Brien P. T., Warwick R. S. 2003a, AJ, 125, 459
- [48] Marshall H. L., Tennant A., Grant C. E., Hitchcock A. P., O’Dell S., Plucinsky P. P., 2003b, SPIE vol. 5165, in press (astro-ph/0308332)
- [49] Marshall K., Ferrara E. C., Miller H. R., Marscher A. P., Madejski G., 2004, in Kaaret P., Lamb F. K., Swank J. H., eds., X-Ray Timing 2003: Rossi and Beyond, in press (astro-ph/0312422)
- [50] Matt G., Fabian A. C., Reynolds C. S., 1997, MNRAS, 289, 175
- [51] Matt G., Guainazzi M., Perola G. C., Fiore F., Nicastro F., Cappi M., Piro L., 2001, A&A, 377, L31
- [52] Molendi S., Sembay S., 2003, XMM-Newton Calibration Document XMM-SOC-CAL-TN-0036, available from: http://xmm.vilspa.esa.es/external/xmm_sw_cal/calib/
- [53] Nandra K., George I. M., 1994, MNRAS, 267, 980
- [54] Nandra K., Pounds K. A., 1994, MNRAS, 268, 405
- [55] Netzer H., et al. 2003, ApJ, 599, 933
- [56] Nordgren T. E., Helou G., Chengalur J. N., Terzian Y., Khachikian E., 1995, ApJS, 99, 461
- [57] O’Brien P. T., et al. , 2001, A&A, 365, L122
- [58] O’Brien P. T., Page K., Reeves J. N., Pounds K. A., Turner M. J. L., Puchnarewicz E. M., 2001a, MNRAS, 327, L37
- [59] Ogle P. M., Mason K. O., Page M. J., Salvi N. J., Cordova F. A., McHardy I. M., Priedhorsky W. C., 2004, ApJ, in press (astro-ph/0401173)
- [60] Osterbrock D. E., Pogge R. W. 1985, ApJ, 297, 166
- [61] Page K. L., Turner M. J. L., Done C., O’Brien P. T., Reeves J. N., Sembay S., Stuhlinger M., 2004a, MNRAS, in press (astro-ph/0312148)
- [62] Page K. L., O’Brien P. T., Reeves J. N., Turner M. J. L., 2004b, MNRAS, 347
- [63] Penton S. V., Stocke J. T., Shull J. M., 2000, ApJ, 130, 121
- [64] Peterson B. M., Meyers K. A., Capriotti E. R., Foltz C. B., Wilkes B. J., Miller H. R., 1985, ApJ, 292, 164
- [65] Peterson B. M., Gaskell C. M., 1991, ApJ, 368,152
- [66] Pravdo, S. H., Nugent, J. J., Nousek, J. A., Jensen, K., Wilson, A. S., Becker, R. H. 1981, ApJ, 251, 501
- [67] Pounds, K. A., Reeves, J. N., 2002, in New Visions of the X-ray Universe in the XMM-Newton and Chandra Era (astro-ph/0201436)
- [68] Reeves J. N., Turner M. J. L., Pounds K. A., O’Brien P. T., Boller Th., Ferrando P., Kendziorra E., Vercellone S., 2001, A&A, 365, L134
- [69] Reeves J. N., Nandra K., George I. M., Pounds K. A., Turner T. J., Yaqoob T., 2004, ApJ, in press (astro-ph/0310820)
- [70] Reynolds, C. S. 1997, MNRAS, 286, 513
- [71] Ross R. R., Fabian A. C. 1993, MNRAS, 261, 74
- [72] Ross R. R., Fabian A. C., Brandt W. N., 1996, MNRAS, 278, 1082
- [73] Ross R. R., Fabian A. C., Young A. J., 1999, MNRAS, 306, 461
- [74] Różańska A., Czerny B., Siemiginowska A., Dumont A.-M., Kawaguchi T., 2004, ApJ, 600, 96
- [75] Sako M., et al. 2001, A&A, 365, L168
- [76] Stark A. A., Gammie C. F., Wilson R. W., Bally J., Linke R., Heiles C., Hurwitz M., 1992, ApJS, 79, 77
- [77] Strüder L. et al. 2001, A&A, 365, L18
- [78] Titarchuk, L. 1994, ApJ, 434, 570
- [79] Turner M. J. L. et al. 2001a, A&A, 365, L27
- [80] Turner T. J., Pounds K. A., 1989, MNRAS, 240, 833
- [81] Turner T. J. et al. 2001b, ApJ, 548, L13
- [82] Turner T. J., et al. 2002, ApJ, 568, 120
- [83] Uttley P., McHardy I. M., Papadakis I., 2002, MNRAS, 332,
- [84] Vaughan S., Reeves J. N., Warwick R. S., Edelson R., 1999, MNRAS, 309, 113
- [85] Vaughan S., Boller Th., Fabian A. C., Ballantyne D. R., Brandt W. N., Trumper J., 2002, MNRAS, 337, 247
- [86] Vaughan S., Edelson R., Warwick R. S., Uttley P., 2003b, MNRAS, 345, 1271
- [87] Vaughan S., Fabian A. C., 2004, MNRAS, in press (astro-ph/0311473)
- [88] Verner D. A., Verner E. M., Ferland G. J., 1996, Atomic Data Nucl. Data Tables, 64, 1
- [89] Wakker B. P., et al. 2003, ApJS, 146, 1
- [90] Walter R.; Fink H. H., 1993, A&A, 274, 105
- [91] Wandel A., Peterson B. M., Malkan M. A., 1999, ApJ, 526, 579
- [92] Ward M. J., Elvis M., Fabbiano G., Carleton N. P., Willner S. P., Lawrence A., 1987, ApJ, 315, 74
- [93] Weaver K. A., Nousek J., Yaqoob T., Hayashida K., Murakami S., 1995, ApJ, 451, 147
- [94] Wilms J., Allen A., McCray R., 2000, ApJ, 542, 914
- [95] Yaqoob T., George I. M., Nandra K., Turner T. J., Serlemitsos P. J., Mushotzky R. F., 2001, ApJ, 546, 759
- [96] Yaqoob T., George I. M., Turner T. J., 2002, in High Energy Universe at Sharp Focus: Chandra Science, eds. S. Vrtilek., E. M. Schlegel, L. Kuhi (astro-ph/0111428)
- [97] Yaqoob T., Padmanabhan U., 2004, ApJ, in press (astro-ph/0311551)