Technikerstraße 25, A-6020 Innsbruck, Austria
11email: giovanna.temporin@uibk.ac.at
11email: ronald.weinberger@uibk.ac.at
An uncatalogued optical H ii region at the outskirts of the Galaxy††thanks: Based on observations made with the Nordic Optical Telescope, operated on the island of La Palma jointly by Denmark, Finland, Iceland, Norway, and Sweden, in the Spanish Observatorio del Roque de los Muchachos of the Instituto de Astrofisica de Canarias.
We present NOT optical observations of a clump (l = 1279435 , b = 18298), embedded in an extended, irregularly shaped, diffuse optical nebula. This condensation shows an emission-line spectrum typical of classic H ii regions. Although its location on the sky coincides with a nearby extended photoionized region recently identified by Cichowolski et al. (2003) in radio data from the Canadian Galactic Plane Survey (CGPS), the systemic velocity of this 1′-sized H ii region, VLSR = 7112 km s-1, poses it far out in the Galaxy, beyond the Perseus arm. The location of this region in the Galaxy is supported by H i structures visible at comparable radial velocity on CGPS data. We argue that this H ii region might belong to an outer Galactic arm. The emission line ratios of the surrounding extended nebula, whose radial velocity is consistent with that of the small H ii region, are typical of photoionized gas in the low density limit. Smaller clumps of comparable surface brightness are visible within the optical boundaries of the extended, faint nebula. After comparison of the optical data with far infrared and radio observations, we conclude that this nebula is an H ii region, 70 pc in size, probably photoionized by an association of OB stars and surrounded by a ring of neutral hydrogen.
Key Words.:
(ISM:) H ii regions; ISM: individual objects: IRAS 01342+6358, IRAS 01330+63511 Introduction
Galactic H ii regions offer the opportunity of investigating and understanding the details of star formation processes. Furthermore, the identification of H ii regions is of interest to trace the spiral structure of our Galaxy, which is still a matter of debate (e.g. McClure-Griffiths et al. 2004; Russeil 2003, and references therein).
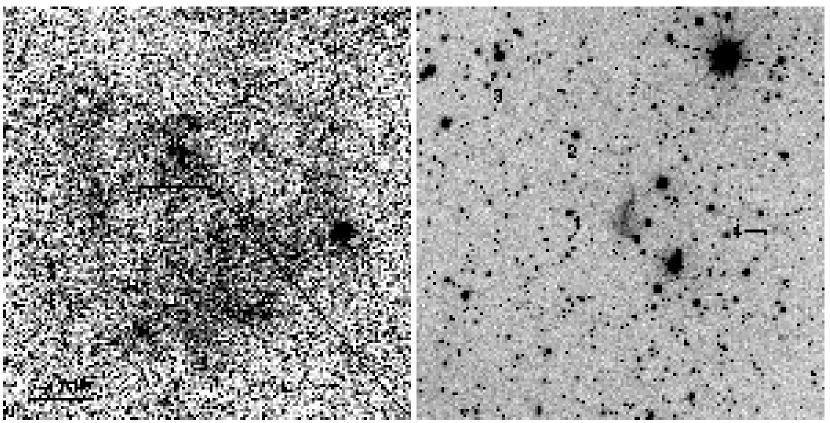
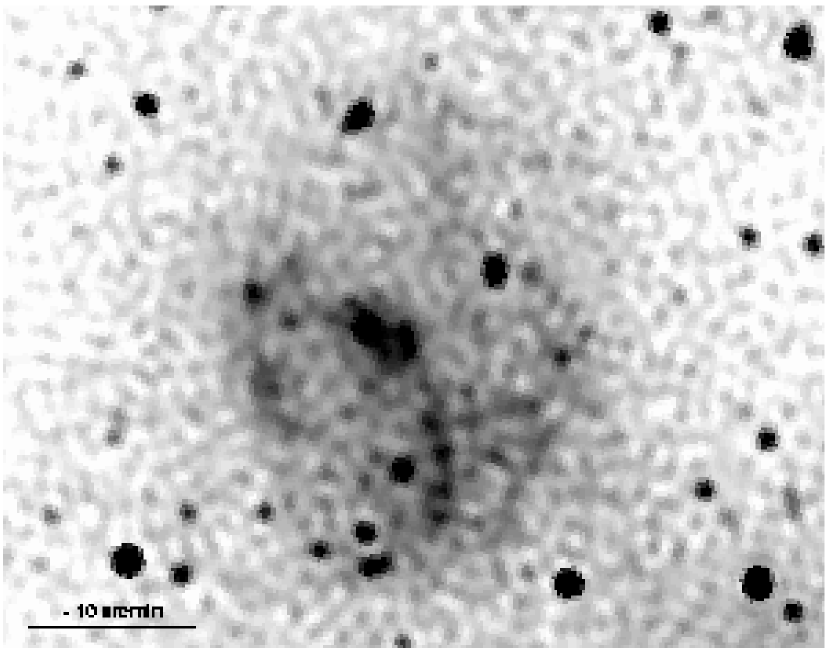
During our searches for galaxies beyond the Galactic plane – based on visual inspection of Palomar Observatory Sky Survey plates of both first and second generation (e.g., Seeberger et al. 1996; Weinberger et al. 1999) – we have identified an extended and irregularly shaped nebula, not previously catalogued, within (or in projection onto) which a number of brighter condensations are visible. The whole object is extended over about half a degree on the sky, while the bright condensations are much more limited in size, the brightest and largest one, located at l = 1279435 , b = 18298, having a major axis of 1′. Its morphology happens to be similar to that of the giant ( 2°2° in extent) H ii region IC 1805 (also known as W4), ionized by the association Cas OB6 and located at a distance of 2.35 kpc (Massey et al. 1995).
Two IRAS peaks of emission, listed in the IRAS Point Source Catalogue as IRAS 01342+6358 and IRAS 01330+6351, are present in the same region of the sky and were identified and measured as actually extended FIR sources by Fich & Terebey (1996). Observations of one of these sources, IRAS 01342+6358, during the CS(2-1) survey of ultracompact (UC) H ii regions (Bronfman et al. 1996) left the source undetected, therefore its radial velocity and kinematic distance could not be determined. Recently, Cichowolski et al. (2003) gave evidence that the extended FIR emission is associated with an extended thermal source of radio emission. They argued that this structure is physically related to a “hole” in the H i distribution observed at a systemic velocity of 29.5 km s-1, and traces gas photoionized by the nearby O star HD 10125. However, they do not provide any direct measurement of the radial velocity (and therefore distance) of the ionized material. To our knowledge, no spectroscopic observations of this ionized region have been published to date. In this paper we present for the first time -band photometry and optical spectroscopy of a portion of the optical extended nebula spatially coincident with the extended FIR and radio emission, including the 1′-size brighter condensation cited above. Beside investigating the physical properties of this “condensation”, that is revealed as a classic H ii region, we derive its radial velocity and try to establish whether this region is related to the surrounding extended nebula and associated to the extended photoionized region recently identified by Cichowolski et al. (2003).
2 Observations and measurements
The optical data were obtained in 1999 November at the Nordic Optical Telescope (NOT) with the faint object spectrograph and camera ALFOSC and consist of a 330 s -band exposure covering a field of view of 5′5′ and a 1800 s long-slit spectrum taken along the major axis of the bright optical condensation (position angle = 165°). Both the image and the spectrum have a spatial scale of 0188 pixel-1. The seeing during the observations was 08. The long-slit spectrum was taken with a 1″-wide slit and has a dispersion of 1.483 Å pixel-1 and a spectral resolution of 6.5 Å over the wavelength range 3833 – 6857 Å, as evaluated from the FWHM of comparison lines. -band images of a Landolt (1992) standard field for photometric calibration and long-slit spectra of the spectrophotometric standard star BD+284211 were taken three and two times, respectively, during the same night. Standard reduction steps were performed with the available IRAF111IRAF is distributed by the National Optical Astronomy Observatories, which are operated by the Association of Universities for Research in Astronomy, Inc., under cooperative agreement with the National Science Foundation. packages. The 2 limiting magnitude and surface brightness of our -band image are = 23.88 mag, = 24.74 mag arcsec-2.
2.1 Photometry
Since the diffuse nebula, as visible in the Digitized Sky Survey image (Fig. 1), extends over about half a degree on the sky, we could image only a portion of it, which completely filled the ALFOSC field-of-view. This fact prevented us from any estimation of the real sky-background, as well as an evaluation of the average surface brightness of the most diffuse portion of the nebula. Therefore, we only were able to evaluate the magnitude and surface brightness of the bright condensations falling within our field-of-view. A bidimensional polynomial fit to the sky-background (thus including the contribution from the more diffuse part of the nebula) was obtained with MIDAS222MIDAS is developed and maintained by the European Southern Observatory. on the R-band image after masking (IRAF task IMEDIT) of badly saturated stars in the field and subtraction of the unsaturated stars through a fit to a model point spread function (obtained with the DAOPHOT package within IRAF). These operations were necessary because of the relatively strong contamination by stars, owe to the low Galactic latitude of the target. Photometric measurements of the clumps within the nebula were performed on the background-subtracted, free of stars, image by use of both circular apertures completely encompassing the visible clumps and polygonal apertures following the outermost visible contours. Both methods gave similar values of total magnitudes. The polygonal apertures were used to estimate the surface brightness. The measured values are given in Table 1. The whole structure, except for a filamentary extension to the north, fits into 2/3 of a circle 158 in radius. In other words, the bulk of the structure is confined within a region 316 256 in size. When the northern extension is considered as well, the major axis of the structure reaches 49″.
2.2 Spectroscopy: Physical properties of the region
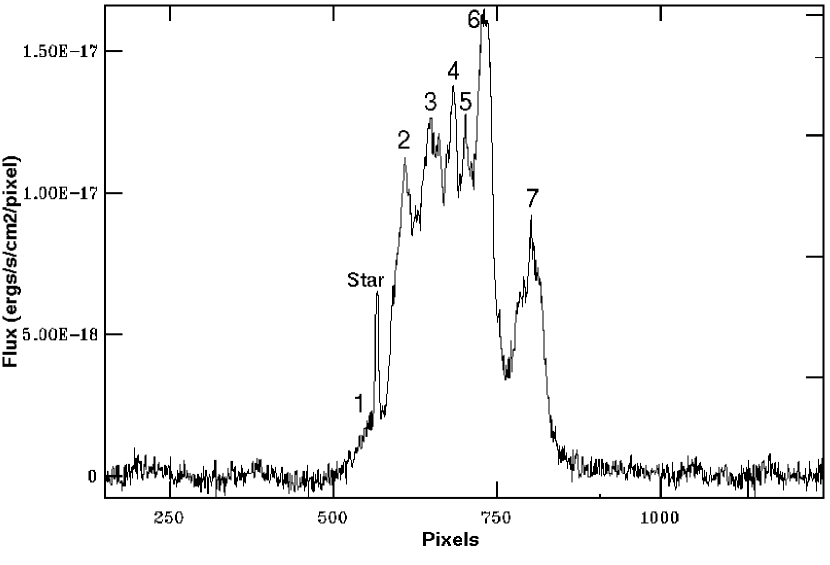
The long-slit spectrum showed extended line emission without any detectable continuum. Considerable substructure was detected in the source, as it can be seen from the H emission-line profile along the slit (after background subtraction) in Fig. 2, where individual subregions are numbered 1 to 7. We measured emission line fluxes both in the individual subregions and in the total spectrum of the source in order to determine possible variations of physical properties across it, along with its average properties. Both the observed and extinction corrected emission line fluxes are reported in Table 2, together with the amount of foreground extinction as derived from the Balmer decrement assuming as an intrinsic ratio H/H = 2.86, the theoretical value for case B recombination nebulae (Osterbrock 1989). The total foreground extinction to the source, expressed in terms of color excess E(), ranges between 0.5 and 1.0 mag. The foreground extinction caused by intervening Galactic material along the line-of-sight to the source is difficult to determine. However, considering the 12 stars with known spectral type, estimated distances in the range 1.17 to 4.28 kpc, and projected distances within a radius of 1° from the source, we found an average extinction E() = 0.50.3 mag, in rough agreement with the absorption of 1.00.2 mag derived by Cichowolski et al. (2003) considering the H i column density out to velocities around 30 km s-1. Therefore we estimate for the observed source an internal extinction E() 0.5 mag.
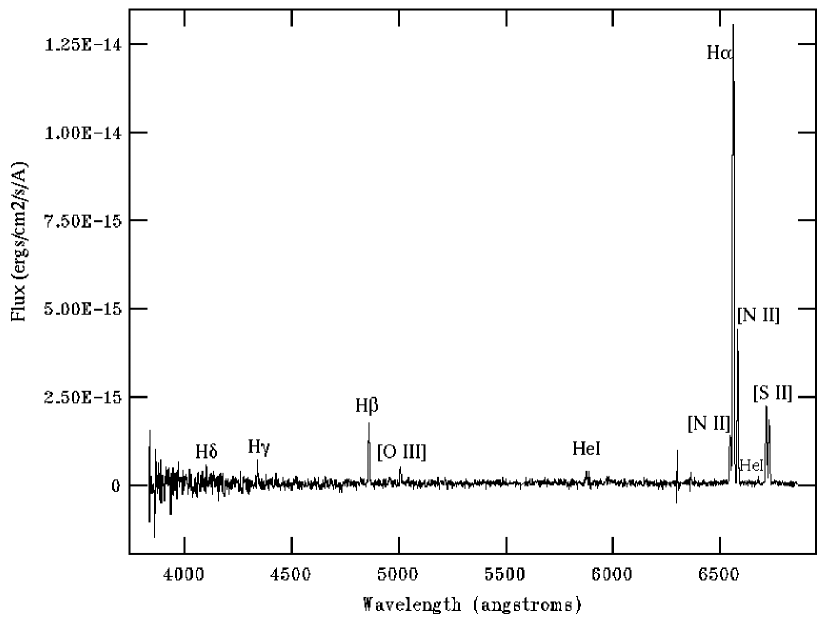
The classic diagnostic emission-line ratios (Table 3) we measured are all typical of photoionized H ii regions (e.g. Galarza et al. 1999, and references therein). No evidence of ionization by shocks was found. Unfortunately the lack of a detectable [O iii] 4363 line prevented us from estimating the electronic temperature of the ionized gas, therefore we assumed a canonical value for H ii regions, Te = 104 K and derived the electronic density Ne from the ratio of the [S ii] 6716,6731 lines. We found Ne values in the range 1.7 - 2.4102 cm-3 (Table 2), which are characteristic of classic H ii regions and at least one to two orders of magnitude lower than values typical of compact or UCH ii regions (e.g. Franco et al. 2003, and references therein). The total spectrum of the H ii region is shown in Fig. 3. The presence of very strong [O i] 6300,6364 night-sky lines prevented us from establishing with certainty the presence or absence of [O i] emission from the nebula. However, a comparison of the [O i] lines on- and off-source along the slit seems to indicate that these emission lines are absent or extremely week on the spectrum of the source. Therefore, we conclude that oxygen is almost fully ionized in this region indicating that the partially ionized zone of the nebula, where O i is present, is probably a very thin layer, as expected in case of ionizing stars of OB spectral types.
|
-
a
Fluxes are in units of 10-16 ergs s-1 cm-2 Å-1 and are listed along with (dimensionless) relative errors.
|
2.3 Spectroscopy: Radial velocity determination
The inspection of the spectrum before the background subtraction, allowed us the detection of the H emission-line (and of most other emission lines at lower signal level) all along the slit. Since the extended nebula occupies the whole field-of-view, we conclude that this emission, well outside the visible boundaries of the H ii region described above, stems from the extended, low surface brightness nebula filling the field of view. Therefore, we measured the position of the H line in 10 pixel bins along the whole slit, in order to establish whether the bright H ii region and the surrounding nebula of excited gas are only projected onto each other or have comparable radial velocities, i.e. are spatially coincident. Radial velocity measurements were based on the H line, since this is by far more intense than all other detected emission lines, and thus gives a better accuracy. To estimate the error in radial velocity measurements and detect/correct for possible systematic errors, we measured the [O i] sky-lines in the same apertures all along the slit. We actually found a systematic error in radial velocity with a well defined, regular trend along the slit, being nearly zero in the central part of the frame (where the spectrum of the bright H ii region is located) and increasing when moving toward the borders. The trend was confirmed also by the measurement of other sky-lines within the wavelength range. Radial velocities measured in each 10-pixel bin were corrected for the relevant systematic error333The spectral resolution does not allow us to separate the geocoronal H line. However, since this line is at rest with respect to Earth like all other night-sky lines, the correction involving the use of the [O i] sky-lines implicitly takes into account the geocoronal line as a radial velocity zero-point. As an additional remark we note that the emission-line ratios typical of H ii regions measured in Section 2.4 suggest that the contribution of the geocoronal line to the observed H emission is marginal in this spectrum.. The dispersion of position measurements of the brightest sky-lines around their expected values, within each 10-pixel bin, gives an estimate of the uncertainty of the radial velocities. This is about 12 km s-1. The systemic velocity of the H ii region, obtained by averaging the radial velocities measured within its borders (as visible in the R-band image and in the H profile), is VLSR = 71 km s-1. The extended part of the nebula exhibits a comparable value (within measurement errors) of radial velocity, on average VLSR = 60 km s-1.We conclude that the two structures are physically associated and not purely overlapping because of projection effects. In principle, part of the detected H line might stem from other intervening Galactic nebulae along the line-of-sight or from diffuse Galactic H emission. In fact faint diffuse Galactic H emission appears to cover almost the entire sky (Reynolds 1990). The resolution of our spectra would not allow to unambiguously separate a different velocity, weaker H component, which would appear in narrow blend with the observed line. However, we do not observe any hint of a second component in the line profile (e.g. double peaks, wings, humps, etc.), therefore we argue that the emission line component at the observed VLSR = 60 km s-1 is (if not the only) the dominant one along the line of sight. Additionally, as we show below, the spectrum of the extended nebula is typical of classic H ii regions, therefore significantly different from the spectrum of diffuse warm ionized interstellar gas (Reynolds 1990).
Following the method outlined by Brand & Blitz (1993) and using their best fit of the Galactic rotation curve and our measurement of VLSR, we estimated the distance of the photoionized nebula. We assumed the position of the bright clump as representative of the center of the nebula, and used the radius of the clump ( 16″) as an indication of the positional error. We used for the Sun the IAU-recommended values of Galactocentric distance and circular velocity, i.e. R0 = 8.5 kpc and = 220 km s-1. We found a heliocentric distance = 8.2 kpc. Since the semi-major and semi-minor axes of the nebula, as visible on the DSS2 image, are 158 and 144, this translates into an approximate diameter of 72 pc. At 8.2 kpc and b 183 this H ii region is located at 260 pc.
2.4 Spectroscopy: Physical properties of the extended nebula
In order to understand the nature of the extended nebula, we also analyzed the trend of the emission-line ratios along the slit. We found no substantial variation of the diagnostic emission-line ratios, i.e. the low surface brightness extended nebula as well shows typical characteristics of classic H ii regions. The only difference between the fainter and the brighter parts of the nebula falling in the slit resides in the ratio of the [S ii] 6716,6731 lines, which in the fainter parts increases to values 2, indicating that the extended nebula is in the low density limit, with Ne 10 cm-3. The total foreground extinction measured all along the slit, as shown in Fig. 4, does not differ substantially from that derived above for the bright clump, ranging from 0.5 to 2.3 mag with an average value E(BV) = 1.20.3 mag. The H emission measure calculated for the region of the bright clump falling within the slit, after reddening correction, is EM 6.94 103 pc cm-6, while the value found for the adjacent parts of the extended nebula is EM 5.33 103 pc cm-6. We exclude the possibility that the low surface brightness nebula is a region of diffuse ionized gas (DIG) both on the basis of its H EM 100 pc cm-6 and of its [S ii]/H ratio, which is usually found to be considerably higher in DIG than in classic H ii regions (see, e.g. Galarza et al. 1999).

Assuming on average an EM 5.3 103 pc cm-6 in the brighter area of the extended nebula ( 334 arcmin2, as estimated on the DSS2 image), considering negligible the contribution of the fainter parts of the nebula, and using the distance determined above, we obtained a rough estimate of the total (extinction-corrected) H luminosity, L(H) 1.11038 erg s-1. This luminosity is equivalent to a total number of ionizing photons Q 7.71049 photons s-1 (Kennicutt 1998). The estimated Qion could be produced by a single ionizing star of spectral type between O5.5Ia and O3V, according to values tabulated by Vacca et al. (1996, their Tables 5 to 7). However, the corresponding radius of the Strömgren sphere would be 6.2 pc, much smaller than the observed radius ( 36 pc) of the ionized nebula. We argue that, as an alternative, the necessary amount of ionizing photons could be emitted by an association of lower luminosity OB stars. As an example, about 50 stars of spectral types between O9V and B0.5V would produce a total amount of ionizing photons similar to our estimated values. This interpretation could account for the relatively large size of the Strömgren sphere. Additionally, we note that the Strömgren sphere radii given by Vacca et al. (1996) are calculated assuming a hydrogen density NH = 102 cm-3 and therefore are significantly smaller than those tabulated by Osterbrock (1989) under the assumption of NH = Ne = 1 cm-3. Our spectral analysis showed that, while the bright 1′-size clump has Ne 2102 cm-3, the surrounding nebula is in the low-density limit, Ne 10 cm-3. This fact might contribute to explain the discrepancy between the observed size of the ionized region and the tabulated values of Strömgren sphere radii. Our conclusion is that the nebula can probably be ionized by a few to a few tens of OB stars.
3 Comparison with FIR and radio emission
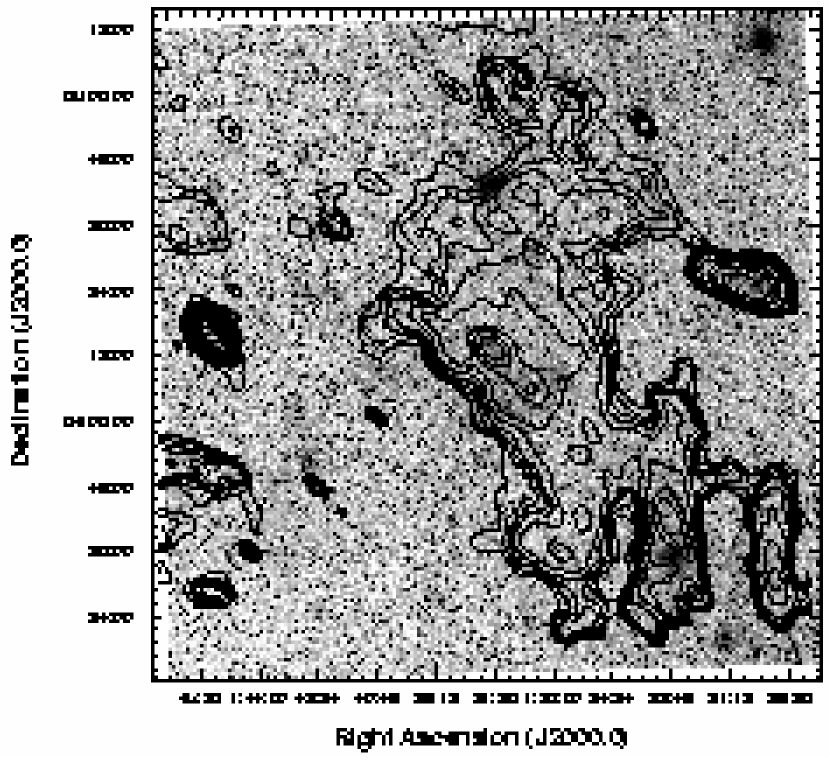
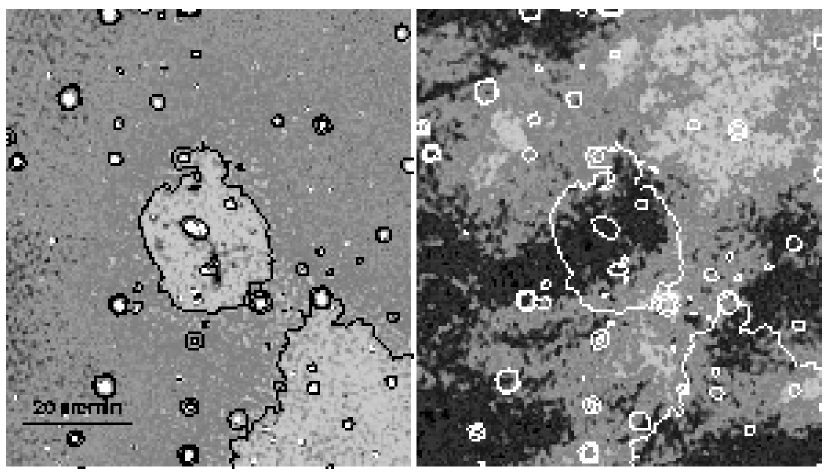
In order to derive additional information on the observed nebula, we compared the optical images (both DSS2 images and our own R-band exposure) with FIR emission from IRAS data and radio emission available from several sources in the literature and from archival data of the CGPS in the same region of the sky. Contour maps of the 60 m emission, reconstructed from IRAS raw data available at the Groningen IRAS server, after correction for zodiacal emission, are shown in Fig. 5, overplotted onto the DSS2 R-band image of a 2°2° field centered at the position of the H ii region. As already noticed by other authors (Fich & Terebey 1996), besides the two sources listed in the IRAS Point Source Catalogue, extended emission is clearly visible. A striking coincidence of such an extended emission with the extended nebula visible in the DSS image strongly suggests that the two features are correlated. This spatial coincidence is even better visible in Fig. 6, where a 1°1° DSS image centered on the optical source is overlapped with the contours of a 60 m high resolution image obtained by processing the IRAS data with a program based on the maximum entropy algorithm MeMSys5 (Bontekoe et al. 1994). In particular the two strong sources IRAS 01342+6358 and IRAS 01330+6351 are coincident with the two main subfeatures visible in the optical nebula. The bright H ii region we identified within the extended nebula lies in close vicinity of the peak of IRAS emission at the center of the field. The spatial coincidence of the extended FIR emission with the extended radio continuum emission detected by the CGPS has already been shown by Cichowolski et al. (2003). Additionally, we notice a remarkable similarity between the radio and optical substructures of the extended nebula, as can be seen by comparing the CGPS radio map at 1420 MHz (Fig. 7) with the DSS image of the nebula (Fig. 1, left). Finally, the radio source NVSSJ013746+641452, 80″ in extent, with integrated flux density of 20.72.5 mJy at 1.4 GHz, detected by Condon et al. (1998), coincides, within the positional error, with the bright optical clump, which shows a comparable extent in the R-band image. In view of these spatial coincidences, we suggest that all the above features in the optical, radio, and FIR are related one another. Given the radial velocity measured for the H ii region and surrounding ionized nebula, the above considerations would pose all the above structures at Galactocentric distance 15 kpc (i.e. heliocentric distance 8.2 kpc), in contrast with the considerably smaller distance proposed by Cichowolski et al. (2003), based on structures detected in the H i 21 cm line at VLSR 29.5 km s-1.
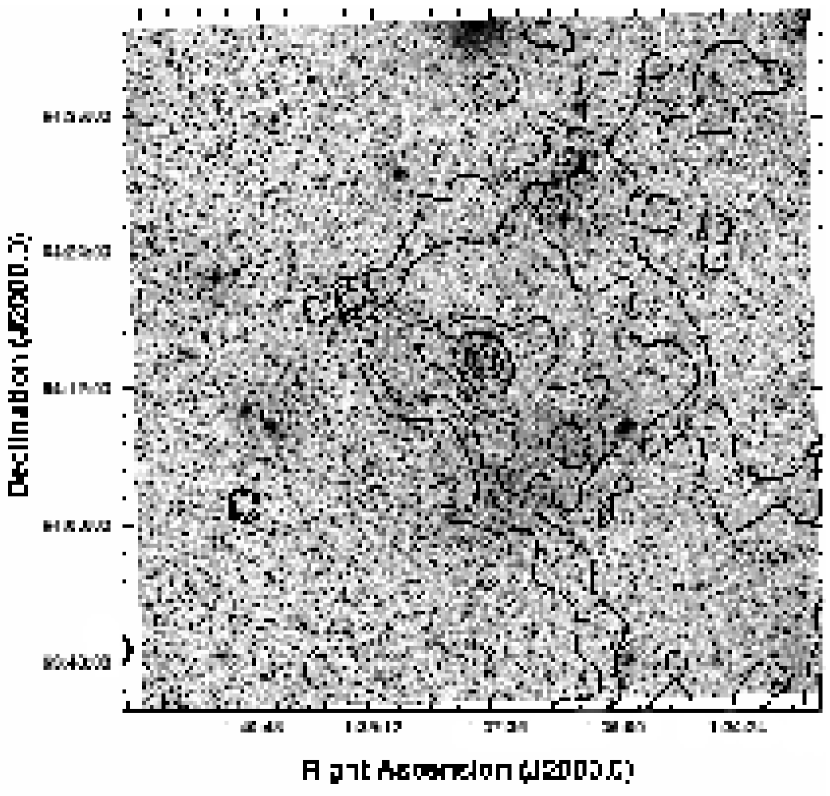
The examination of the 21 cm data from the CGPS archive gives further support to our interpretation. In fact, the plot of brightness temperature in the direction of the H ii region (Fig. 8) shows a secondary depression in the H i distribution at VLSR 70 km s-1, in good agreement with our measured radial velocity. The H i 21 cm-line image at the position of the extended nebula shows a hole in the H i distribution in clear correspondence of the ionized gas visible in the radio-continuum and optical images. The size and boundaries of the “hole” are in good agreement with those of the ionized nebula, with a “ring” of neutral hydrogen largely surrounding the photoionized gas. This correspondence is well visible in several velocity channels in the range 64 to 71 km s-1 (especially at 67 km s-1) and is shown in Fig. 9, where the radio-continuum at the position of the nebula is compared to the 21 cm-line map, averaged over the velocity interval 65.8 to 69.1 km s-1. These velocities are in good agreement (within measurement errors) with the radial velocities obtained from the optical spectrum of the nebula.

4 Conclusions
We have performed -band photometry and optical spectroscopy of an emission nebula located 2° above the Galactic plane with the main aims to examine the physical conditions of its gas and establish its location within the Galactic structure. It was also our intention to establish whether the observed optical structures in this region of the sky are physically connected one to the others or are rather distinct structures seen in projection along the line-of-sight.
Our data indicate that the bright condensation 1′ in size has typical emission-line ratios of a classic H ii region. The radial velocity of the observed H line suggests that the H ii region is located far out in the Galaxy, well beyond the Perseus arm. We speculate that it might belong to the outer arm of the Galaxy. Actually, indications of the presence of spiral arm tracers in the second Galactic quadrant at distances up to 11 kpc have been reported by several authors (see, e.g. Kimeswenger & Weinberger 1989, and references therein). In particular, Kimeswenger & Weinberger (1989), collecting a number of different spiral arm tracers, gave evidence of the existence of an outer spiral arm, bending above the Galactic plane in the second quadrant (see also the structure of the Galactic warp shown e.g. by Wiedemair 2001), at distances comparable to the kinematic distance of the H ii region discussed in this work.
The presence of a depression in the H i profile along the line-of-sight to the H ii region at velocities in agreement with those measured from our optical spectra further supports our interpretation. Additionally, we observe fainter emission lines also from the extended optical nebula that is completely filling our field-of-view. The radial velocity of these emission-lines is in agreement with that of the identified H ii region, within the measurement errors. Once again the diagnostic emission-line ratios are typical of classic H ii regions. These facts support the idea that the bright clump and the irregularly shaped, extended optical nebula are physically related and constitute a center-brightened H ii region. Considerations on the emission measure, apparent size, and estimated distance of the nebula lead to conclude that its gas is ionized by an association of a small number of OB stars. A comparison between the DSS2 image of this extended nebula and the 60 and 100 m IRAS images reveals a striking spatial coincidence of the structures and, even more strikingly, its optical substructures are well reproduced by substructures visible in the 1420 MHz continuum. This is in contrast with the recent work of Cichowolski et al. (2003), who give some evidence of the association of these FIR sources and their radio-continuum counterparts with a nearby (distance 3 kpc) region photoionized by the O star HD 10125. Although the arguments given by Cichowolski et al. (2003) look convincing, they are not supported by direct radial velocity measurements of the ionized gas. Indeed, the correspondence we find between a “hole” in the H i distribution at velocities around 67 km s-1 and the extended radio-continuum emission appears much tighter than the correspondence with an H i “hole” at 29.5 km s-1 suggested by Cichowolski et al. (2003). In the light of our observations, we argue that both the FIR sources and the radio-continuum emission are rather associated to the more distant ( 8.2 kpc) photoionized nebula we have identified.
Acknowledgements.
ST is grateful to S. Ciroi for helpful discussions. We thank the referee, D. Russeil, for his timely and useful report. A part of this work was supported by the Austrian Science Fund (FWF) under project P15065. This work made use of data produced by the CGPS Consortium. The Canadian Galactic Plane Survey (CGPS) is a Canadian project with international partners. The Dominion Radio Astrophysical Observatory is operated as a national facility by the National Research Council of Canada. The CGPS is supported by a grant from the Natural Sciences and Engineering Research Council of Canada. IRAS data were obtained from the IRAS Data Server located at Kapteyn and operated by SRON.References
- Bontekoe et al. (1994) Bontekoe,Tj. R., Koper, E., & Kester, D. J. M. 1994, A&A, 284, 1037
- Brand & Blitz (1993) Brand, J. & Blitz, L. 1993, A&A, 275, 67
- Bronfman et al. (1996) Bronfman, L., Nyman, L.-A., & May, J. 1996, A&AS, 115, 81
- Cichowolski et al. (2003) Cichowolski, S., Arnal, E. M., Cappa, C. E., Pineault, S. & St-Louis, N. 2003, MNRAS, 343, 47
- Condon et al. (1998) Condon, J. J., Cotton, W. D., Greisen, E. W. et al. 1998, AJ, 115, 1693
- Fich & Terebey (1996) Fich, M. & Terebey, S. 1996, ApJ, 472, 624
- Franco et al. (2003) Franco, J., Kurtz, S., & García-Segura, G. 2003, Rev. Mod. Astron., 16, 85
- Galarza et al. (1999) Galarza, V. C., Walterbos, R. A. M., & Braun, R. 1999, AJ, 118, 2775
- Kennicutt (1998) Kennicutt, R. C. Jr. 1998, ARA&A, 36, 189
- Kimeswenger & Weinberger (1989) Kimeswenger, S. & Weinberger, R. 1989, A&A, 209, 51
- Landolt (1992) Landolt, A. U. 1992, AJ, 104, 340
- Massey et al. (1995) Massey, P., Johnson, K. E., & DeGioia-Eastwood, K., 1995, ApJ, 454, 151
- McClure-Griffiths et al. (2004) McClure-Griffiths, N. M., Dickey, J. M., Gaensler, B. M., & Green, A. J. 2004, ApJ, submitted
- Osterbrock (1989) Osterbrock, D. E. 1989, Astrophysics of Gaseous Nebulae and Active Galactic Nuclei (Mill Valley, CA: University Science)
- Reynolds (1990) Reynolds, R. J. 1990, IAU Symp., 139, 157
- Russeil (2003) Russeil, D. 2003, A&A, 397, 133
- Seeberger et al. (1996) Seeberger, R., Saurer, W., & Weinberger, R. 1996, A&AS, 117, 1
- Vacca et al. (1996) Vacca, W. D., Garmany, C. D., & Shull, J. M. 1996, ApJ, 460, 914
- Weinberger et al. (1999) Weinberger, R., Gajdošík, M., & Zanin, C. 1999, A&AS, 137, 293
- Wiedemair (2001) Wiedemair, C. 2001, Master Thesis, University of Innsbruck