HD 108: the mystery deepens with XMM-Newton observations††thanks: Based on observations collected at the Observatoire de Haute-Provence (France) and with XMM-Newton, an ESA Science Mission with instruments and contributions directly funded by ESA Member States and the USA (NASA).
In 2001, using a large spectroscopic dataset from an extensive monitoring campaign, we discovered that the peculiar Of star HD 108 displayed extreme line variations. This strange behaviour could be attributed to a variety of models, and an investigation of the high energy properties of HD 108 was needed to test the predictions from these models. Our dedicated XMM-Newton observation of HD 108 shows that its spectrum is well represented by a two temperature thermal plasma model with keV and keV. In addition, we find that the star does not display any significant short-term changes during the XMM-Newton exposure. Compared to previous and ROSAT detections, it also appears that HD 108 does not present long-term flux variations either. While the line variations continue to modify HD 108’s spectrum in the optical domain, the X-ray emission of the star appears thus surprisingly stable: no simple model is for the moment able to explain such an unexpected behaviour.
Thanks to its high sensitivity, the XMM-Newton observatory has also enabled the serendipitous discovery of 57 new X-ray sources in the field of HD 108. Their properties are also discussed in this paper.
Key Words.:
Stars: early-type – X-rays: stars – Stars: winds, outflows – Stars: individual: HD 1081 Introduction
Some O-type stars are still challenging astronomers many decades after their discovery. HD 108 is a good example of such an object. In the past, this star has been the target of several investigations, but apparently, none could arrive at a consensus on the exact nature of this peculiar star. Consequently, various theories have successively been proposed: HD 108 has been classified as a short-term binary (having even survived a supernova event according to some authors); it has been proposed to be a single star experiencing wind variability and/or harbouring a disc and jets; and finally it was suggested to be a long-term binary (see Nazé et al. 2001, hereafter Paper I, and references therein). In Paper I, we presented a 30 year campaign of optical spectroscopy dedicated to HD 108. We showed that the behaviour of HD 108 was not that of a classical short- or long-term SB1 binary. The star also did not present any short-term variations. But our extensive campaign clearly indicated the peculiar characteristics of this star: tremendous line variations on the timescale of decades. The hydrogen and He i lines change from strong P Cygni profiles to simple absorptions, and a few other emission lines apparently follow the same behaviour. Comparing with all data available, we noted that these variations were recurrent, on a timescale of a few decades. Such a continuous decline of H i and He i lines was recently discovered by Walborn et al. (wal03 (2003)) in another Of?p star, HD 191612. The line variations of this star are strikingly similar to HD 108, but occur on a shorter timescale. In this context, we note that HD 191612 has now returned to a high emission state: a spectrum of this star covering the H line, taken in October 2003 at the Observatoire de Haute-Provence, is almost identical to that of August 1997 presented by Walborn et al. (wal03 (2003)).
The nature of these Of?p stars is still unknown. The most popular models to explain their peculiar behaviour involve the presence of a compact companion on an elliptical orbit, or require the star to be a single rapid rotator (see e.g. the review in Walborn et al. wal03 (2003)). It was also suggested that these stars could be transition objects, explaining their small number (only 3 are known in our Galaxy). In this context, X-ray observations represent an important opportunity to better understand these objects, since stars reveal at high energies the most exotic processes taking place in their vicinity. X-ray data are especially well suited to test the possibility of accretion processes linked to the presence of a compact object or a colliding wind interaction in a binary. We thus decided to observe HD 108 with the XMM-Newton satellite, in the hope that its high sensitivity could provide us with definitive answers on the nature of HD 108.
In this paper, we describe in Sect. 2 the observations used in this study. The optical and X-ray data of HD 108 will then be successively analysed in Sect. 3. The remarkable sensitivity of XMM-Newton also enabled the serendipitous discovery of many fainter sources during our observation. These sources detected in the field of HD 108, their possible counterparts, their hardness ratios (HRs), their variability, and their spectral characteristics will be discussed in Sect. 4. Finally, we will conclude in Sect. 5.
2 Observations
2.1 X-ray data
HD 108 was observed with XMM-Newton in the framework of the guaranteed time of the Optical Monitor Consortium during revolution 494, on Aug. 21 2002, for approximately 35 ks. The two EPIC MOS cameras (Turner et al. tur (2001)) were used in full frame mode, and the EPIC pn instrument (Strüder et al. str (2001)) was operated in extended full frame mode. A thick filter was added to reject optical light.
We used the Science Analysis System (SAS) software version 5.4.1. to reduce the EPIC data. These data were first processed through the pipeline chains, and then filtered. For EPIC MOS, only events with a pattern between 0 and 12 and passing through the #XMMEA_EM filter were considered. For EPIC pn, we kept events with flag0 and a pattern between 0 and 4. To search for contamination by low energy protons, we examined the light curve at high energies (Pulse Invariant channel number 10000, E10 keV, and with pattern0). A very short flare was detected and we thus discarded the time intervals with a high energy count rate larger than 0.2 cts s-1 (for EPIC MOS) and 0.64 cts s-1 (for EPIC pn). The resulting useful exposure times are 35.7 ks and 28.9 ks for EPIC MOS and pn, respectively. Further analysis was performed using the SAS v5.4.1. and the FTOOLS tasks. The spectra were analysed and fitted within XSPEC v11.0.1.
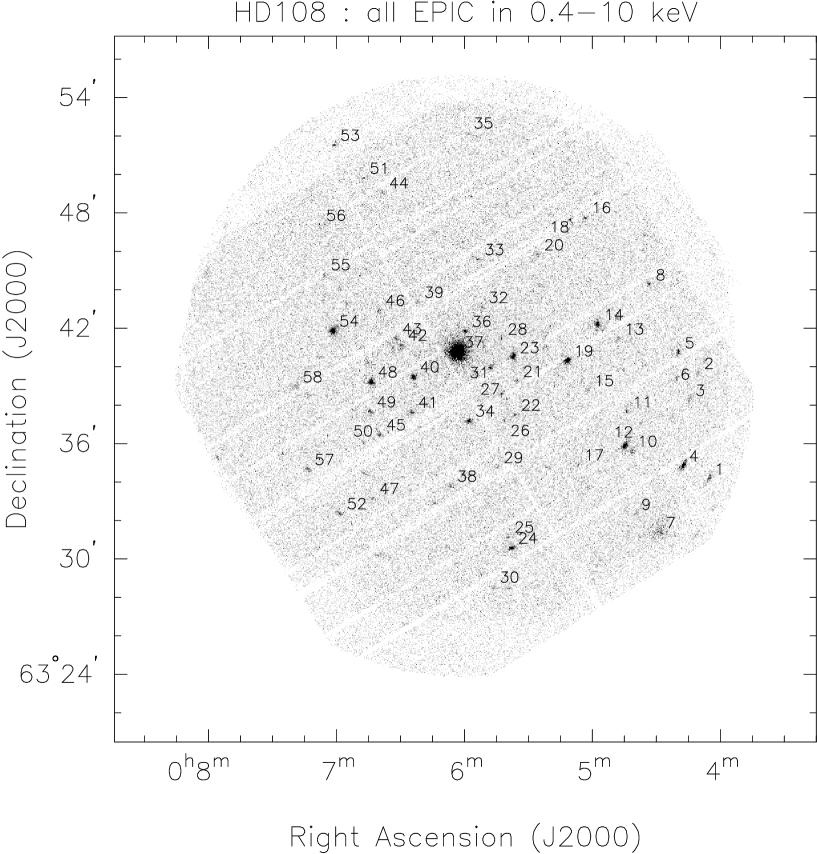
The first two figures show images of the field from the combined EPIC instruments. Figure 1 presents a three colour image, in which numerous hard X-ray point sources are clearly seen. Figure 2 gives the identification of the point sources detected in the field (see Sect. 4 and Table 3).
The RGS data were processed through the ‘rgsproc’ pipeline SAS meta-task. This routine determines the location of the source spectrum on the detector (see e.g. den Herder et al. RGS (2001)), and performs the extraction of the source spectrum as well as of the background spectrum from a spatially offset background region. Finally, the task computes tailored response matrices for the first and second order RGS spectra.
2.2 Additional optical data
In 2001, 2002 and 2003, we continued our extensive spectroscopic survey of HD 108 with the Aurélie spectrograph attached to the 1.52 m telescope of the Observatoire de Haute-Provence (OHP). The detector was a 20481024 CCD EEV 42-20#3, whose pixel size is (13.5m)2. The exact wavelength ranges and mean S/N are given in Table 1, together with the dispersion. All the data were reduced in the standard way using the MIDAS software developed at ESO. The spectra were normalized by fitting splines through carefully chosen continuum windows, the same as the ones used in Paper I.
| Date | Wav. range | S/N | Disp. | ||
|---|---|---|---|---|---|
| (Å mm-1) | |||||
| Sep. 2001 | 3680-4130 | 2 | 160 | 16 | 7000 |
| Sep. 2001 | 4080-4540 | 2 | 160 | 16 | 7000 |
| Sep. 2001 | 4450-4900 | 6 | 200 | 16 | 7000 |
| Sep. 2001 | 6350-6760 | 2 | 360 | 16 | 11000 |
| Sep. 2002 | 4450-4905 | 2 | 250 | 16 | 7000 |
| Sep. 2002 | 6350-6760 | 1 | 260 | 16 | 11000 |
| Oct. 2003 | 4450-4915 | 5 | 40-350 | 16 | 7000 |
| Oct. 2003 | 6350-6750 | 1 | 300 | 16 | 11000 |
3 HD 108
3.1 Latest optical data
After a reduction consistent with that of the data from previous years (see Paper I), we found that HD 108 had still not reached its minimum emission stage. The H i, He i, Si iii, and C iii lines continued to decline. The average equivalent widths111In Table 5 of Paper I, the EW of H should be read Å in 1987 and 1.490.07Å in 2000. (EWs) were 1.660.02Å in 2001 for the H line; 1.020.03Å in 2001, 1.110.01Å in 2002 and 1.220.04Å in 2003 for He i 4471; 0.720.01Å in 2001, 0.720.02Å in 2002 and 0.720.04Å in 2003 for He ii 4542; 2.010.03Å in 2002 and 2.080.12Å in 2003 for H. We show in Fig. 3 the evolution of the EWs with time: the changes are striking. We also note that the H line may now also present variations on a shorter timescale: in 2001 and 2003, the absorption apparently increased in the last spectra of the runs. The spectral type of the star has also continued to change through the years, as we had predicted in Paper I: it was O8Ifpe in 2001-2002 and O8.5fpe in 2003.


In 1997, 2001, 2002 and 2003, we also obtained spectra of HD 108 in a region containing the H line. This line too underwent dramatic variations, as is shown in Fig. 4: its EW changes from -5.34Å in 1997 to -1.37Å in 2003! The profile is now asymetric, with a small absorption in the blue wing. We can use this H EW to estimate the mass-loss rate of the star (Lamers & Leitherer lam93 (1993)). But first, we have to correct the observed EW for photospheric H i and He ii absorptions. To this aim, we decided to use the observed H EW of O8I and O8.5I stars listed in Conti (con (1974)). However, the only value available in Conti’s paper, 2.91Å, is that of HD 167771, which is currently known to be a binary star. Since this could affect the determination of the EW of its H line, we rather use the average EW as measured by Conti (con (1974)) on the spectra of single O7-9.5I stars (HD 34656, HD 163800, HD 16429, HD 218915). This value is 3.06Å. Using the method outlined in Lamers & Leitherer (lam93 (1993)) with the physical parameters appropriate to HD 108 (see Sect. 3.2.1), an observed V magnitude of 7.4 and color (B-V) of 0.18 mag (see Paper I), we then find that the mass-loss rate varies from -5.4 to -5.5 between 1997 and 2003, whatever the photospheric EW correction chosen. These values of are in between the extreme estimations from the literature (see below). Note however that the method of Lamers & Leitherer (lam93 (1993)) assumes that the stellar wind is spherically symmetric and homogeneous. The former hypothesis might not be valid in the case of HD 108 (see discussion below).
In 2001, we observed HD 108 in the violet range between 3680 and 4130 Å. No O iii 3755,3760 emission was detected. These lines would be seen in emission if the N iii 4634,4640 emissions were produced through a Bowen mechanism involving the O iii and N iii transitions at 374Å. But since these O iii lines are on the contrary in absorption, this mechanism is clearly not at work in the wind of HD 108. The N iii emission lines are then most probably explained by a combination of the processes described in Mihalas (mih (1973)), i.e. excitation of certain autoionising states of N iii followed by dielectronic recombinations (Mihalas mih (1973)) and pumping of adequate N iii transitions by the intense continuum radiation of the star in an expanding atmosphere (Swings swi (1948)).
3.2 X-ray data analysis
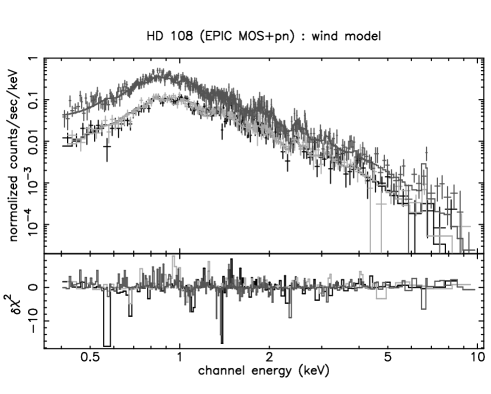
EPIC spectra and lightcurves of HD 108 were extracted over a circular region centered on the star and of radius 50″ for MOS and 375 for pn (because of the presence of a gap nearby). Since a fainter source is present near HD 108, we did not choose an annular background region, but rather a nearby circle devoid of sources. The EPIC lightcurves did not present any significant variation. The spectra of each instrument were fitted separately in XSPEC, but as they gave the same properties, within the errors, we decided to fit simultaneously all EPIC data available. We fixed the interstellar absorbing column to cm-2 (Diplas & Savage dip (1994)). The best fit was then obtained with a sum of two absorbed optically thin plasma models (, Kaastra kaa92 (1992)) of temperatures 0.2 and 1.4 keV (see Fig. 5). A fit by a differential emission measure model (, Sing et al. sin (1996)) does not improve the quality of the fit but confirms the existence of two dominant temperatures. We note the presence, at 6.6 keV, of the Fe K-line.
| Abs. | Column1 | Column2 | Flux | Unabs. Flux | (d.o.f.) | ||||
|---|---|---|---|---|---|---|---|---|---|
| 1022 cm-2 | keV | cm-3 | 1022 cm-2 | keV | cm-3 | 10-13 erg cm-2 s-1 | |||
| 0.51 | 0.20 | 9.41056 | 1.30 | 1.37 | 6.91055 | 6.85 | 15.7 | 1.18 (852) | |
| 0.54 | 0.26 | 3.71056 | 1.26 | 1.54 | 5.81055 | 7.00 | 17.6 | 1.15 (852) | |
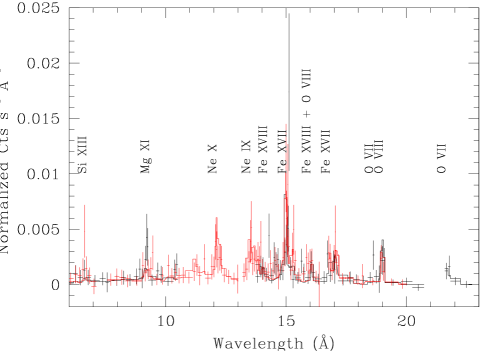
Figure 6 shows the first order RGS1 and RGS2 spectra of HD 108. Unfortunately, the signal to noise ratio of individual lines is not sufficient to perform a detailed quantitative analysis of the RGS line spectrum of HD 108. However, the emission lines that are seen in these spectra clearly indicate that the low energy (2 keV) X-ray emission arises in a thermal plasma. We identified the strongest emission lines by comparison with the line list of the SPEX plasma code (Kaastra et al. kaa02 (2002)). The temperatures of maximum emissivity of the lines seen in the RGS spectra span a range from to K. These values are compatible with the temperatures obtained with the spectral fits of the EPIC data. We therefore included the RGS data in a simultaneous fit of all the X-ray data of HD 108 and the results are presented in Table 2. Unlike the cases of Pup (Kahn et al. Kahn (2001)) and 9 Sgr (Rauw et al. 2002a ), almost no lines are seen above Å, where the spectrum is heavily absorbed by circumstellar and interstellar material.
3.2.1 Wind modelling
The material in the stellar winds of early-type stars is ionised by the stellar radiation. Several authors (e.g. Krolik & Kallman kro (1984), Waldron wal84 (1984)) have demonstrated that a comprehensive study of the X-ray throughput from massive stars requires a detailed modelling of the opacity from such an ionised wind. We have thus attempted to model the wind opacity of HD 108.
We have considered the 10 most abundant elements (H, He, C, N, O, Ne, Mg, Si, S, Fe) and fixed their abundances to the solar ones (Anders & Grevesse and (1989)). In our model, the collisional excitation, the photoionisation and the radiative and dielectronic recombinations determine the ionisation of the elements. Collisional excitation rates were taken from Voronov (vor (1997)), and the photoionisation cross sections from Verner et al. (ver96 (1996)) for the outer shells and Verner & Yakovlev (ver95 (1995)) for the inner shells. Since innershell ionisation can lead to the ejection of several electrons, we used the Auger yields from Kaastra & Mewe (kaa93 (1993)) to model this effect for the elements considered. Radiative and dielectronic recombination rates were taken from Verner & Ferland (verfer (1996)) and Shull & Van Steenberg (shu (1982)), taking into account the corrections from Arnaud & Rothenflug (arn (1985)) for the latter reference.
We determined the ionisation structure of the stellar wind up to 300 stellar radii (with a logarithmic spatial bin from 5 to 321 ), using the approximations of Waldron (wal84 (1984)) for the radiation field (his eq. 12) and the opacities (his eqs. 13 & 14). However, we chose to fix the velocity law and the wind temperature to and (with , 0.4, see Lamers & Morris lam94 (1994)), respectively. The stellar parameters needed in these equations were taken from several sources: Howarth & Prinja (how89 (1989)) and Peppel (pep (1984)) give , and kK, while Howarth et al. (how97 (1997)) quote km s-1. In addition, note that the stellar flux was taken from Kurucz’s library of spectra for the above effective temperature and =4.5 (the closest value available) and that we modelled the local emission as a simple blackbody at .
There is no consensus in the litterature about the mass-loss rate of HD 108: values from 210yr-1 (Hutchings & Von Rudloff hut (1980)) to 510yr-1 (Ferrari-Toniolo et al. fer (1981)) can be found. On the other hand, using the H line EW as measured on our spectra from 1997-2002, we found an intermediate value (see above). To test the effects of changing mass-loss rates on the wind ionisation, we decided to run our model for the two extreme mass-loss rates, and in the rest of the paper, we will refer to these models as ‘wind-low’ and ‘wind-high’, respectively.
We show in Fig. 7 the resulting wind optical depth for both models at five stellar radii, compared to the interstellar one. If we scale the optical depth at any radius r in the wind by , we find that the resulting opacity is very similar whatever the radius or the mass-loss rate considered in the model. We thus implemented a unique wind opacity model in XSPEC (we chose the wind-high opacity at 5 ) and then tried to fit the XMM-Newton spectra using this absorbing model. The results are presented in Table 2. We see that within the errors, the absorbing columns are very similar compared to the case of neutral gas. The temperatures are slightly larger and the Emission Measures (s) lower, compared to the case of the neutral gas, but the value is just slightly lower. For an ionised wind, the two fitted columns correspond respectively to positions in the wind at 86 and 37 for the largest (510yr-1), or 7 and 3 , i.e. relatively close to the star, for the intermediate one (3.510yr-1, a value appropriate for the epoch of the XMM-Newton observation if the wind is spherically symmetric, as assumed in our model). Note that such high columns could not be reached with a low value of the mass-loss rate like 210yr-1. Such a low mass-loss rate actually produces a much lower optical depth than the interstellar matter (see Fig. 7). The absorption by such a wind would thus not lead to a significant signature at soft X-ray energies, contrary to what is observed: very low mass-loss rates are not compatible with the X-ray data.

3.3 Comparison with previous X-ray observations
The XMM-Newton observatory is actually not the first to detect HD 108 in X-rays. The star had already been observed twice in the last 25 years. In January 1979, during a 1800 s exposure, the satellite detected an X-ray source, 2E0003.4+6324, at the position of HD 108. The IPC count rate for this source was 2.80.5 10-2 cts s-1 (2E catalog, Harris et al. har (1994)) or 3.20.6 10-2 cts s-1 (Chlebowski et al. chl (1989)). Twelve years later, ROSAT reobserved this region during 558 s in the course of the All-Sky Survey. This time, the X-ray counterpart of HD 108 was named 1RXS J000605.0+634039 (Voges et al. vog99 (1999)) and presented a count rate of 6.11.3 10-2 cts s-1.
Using the spectral properties of Table 2, we can predict the count rates expected with the IPC and PSPC_C instruments if these properties have not changed since then. Whatever the absorption model, the XMM-Newton data convert into an IPC count rate of 2.60.5 10-2 cts s-1 and a PSPC_C count rate of 4.82.9 10-2 cts s-1. The observed count rates are thus compatible, within the errors, to what could be expected on the basis of the XMM-Newton data: we observe at most a marginal decrease of the flux. Contrary to the optical domain, there is thus apparently no dramatic change at the X-ray energies on a timescale of decades.
3.4 The nature of HD 108
Before we consider the various models for HD 108, let us first highlight the most important results of our XMM-Newton investigation. The XMM-Newton observations of HD 108 have revealed a thermal spectrum, of characteristic temperatures 0.2 and 1.4 keV. Moreover, the X-ray flux of HD 108 appears rather stable on both short timescales (of the order of the observation length) and longer ones (of the order of decades).
To better understand the nature of the system, we can first compare the X-ray luminosity of HD 108, corrected for the interstellar absorption, to its bolometric luminosity. In the ROSAT band (0.1-2.0 keV), we find , whereas we would expect a value of from the relations of Berghöfer et al. (ber (1997)). HD 108 is thus slightly overluminous in X-rays, with a factor of 4 between the expected and observed luminosities. But this difference is not as large as e.g. in some colliding-wind binaries, and our observed ratio is in fact just at the upper limit of the dispersion of the data of Berghöfer et al. relations were also studied more recently by Moffat et al. (mof (2002)) in the 0.510 keV energy range, using the data of NGC 3603: HD 108 is then again amongst the stars at the upper limit of the dispersion.
The emission measure () of the entire wind (assuming spherical symmetry) is . For the intermediate mass-loss rate 3.5 10-6M⊙ yr-1 and with , we find cm-3. By comparing this value to the fitted s (see Table 2), we can derive the volume filling factor of the hot gas. It is approximately for the lower temperature component and 10-4 for the higher temperature one. These filling factors are in agreement with values derived by Kudritzki et al. (kud (1996)) or Feldmeier et al. (fel (1997)) for other early-type stars. However, we may note that for the largest considered above, the factor would be 200 times lower and become, then, more difficult to reconcile with current X-ray emission theories and observations.
3.4.1 A binary system with a compact object
In Paper I, we had proposed that HD 108 could be an eccentric binary consisting of the Of star and a compact object with an orbital period of several decades. In such a system, the compact object could accrete matter from its companion near periastron. At that moment, if the X-ray luminosity produced by wind accretion becomes sufficient, the ionisation structure of the O-star wind could be severely altered, and e.g. elements like hydrogen and helium could become completely ionised. The wind emissions of H i and He i would thus disappear, thereby explaining the observed optical line variations. In such a model, we would expect in the XMM-Newton observation (1) a large X-ray luminosity capable of affecting the ionisation of the wind and (2) large variations of the X-ray flux, on orbital timescales, correlated with the modulation of the optical emissions. However, the XMM-Newton observation revealed a completely different behaviour. The ISM-corrected X-ray luminosity measured by XMM-Newton is rather modest ( erg s-1 in the 0.4-10 keV energy range) and appeared stable compared to previous X-ray observations made in the last 20 years. It is true that the ionisation of the wind can alter its radiative line driving, thereby modifying the mass-loss rate and thus probably the X-ray emission, but a constant X-ray luminosity could then only be explained by a delicate equilibrium between the changing wind absorption and the varying emission measure, which is unlikely.
Let us consider what would be required to produce a change in the ionisation of the stellar wind as suggested by the optical data. Tarter et al. (tar (1969)) found that the ionisation equilibrium in a stellar wind illuminated by an X-ray source depends mainly on the parameter , where is the X-ray luminosity, the local number density, and the distance to the X-ray source. Hatchett & Mc Cray (hat (1977)) futher introduced a dimensionless parameter , where is the number density at the position of the X-ray source and the orbital separation between the primary star and the X-ray source. Interestingly, is essentially set by the velocity law of the stellar wind. The changes in the intensity of H i and He i emissions in the optical spectrum of HD 108 suggest that the properties of the wind are changing over a large volume. Therefore, the results of Hatchett & McCray (hat (1977), their Figs. 1 & 2) indicate that should be about . Considering a number of different situations, Kallman & McCray (kal (1982)) found that at the transition between neutral and ionised H and He should be in the range 1.0 to 1.5 depending on the wind density and the spectral properties of the X-ray source. These considerations suggest that .
On the other hand, the X-ray luminosity due to wind accretion onto a neutron star can be estimated from Davidson & Ostriker (dav (1973)) as a function of the orbital separation . Although we have shown that the X-ray spectrum of HD 108 can be described by an optically thin thermal plasma model, and this is not the kind of spectral shape expected for an accretion-powered X-ray emission, let us assume for the moment that the intrinsic of HD 108 could entirely be assigned to the accretion by the compact companion. After dereddening the spectra by both interstellar and circumstellar absorptions, we get 1034 erg s-1 in the 0.4-10. keV energy range. These values correspond to orbital separations222These orbital separations correspond to orbital periods of 1625 days if the orbit was circular (although this is unlikely to be the case for HD 108). of for 3.5 10-6M⊙ yr-1, and this results in .
The intrinsic X-ray luminosity of HD 108 as determined with XMM-Newton is thus probably not sufficient to significantly alter the ionisation of the stellar wind and hence trigger the changes seen in the optical spectrum. We note however that a low X-ray luminosity does not completely rule out the presence of a compact companion, since the wind accretion process can be inhibited under certain circumstances (Stella et al. ste (1986)), but that, if present, the physical conditions are such that this companion cannot explain the optical variations.
3.4.2 A confined wind model
A second type of model proposed is a rapid rotator with a shell and/or disc and/or jets (e.g. Walborn et al. wal03 (2003)). If a disc is present in the system, it can only be seen nearly face-on: no double-peaked profiles have ever been reported for HD 108 and spectropolarimetric studies also favor a face-on geometry. Since there is no modulation of the optical data on timescales of a few days that could be associated with the rotation of the star, the rotation and disc axes need to be nearly aligned. In such a system, long-term optical variations could result from precession effects e.g. in a wide binary, but no change in the width of the lines, and hence of , is detectable in our spectra.
The formation of a confined outflow could be linked to the presence of a strong magnetic field confining the wind towards the equatorial regions of the star. Such a magnetically confined wind could provide a straightforward explanation for the hard X-ray component seen in the EPIC spectra of HD 108. Models of such confined winds predict a strong shock at the interface between the winds that are deviated from both hemispheres and the equatorial disc (see e.g. Babel & Montmerle bab (1997), ud-Doula ud (2002)). A change in the overall mass-loss rate could easily account for the changes of the intensity of optical recombination emission lines such as H but would also imply a change of the total wind emission measure proportional to which should then lead to a significant correlated variation of the X-ray luminosity that is not observed.
3.4.3 Other models and summary
Another model associates HD 108 with transition objects (Paper I, Walborn et al. wal03 (2003) and references therein) such as Ofpe/WN9 stars or Luminous Blue Variable stars (LBVs). No particular characteristics in the XMM-Newton data argue in favor of such a model, but these data do not provide arguments against either. However, as in the previous model, it is difficult to understand why a tremendous change in the wind structure where emission lines arise is not correlated with a similar dramatic variation at the wind position where the X-ray emission takes place.
Finally, we note that the second plasma temperature ( keV)
is rather high. Most single O-type stars display thermal X-ray emission
with keV and higher temperature emission is often attributed
to a colliding wind phenomenon in a binary system.
A colliding wind scenario in a wide (eccentric)
O+O binary could also account for the slight X-ray overluminosity of HD 108.
However, it is not clear how the changes in the optical spectrum could
be related to this scenario. Also, we emphasize that there is no
obvious evidence for such a binary system in the
spectrum of HD 108.
All models are now challenged by the XMM-Newton observations. Their context does not permit us to understand how the large variations seen in the optical domain could lead to a stable X-ray luminosity. This apparent dichotomy could well be explained by a difference in the formation region of the X-ray emission and the H i/He i emissions, e.g. X-rays could arise in a disc while the emission lines could be formed in a jet, but it is difficult to reconcile this with the fact that a change in any physical parameter of the star would affect only one of the two features. For example, an increase in the mass-loss rate could only lead to a stable X-ray luminosity if the resulting additional X-ray absorption and emission of the wind compensate exactly. Such a delicate balance between emission and absorption was invoked by Owocki & Cohen (owo (1999)) to explain the empirical relation of O-type stars. This formalism holds for a mass-loss driven by radiation pressure. However, since no large changes of the magnitude of HD 108 have been reported, it seems unlikely that a change in the mass-loss rate of the star could be triggered by a change in the overall luminosity and it seems therefore excluded that the mechanism of Owocki & Cohen could explain the lack of X-ray variability of HD 108. More than ever, HD 108 is a puzzle for astronomers.
4 X-ray sources in the field
4.1 List of sources
The X-ray data of HD 108 also reveal a lot of additional point sources in the field surrounding the O star, as can be appreciated in Fig. 1. To study these discrete X-ray sources, we applied the detection metatask edetect_chain simultaneously to the data from the three EPIC cameras. We used three energy bands: S=0.4-1.0 keV, M=1.0-2.0 keV and H=2.0-10.0 keV. We eliminated the false detections mainly due to background fluctuations by rejecting the sources with a likelihood in any detector and/or a combined likehood . This procedure left 58 point sources in the field. They are shown in Fig. 2 and their properties are presented in Table 3, by order of increasing RA.
Their background-subtracted and vignetting-corrected count rates in each of the EPIC cameras are also presented in this table. Note that the SAS detection tasks do not apply a correction for out-of-time events or dead times. For the EPIC pn data used in extended full frame mode, this implies an overestimate of the exposure time (and thus an underestimation of the count rates) by 2.3%. Since this amount is well within the errors, we choose not to correct the pn count-rates provided by edetect_chain. The sensitivity limit is 0.6 cts s-1 for EPIC MOS data and 1.6 cts s-1 for EPIC pn data. The hardness ratios for the pn data are also indicated in Table 3. The hardness ratios are defined as and , where , , and correspond to the count rates in the 0.4-1.0, 1.0-2.0 and 2.0-10.0 keV band, respectively. As was already visible from Fig. 1, most of the sources are very hard, probably due to the large absorbing column in the Galactic plane where HD 108 lies (, ).
4.2 Identification
We have compared our source list to the ROSAT detections in the same field. Four catalogs are available: the WGA catalog (White et al. wga (2000), PSPC) and three catalogs from the ROSAT teams (1RXH and 2RXP, ROSAT consortium rxh (2000)a and rxp (2000)b; 1RXS, Voges et al. vog99 (1999) & vog00 (2000)). Only one source, 1RXS J000605.0+634039, was previously known in the field. It is at 137 from XMMU J000603.2+634046 (#37) and at 133 from HD 108. Although this distance is slightly larger than the positional error of the ROSAT source, 11″, there is little doubt that the ROSAT source corresponds to HD 108, since there is no other bright XMM-Newton source in the region.
To search for optical counterparts, we have cross-correlated our source list with the Simbad catalog, the 2MASS All-Sky Data Release, the USNO B1.0 and the GSC 2.2 catalogs. To determine an optimal radius of correlation, we adopted the method of Jeffries et al. (jef (1997)) as used in Rauw et al. (2002b ), i.e. fitting the cumulative distribution of the number of detected sources as a function of the correlation radius by expression (1) of Jeffries et al. (jef (1997)). The optimal correlation radius333Strictly speaking, a unique correlation radius cannot be used with XMM-Newton data, since the point spread function is degrading at large off-axis angles. The radius found here should be considered as a weighted average., i.e. the radius that includes the maximum of true correlations and the minimum of spurious correlations, is found to be around 2″. We list the counterparts to the X-ray sources found this way in Table 3, together with the separation between the X-ray and the visible sources, and some basic information about the visible sources.
Source XMMU J000428.5+633121 (# 7) is actually extended, as can be seen from comparison with the shape of the neighbouring sources (see Figs. 1 and 2). This source is not associated with any GSC/2MASS/USNO counterpart: with its rather large HR, it may be an extragalactic source.
The source XMMU J000643.6+633912 (# 48) corresponds to BD+62∘2368, an F7V star. If we compare the observed colors of this star (with , listed in Simbad and , , from the 2MASS catalog) to typical colors of an F7V star (Schmidt-Kaler sch (1982), Kenyon & Hartmann ken (1995), Bessell & Brett bes (1988)), we can estimate its reddening and its probable distance. Using the reddening law from Cardelli et al. (car (1989)) with 3.1, we found an in the range 0.02-0.07, and a distance of 181-193 pc.
The source XMMU J000623.9+633927 (#40) also correlates with a bright star, BD+62∘2365, but no spectral type has been quoted for this star in the literature so far. However, its 2MASS colors and a visible spectrum obtained at OHP in Oct. 2003 apparently favor a G2III spectral type for this star. In a similar manner as above, we derived for this object a reddening and a distance of 540 pc.
On the other hand, several sources listed in Table 3 present rather high HRs. This result does not appear completely surprising in the light of the relations of Mushotzky et al. (mus (2000)) and Giacconi et al. (gia (2001)), since these relations predict that a large fraction of the detected sources should correspond to extragalactic objects even accounting for a total Galactic column density of 0.5 cm-2 along the line of sight444We estimated this value from the extinction map of Schlegel et al. (schle (1998)). These authors caution that their maps may not be accurate for Galactic latitudes below , but they can nevertheless provide a first estimate of the total extinction.. Finally, there are a few known early-type stars in the field in addition to HD 108 and EM* CDS 1: BD+62∘2362 (B7III), ALS 6022 (B9III), ALS 6028 (B), EM* CDS 3 (B), BD+62∘2369 (A5V) and BD+63∘2105 (A9II). None of them is detected in X-rays, but such late B and A stars are usually not bright X-ray emitters. We may also note the non-detection in X-rays of the variable star SV*SVS1455 and of the relatively bright ALS 6011 (F5I).
4.3 Variability
We have analysed the lightcurves of the 8 brightest point sources (i.e. with at least 50 cts in EPIC MOS and 100 cts in EPIC pn in the 0.4-10.0 keV range). The count rates in each bin were background-subtracted using annuli around the sources or close-by circles. The effective time bin lengths were calculated by taking into account the ‘good time intervals’ defined in Sect. 2. The resulting lightcurves were analysed by Kolmogorov-Smirnov and tests. We also ran a modified probability of variability test (Sana et al. san (2003)) on these sources’ event lists. In the HD 108 field, no source was found significantly variable over the duration of our observation.
| # | Name | Crate MOS1 | Crate MOS2 | Crate PN | HR1 | HR2 | GSC | 2MASS | USNO | ||||||||
|---|---|---|---|---|---|---|---|---|---|---|---|---|---|---|---|---|---|
| 10-3 cts s-1 | 10-3 cts s-1 | 10-3 cts s-1 | Nr | d(”) | R | B | Nr | d | J | H | K | Nr | d(”) | ||||
| 1 | XMMU J000405.7+633408 | 23.52.1 | 0.610.08 | -0.040.10 | 0 | 0 | 0 | ||||||||||
| 2 | XMMU J000410.6+633939 | 1.020.45 | 1.830.58 | 3.210.94 | 0.890.21 | -0.170.32 | 0 | 0 | 0 | ||||||||
| 3 | XMMU J000414.7+633815 | 2.610.62 | 2.350.62 | 3.270.99 | 0.680.35 | 0.080.30 | 0 | 0 | 0 | ||||||||
| 4 | XMMU J000417.7+633449 | 18.61.7 | 37.12.5 | 0.950.07 | 0.550.05 | 0 | 1 | 1.7 | 17.9 | 16.2 | 15.2 | 0 | |||||
| 5 | XMMU J000419.7+634042 | 4.250.71 | 3.960.67 | 9.291.17 | 0.590.19 | 0.330.11 | 0 | 0 | 0 | ||||||||
| 6 | XMMU J000420.8+633920 | 1.680.55 | 1.840.51 | 3.370.77 | 0.830.37 | 0.350.20 | 0 | 0 | 0 | ||||||||
| 7 | XMMU J000428.5+633121a | 18.92.5 | 0.720.12 | -0.200.15 | 0 | 0 | 0 | ||||||||||
| 8 | XMMU J000433.3+634415 | 0.950.36 | 4.090.65 | 4.300.82 | 0.930.18 | 0.210.17 | 0 | 0 | 0 | ||||||||
| 9 | XMMU J000440.1+633219 | 1.850.65 | 1.530.58 | 2.240.92 | -0.760.47 | 0.820.37 | 1 | 0.9 | 14.4 | 15.9 | 1 | 0.9 | 12.7 | 12.1 | 11.9 | 1 | 0.7 |
| 10 | XMMU J000441.8+633536 | 1.980.45 | 1.350.37 | 6.450.89 | -0.350.13 | -0.350.29 | 1 | 0.6 | 14.6 | 16.2 | 1 | 0.3 | 13.3 | 12.8 | 12.6 | 1 | 0.8 |
| 11 | XMMU J000444.1+633738 | 1.250.33 | 3.580.59 | -0.040.16 | -1.000.23 | 1 | 0.7 | 14.5 | 15.2 | 1 | 0.6 | 13.3 | 12.8 | 12.7 | 1 | 0.9 | |
| 12 | XMMU J000445.1+633550 | 9.980.95 | 10.11.0 | 20.61.5 | 0.880.09 | 0.460.06 | 0 | 0 | 0 | ||||||||
| 13 | XMMU J000448.0+634126 | 1.140.34 | 1.550.39 | 2.280.59 | -0.140.44 | 0.630.22 | 0 | 0 | 0 | ||||||||
| 14 | XMMU J000457.6+634211 | 3.650.47 | 5.270.60 | 12.41.0 | 0.830.08 | 0.040.08 | 0 | 1 | 1.1 | 16.8 | 15.5 | 14.8 | 0 | ||||
| 15 | XMMU J000502.1+633844 | 1.740.52 | 0.560.36 | 0.080.30 | 0 | 0 | 0 | ||||||||||
| 16 | XMMU J000503.4+634744 | 1.060.31 | 1.810.36 | 1 | 0.9 | 16.2 | 18.6 | 1 | 0.8 | 13.5 | 12.9 | 12.7 | 0 | ||||
| 17 | XMMU J000506.8+633453 | 0.860.36 | 1.230.41 | 1.900.59 | 0.390.39 | 0.190.30 | 0 | 0 | 0 | ||||||||
| 18 | XMMU J000510.1+634733 | 2.140.39 | 2.420.41 | 0 | 1 | 1.3 | 14.9 | 14.3 | 13.9 | 1 | 1.9 | ||||||
| 19 | XMMU J000511.7+634018 | 7.380.60 | 7.130.58 | 0 | 0 | 0 | |||||||||||
| 20 | XMMU J000525.6+634549 | 0.880.24 | 0.760.25 | 2.700.54 | -0.050.21 | -0.090.26 | 1 | 1.1 | 12.0 | 1 | 1.1 | 11.1 | 11.0 | 11.0 | 1 | 1.1 | |
| 21 | XMMU J000535.5+633914 | 0.520.22 | 0.900.23 | 0 | 0 | 0 | |||||||||||
| 22 | XMMU J000536.5+633728 | 0.630.23 | 0.760.25 | 1.690.40 | 0.500.26 | -0.280.27 | 0 | 0 | 0 | ||||||||
| 23 | XMMU J000537.1+634027 | 6.180.52 | 7.190.52 | 0 | 0 | 0 | |||||||||||
| 24 | XMMU J000537.9+633034 | 6.930.81 | 6.510.83 | 16.21.3 | 0.400.11 | 0.280.07 | 0 | 0 | 0 | ||||||||
| 25 | XMMU J000539.6+633108 | 1.180.41 | 0.970.30 | 3.860.75 | -0.660.16 | -0.390.65 | 1 | 0.4 | 12.1 | 1 | 0.4 | 10.8 | 10.6 | 10.5 | 1 | 0.4 | |
| 26 | XMMU J000541.5+633711 | 0.680.23 | 0.440.19 | 1.600.41 | 0.350.48 | 0.390.23 | 0 | 0 | 0 | ||||||||
| 27 | XMMU J000542.6+633834 | 1.180.28 | 1.480.28 | 1 | 0.8 | 15.5 | 16.6 | 1 | 0.5 | 14.2 | 13.9 | 13.8 | 1 | 0.7 | |||
| 28 | XMMU J000542.7+634125 | 0.590.20 | 0.480.19 | 1.480.38 | 0.510.53 | 0.480.23 | 0 | 0 | 0 | ||||||||
| 29 | XMMU J000544.6+633444 | 1.220.30 | 0.630.28 | 0 | 0 | 0 | |||||||||||
| 30 | XMMU J000546.5+632831 | 1.250.57 | 1.460.56 | 2.990.94 | 0.0020.36 | 0.180.36 | 0 | 0 | 0 | ||||||||
| 31 | XMMU J000547.7+633955 | 1.520.28 | 1.240.26 | 0 | 0 | 0 | |||||||||||
| 32 | XMMU J000551.7+634304 | 0.750.17 | 0.560.20 | 1.130.34 | -0.670.25 | -1.001.83 | 1 | 2.0 | 12.4 | 14.3 | 1 | 1.7 | 10.4 | 9.7 | 9.5 | 0 | |
| 33 | XMMU J000553.6+634533 | 0.900.20 | 0.890.23 | 1.620.44 | 0.530.47 | 0.330.25 | 1 | 1.0 | 17.3 | 18.2 | 1 | 0.8 | 15.7 | 15.5 | 15.5 | 1 | 1.3 |
| 34 | XMMU J000558.0+633710b | 1.480.28 | 3.670.39 | 6.210.61 | 0.620.12 | 0.010.10 | 0 | 0 | 0 | ||||||||
| 35 | XMMU J000558.7+635208 | 1.550.38 | 1.240.40 | 0 | 0 | 0 | |||||||||||
| 36 | XMMU J000559.5+634149 | 1.040.23 | 0.990.24 | 3.250.48 | 0.530.21 | 0.000.15 | 0 | 0 | 0 | ||||||||
| 37 | XMMU J000603.2+634046c | 99.91.8 | 105.2. | 333.4. | -0.100.01 | -0.500.01 | 1 | 0.7 | 7.5 | 1 | 0.7 | 6.9 | 6.9 | 6.8 | 1 | 0.7 | |
| 38 | XMMU J000606.4+633347 | 1.170.29 | 1.220.31 | 2.120.50 | -0.650.19 | -1.001.34 | 0 | 0 | 0 | ||||||||
| 39 | XMMU J000621.9+634321 | 0.680.21 | 0.570.20 | 0.880.33 | 1.000.73 | 0.510.32 | 0 | 0 | 0 | ||||||||
| 40 | XMMU J000623.9+633927d | 2.060.28 | 2.200.32 | 9.510.70 | -0.470.06 | -0.760.15 | 1 | 1.1 | 9.7 | 1 | 0.7 | 8.3 | 7.8 | 7.7 | 1 | 0.8 | |
| 41 | XMMU J000624.8+633737 | 1.540.29 | 1.330.27 | 3.770.53 | 0.720.31 | 0.510.12 | 0 | 0 | 0 | ||||||||
| 42 | XMMU J000629.5+634106 | 1.020.26 | 1.300.27 | 2.930.53 | 0.050.19 | -0.250.23 | 1 | 0.5 | 14.6 | 15.5 | 1 | 0.4 | 12.8 | 12.3 | 12.2 | 1 | 0.2 |
| 43 | XMMU J000632.3+634127 | 0.680.23 | 0.530.18 | 2.470.48 | 0.500.24 | -0.170.21 | 0 | 0 | 0 | ||||||||
| 44 | XMMU J000638.4+634902 | 0.730.29 | 0.670.27 | 2.250.58 | -0.160.23 | -0.540.49 | 1 | 1.5 | 14.2 | 16.0 | 1 | 0.4 | 13.8 | 13.2 | 13.0 | 3 | |
| 45 | XMMU J000639.8+633627 | 1.550.31 | 1.070.28 | 3.330.52 | 0.680.25 | 0.360.13 | 0 | 0 | 0 | ||||||||
| 46 | XMMU J000640.1+634255 | 0.630.21 | 0.740.21 | 2.000.46 | 0.320.28 | 0.020.25 | 0 | 0 | 0 | ||||||||
| 47 | XMMU J000642.9+633308 | 0.670.33 | 1.070.38 | 3.390.69 | 0.310.24 | 0.140.21 | 0 | 0 | 0 | ||||||||
| 48 | XMMU J000643.6+633912e | 2.950.31 | 2.550.31 | 13.50.1 | -0.760.04 | -1.000.07 | 1 | 1.8 | 10.9 | 1 | 1.7 | 9.3 | 9.1 | 9.1 | 1 | 1.8 | |
| 49 | XMMU J000644.2+633739 | 1.480.30 | 4.470.60 | 0.630.17 | -0.030.14 | 0 | 0 | 0 | |||||||||
| 50 | XMMU J000647.2+633602 | 0.780.29 | 0.630.25 | 1.000.40 | 1.000.55 | -0.170.38 | 0 | 0 | 0 | ||||||||
| 51 | XMMU J000647.5+634947 | 1.190.38 | 1.200.35 | 1.210.52 | 0.970.31 | -0.520.51 | 0 | 0 | 0 | ||||||||
| 52 | XMMU J000658.1+633221 | 3.110.65 | 2.850.53 | 7.021.01 | -0.710.45 | 0.970.04 | 0 | 0 | 0 | ||||||||
| 53 | XMMU J000701.3+635130 | 4.381.25 | 5.120.73 | 0 | 0 | 0 | |||||||||||
| 54 | XMMU J000701.7+634151 | 7.990.62 | 8.330.63 | 24.01.3 | 0.950.08 | 0.710.03 | 0 | 0 | 0 | ||||||||
| 55 | XMMU J000705.7+634447 | 1.180.25 | 1.660.33 | 0 | 0 | 0 | |||||||||||
| 56 | XMMU J000707.8+634721 | 0.890.29 | 1.030.34 | 1.550.62 | 0.270.42 | -0.040.47 | 0 | 0 | 0 | ||||||||
| 57 | XMMU J000713.2+633439 | 1.980.44 | 1.390.40 | 5.730.88 | 0.550.22 | 0.280.14 | 0 | 0 | 0 | ||||||||
| 58 | XMMU J000718.8+633857 | 1.690.37 | 1.060.32 | 3.010.64 | -0.660.17 | -0.440.69 | 1 | 1.5 | 16.0 | 18.3 | 1 | 1.6 | 13.2 | 12.5 | 12.3 | 1 | 1.6 |
a Extended source
b The emission-line star EM* CDS 1 (B-type) is at 85 from this source.
c = HD 108 (the X-ray position is at 08 from the optical one given in Simbad).
d = BD+62∘2365 (spectral type G2III, see text)
e = BD+62∘2368 (spectral type F7V)
4.4 Spectral properties
| # | Absorbed model | Absorbed power-law model | |||||||
|---|---|---|---|---|---|---|---|---|---|
| Flux | (d.o.f.) | Flux | (d.o.f.) | Var. ? | |||||
| 1022 cm-2 | keV | 1022 cm-2 | keV | ||||||
| 12 | 1.27 | 3.29 | 1.06 | 0.83 (74) | 1.19 | 2.06 | 1.16 | 0.83 (74) | N |
| 14 | 0.64 | 3.43 | 0.60 | 0.91 (65) | 0.84 | 2.42 | 0.58 | 0.90 (65) | N |
| 19 | 0.02 | 82 | 1.08 | 0.62 (47) | 0. | 1.11 | 1.18 | 0.60 (47) | ? |
| 23 | 0.23 | 42 | 1.03 | 1.04 (52) | 0.29 | 1.40 | 1.01 | 1.03 (52) | N |
| 40 | 0.61 | 0.23 | 0.13 | 0.79 (51) | 1.20 | 10 | 0.13 | 0.96 (51) | N |
| 48 | 0. | 0.39 | 0.20 | 1.47 (62) | N | ||||
| 54 | 1.63 | 19 | 1.72 | 0.74 (95) | 1.92 | 1.60 | 1.69 | 0.72 (95) | N |
We also extracted the spectra of these brightest sources. We generated response matrix files (rmf) and ancillary response files (arf) using the SAS tasks rmfgen and arfgen. The spectra were then binned to reach a minimum of 10 cts per channel. Finally, we analysed the background-corrected spectra within XSPEC. Due to strong noise at very low and very high energies, we have discarded energy bins below 0.4 keV and above 10 keV. We have fitted the spectra with an absorbed model or an absorbed power-law. For each source, we have fitted separately EPIC MOS1+2 and EPIC pn data, but as they gave similar results - within the errors - we finally fitted all three instruments simultaneously and we list the parameters of the best-fit models in Table 4. Note that XMMU J000643.6+633912 (# 48), which corresponds to the F7V star BD+62∘2368, is only well fitted by a model, as could be expected for a coronal source. For the average distance of 187 pc estimated above, the X-ray luminosity of this source is 8.21028 erg s-1, which corresponds to . A model also provides a good fit for XMMU J000623.9+633927 (# 40), and for the distance of 540 pc estimated above, its X-ray luminosity is 4.51029 erg s-1, and that results in . On the contrary, the large absorbing column, the large HRs, and the good fit by a power law of XMMU J000445.1+633550 (#12), XMMU J000457.6+634211 (# 14) and XMMU J000701.7+634151 (# 54) suggest that these 3 sources may actually be background objects. The case of XMMU J000511.7+634018 (# 19) and XMMU J000537.1+634027 (# 23) is different: they are also better fitted by a power law, but their absorbing column is small and their fluxes seem rather low for close X-ray binaries.
5 Conclusion
We have obtained an XMM-Newton observation of HD 108 and its surroundings. The peculiar star HD 108 was found to present a two-temperature spectrum, and did not show any significant short-term variations during the exposure. These observations are also compatible with a stable X-ray emission since 1979. In parallel, we have continued our extensive optical monitoring of the star, and discovered that HD 108 continues to present dramatic line variations in the optical domain. The lack of significant changes in the X-ray emission compared to the optical data is a puzzle. In such a context, no simple model is for the moment capable of explaining the overall behaviour of one of the most peculiar O stars of the sky: any variation of the physical properties (magnetic field, mass-loss rate) of HD 108 is expected to have an impact on the whole wind, not only on the formation region of the optical emission but also on that of the X-rays. Long-term monitoring of HD 108, preferentially in a multi-wavelength campaign, is thus necessary to eventually understand this star.
In addition, 57 new X-ray sources were also discovered in the field of HD 108, and we present here their characteristics (count rate, HRs, plus lightcurve analysis and spectral fits for the brightest ones). Only two correspond to rather bright stars, both of them being late-type stars with coronal X-ray emission. With large HRs and/or large absorbing columns and power law fits, several sources might be background objects. On the other hand, none of the B stars of the field was convincingly detected in X-rays.
Acknowledgements.
We acknowledge support from the PRODEX XMM-OM and Integral Projects and through contracts P4/05 and P5/36 ‘Pôle d’Attraction Interuniversitaire’ (Belgium). We are greatly indebted to the Fonds National de la Recherche Scientifique (Belgium) for multiple assistance including the financial support for the rent of the OHP telescope in 1999 and 2000 through contract 1.5.051.00 “Crédit aux Chercheurs” FNRS. The travels to OHP for the observing runs were supported by the Ministère de l’Enseignement Supérieur et de la Recherche de la Communauté Française. The authors also thank the referee, Dr Pittard, for his useful comments. This publication makes use of data products from the Two Micron All Sky Survey, USNO B1.0 and the Guide Star Catalog-II.References
- (1) Anders, E., & Grevesse, N. 1989, Geochimica et Cosmochimica Acta, 53,197
- (2) Arnaud, M., & Rothenflug, R. 1985, A&AS, 60, 425
- (3) Babel, J., & Montmerle, T. 1997, ApJ, 485, L29
- (4) Berghöfer, T.W., Schmitt, J.H.M.M., Danner, R., & Cassinelli, J.P. 1997, A&A, 322, 167
- (5) Bessell, M.S., & Brett, J.M. 1988, PASP, 100, 1134
- (6) Cardelli, J.A., Clayton, G.C., & Mathis, J.S. 1989, ApJ, 345, 245
- (7) Chlebowski, T., Harnden, F.R.Jr., & Sciortino, S. 1989, ApJ, 341, 427
- (8) Conti, P.S. 1974, ApJ, 187, 539
- (9) Davidson, K., & Ostriker, J.P. 1973, ApJ, 179, 585
- (10) den Herder, J.W., Brinkman, A.C., Kahn, S.M., et al. 2001, A&A, 365, L7
- (11) Diplas, A. & Savage, B.D. 1994, ApJS, 93, 211
- (12) Feldmeier, A., Kudritzki, R.-P., Palsa, R., Pauldrach, A.W.A., & Puls, J. 1997, A&A, 320, 899
- (13) Ferrari-Toniolo, M., Persi, P.,& Grasdalen, G.L. 1981, PASP, 93, 633
- (14) Giacconi, R., Rosati, P., Tozzi, P., et al. 2001, ApJ, 551, 624
- (15) Gies, D.R. 1987, ApJS, 64, 545
- (16) Harris, D.E., Forman, W., Gioa, I.M., et al., EINSTEIN Observatory catalog of IPC X-ray sources (2E catalog), SAO HEAD CD-ROM Series I (), Nos 18-36 (1994)
- (17) Hatchett, S., & McCray, R. 1977, ApJ, 211, 552
- (18) Howarth, I.D., & Prinja, R.K. 1989, ApJS, 69, 527
- (19) Howarth, I.D., Siebert, K.W., Hussain, G.A.J., & Prinja, R.K. 1997, MNRAS, 284, 265
- (20) Hutchings, J.B., & von Rudloff, I.R. 1980, ApJ, 238, 909
- (21) Jeffries, R.D., Thurston, M.R., & Pye, J.P. 1997, MNRAS, 287, 350
- (22) Kaastra, J.S. 1992, An X-Ray Spectral Code for Optically Thin Plasmas (Internal SRON-Leiden Rep., Version 2.0)
- (23) Kaastra, J.S., & Mewe, R. 1993, A&AS, 97, 443
- (24) Kaastra, J.S., Mewe, R., & Raassen, A.J.J. 2003, in New Visions of the X-ray Universe in the XMM-Newton and Chandra Era, ed. F. Jansen, ESA SP-488, in press
- (25) Kahn, S.M., Leutenegger, M.A., Cottam, J., et al. 2001, A&A, 365, L312
- (26) Kallman, T.R., & McCray, R. 1982, ApJS, 50, 263
- (27) Kenyon, S.J., & Hartmann, L. 1995, ApJS, 101, 117
- (28) Krolik, J.H., & Kallman, T.R. 1984, ApJ, 286, 366
- (29) Kudritzki, R.P., Palsa, R., Feldmeier, A., Puls, J., & Pauldrach, A.W.A. 1996, Proc. ’Röntgenstrahlung from the Universe’, eds. Zimmermann, H.U., Trümper, J., and Yorke, H.;, MPE Report 263, 9
- (30) Lamers, H.J.G.L.M., & Leitherer, C. 1993, ApJ, 412, 771
- (31) Lamers, H.J.G.L.M., & Morris, P. 1994, private communication
- (32) Mihalas, D. 1973, PASP, 85, 593
- (33) Moffat, A.F.J., Corcoran, M.F., Stevens, I.R., et al. 2002, ApJ, 573, 191
- (34) Mushotzky, R.F., Cowie, L.L., Barger, A.J., & Arnaud, K.A. 2000, Nature, 404, 459
- (35) Nazé, Y., Vreux, J.-M., & Rauw, G. 2001, A&A, 372, 195 (Paper I)
- (36) Owocki, S.P., & Cohen, D.H. 1999, ApJ, 520, 833
- (37) Peppel, U. 1984, ApJS, 56, 257
- (38) Rauw, G., Blomme, R., Waldron, W.L., et al. 2002a, A&A, 394, 993
- (39) Rauw, G., Nazé, Y., Gosset, E., et al. 2002b, A&A, 395, 499
- (40) ROSAT Consortium, The Second ROSAT Source Catalog of Pointed Observations (2RXP), ROSAT News 72, 25-May-2000 (2000)
- (41) ROSAT Scientific Team, The ROSAT Source Catalog of Pointed Observations with the High Resolution Imager (1RXH) (3rd Release), ROSAT NEWS No. 71, The ROSAT Consortium (2000)
- (42) Sana, H., Stevens, I.R., Gosset, E., Rauw, G., & Vreux, J.-M. 2003, MNRAS, submitted
- (43) Schlegel, D.J., Finkbeiner, D.P., & Davis, M. 1998, ApJ, 500, 525
- (44) Schmidt-Kaler, T. 1982, Landölt-Bornstein Catalogue VI/2b
- (45) Shull, J.M., & Van Steenberg, M. 1982, ApJS, 48, 95
- (46) Shull, J.M., & Van Steenberg, M. 1982, ApJS, 49, 351 (errata)
- (47) Singh, K.P., White, N.E., & Drake, S.A. 1996, ApJ, 456, 766
- (48) Stella, L., White, N.E., & Rosner, R. 1986, ApJ, 308, 669
- (49) Strüder, L., Briel, U., Dennerl, K. et al. 2001, A&A, 365, L18
- (50) Swings, P. 1948, An. Astrop., 11, 228
- (51) Tarter, C.B., Tucker, W.H., & Salpeter, E.E. 1969, ApJ, 156, 943
- (52) Turner, M.J.L., Abbey, A., Arnaud, M., et al. 2001, A&A, 365, L27
- (53) ud-Doula, A. 2002, PhD thesis, University of Delaware
- (54) Verner, D.A., & Yakovlev, D.G. 1995, A&AS, 109, 125
- (55) Verner, D.A., Ferland, G.J., Korista, K.T., & Yakovlev, D.G. 1996, ApJ, 465, 487
- (56) Verner, D.A., & Ferland, G.J. 1996, ApJS, 103, 467
- (57) Voges, W., Aschenbach, B., Boller, Th., et al. 1999, A&A, 349, 389 (1RXS catalog)
- (58) Voges, W., Aschenbach, B., Boller, Th., et al. 2000, ROSAT All-Sky Survey Faint source Catalogue (RASS-FSC), Max-Planck-Institut für extraterrestrische Physik, Garching
- (59) Voronov, G.S. 1997, Atomic Data and Nuclear data Tables, 65, 1
- (60) Walborn, N.R., Howarth, I.D., Herrero, A., & Lennon, D.J. 2003, ApJ, 588, 1025
- (61) Waldron, W.L. 1984, ApJ, 282, 256
- (62) White, N.E., Giommi, P., & Angelini, L. 2000, The WGACAT version of the ROSAT PSPC Catalogue, Rev. 1, Laboratory for High Energy Astrophysics (LHEA/NASA), Greenbelt