The Formation of Dust Lanes: Implications for Galaxy Evolution
The Formation of Dust Lanes: Implications for Galaxy Evolution
Abstract
From a survey of edge-on disks, we find that disk galaxies show a sharp, mass-dependent transition in the structure of their dusty ISM. In more massive, rapidly rotating disks with , we see the well-defined dust lanes traditionally associated with edge-on galaxies. However, in more slowly rotating, lower mass galaxies with , we find no dust lanes. Instead, the distribution of dust in these galaxies has a much larger scale height and thus appears more diffuse. Evidence suggests that the change in scale height is due primarily to changes in the turbulent velocities supporting the gas layer, rather than to sharp changes in the gas surface density. A detailed analysis of our sample reveals that the decrease in the dust scale height is associated with the onset of disk instabilities, evaluated for a mixed stargas disk. Specifically we find that all of the high-mass galaxies with dust lanes are gravitationally unstable, and thus are prone to fragmentation and gravitational collapse along spiral arms. Empirically, our data implies that turbulence has lower characteristic velocities in the presence of disk instabilities, leading to smaller gas scale heights and the appearance of narrow dust lanes. The drop in velocity dispersion may be due either to a switch in the driving mechanism for turbulence from supernovae to gravitational instabilities or to a change in the response of the ISM to supernovae after the ISM has collapsed to a dense layer. We hypothesize that the drop in gas scale height may lead to significant increases in the star formation rate when disk instabilities are present. First, the collapse of the gas layer increases the typical gas density, reducing the star formation timescale. Second, the star formation efficiency increases due to lower turbulent velocities. These two effects can combine to produce a sharp increase in the star formation rate with little change in the gas surface density, and may therefore provide an explanation for the Kennicutt surface density threshold for star formation. Our data also suggest that star formation will be systematically less efficient in low mass disks with , since these galaxies are stable and lie entirely below the Kennicutt surface density threshold. In these stable systems the effective nucleosynthetic yield is reduced because the star formation timescale becomes longer than the gas accretion timescale, supressing the metallicity. This effect can possibly produce the observed fall-off in metallicity at rotation speeds less than . Thus, infall provides an equally plausible explanation of the mass-metallicity relation in disks as global outflows driven by supernova winds. The transitions in disk stability, dust structure, and/or star formation efficiency may also be responsible for the observed changes in the slope of the Tully-Fisher relation, in the sharp increase in the thickness of low mass galaxy disks, and in the onset of bulges in galaxies with . The latter observation lends support to theories in which bulges in late-type galaxies grow through secular evolution in response to disk instabilities. We include in this paper relationships between the surface density and the vertical stellar velocity dispersion as a function of galaxy rotation speed, which may be useful constraints on galaxy formation models.
Department of Astronomy, University of Washington, Box 351580, Seattle WA, 98195
Department of Astronomy, University of Michigan, Ann Arbor MI, 48109
Accepted for publication in ApJ
Subject headings: dust, extinction — galaxies: formation — galaxies: ISM — ISM: structure — galaxies: spiral — stars: formation
.
Department of Astronomy, University of Washington, Box 351580, Seattle WA, 98195
Department of Astronomy, University of Michigan, Ann Arbor MI, 48109
Accepted for publication in ApJ
Subject headings: dust, extinction — galaxies: formation — galaxies: ISM — ISM: structure — galaxies: spiral — stars: formation
1 Introduction
Dust lanes have long been recognized as a characteristic signature of edge-on disk galaxies. Optical images show that edge-on disks are typically bisected by a dark narrow layer of dust which has a typical scale height half as large as that of the stellar disk (Xilouris et al. 1999). However, not all galaxies show this conspicuous feature. In many late-type, low mass galaxies the dust lane is absent. It has been assumed that the lack of a dust lane reflects an overall lack of dust, possibly due to low metallicity (van den Bergh & Pierce 1990). However, low mass galaxies do have dust (see compilation in Lisenfeld & Ferrara 1998). The difference lies in the morphology of the dust distribution, which is less concentrated within the disk and significantly more porous (see e.g. Matthews & Woods 2001).
We are engaged in an extensive multicolor imaging program of edge-on bulgeless disks (Dalcanton & Bernstein 2000) that is ideal for probing variations in dust lane morphology. Our study of this sample indicates that the transition from a thicker, more porous distribution of dust to a narrow lane is remarkably sharp. The dramatic change in the morphology of the dusty ISM with increasing galaxy mass cannot be due solely to increasing metallicity or dust content, but rather must result from the onset of a distinct physical mechanism.
As discussed in more detail in §4, dust is an excellent tracer of gas in galaxies, with the regions of highest extinction tracing regions of the highest gas density, namely the cool neutral and the cold molecular medium. This correlation is a clue to the observed transition in the dust distribution, and suggests that the dust morphologies indicate a change in the structure of the cool and cold ISM. This connection allows us to use the transition in dust morphology to diagnose the processes which shape the global distribution of the cold ISM.
The outline of the paper is as follows. In §2 we present the evidence in our sample for a sharp change in the dust lane morphology with decreasing mass. We suggest that the observed disappearance of dust lanes results from a sharp increase in the thickness of the cold ISM in low mass galaxies. In §3 we discuss the physics which might drive this morphological dichotomy, and find that disk stability is the only intrinsic property that changes sharply with dust morphology. In §4, we discuss the relationship between gravitational instabilities and interstellar turbulence, and describe how it might lead to a thinner layer of cold ISM in unstable high mass galaxies. In §5 we discuss the implications of our observations for the characteristic scales and velocities of turbulence driven by gravitational instabilities, and suggest that these may provide an explanation for the Kennicutt star formation threshold. In §6, we discuss how the resulting drop in star formation efficiency in low mass disk galaxies leads to lower metallicities and nucleosynthetic yields at the same characteristic velocity where dust lanes disappear, without resorting to global galactic outflows. In §7 we discuss how connections between dust morphology, disk stability, and star formation efficiency may be evident in other observations, such as the Tully-Fisher relation, the bulge-disk ratio as a function of galaxy mass, the thickness of dwarf galaxies, and the properties of galaxies at high redshift. We summarize our conclusions in §8.
2 The Mass Dependence of Dust Lane Morphology
In two previous papers (Dalcanton & Bernstein 2000a, hereafter Paper I, and Dalcanton & Bernstein 2002, hereafter Paper II) we describe the sample selection, image reduction, and extraction of vertical color gradients from a sample of 49 edge-on bulgeless disk galaxies spanning a wide range in rotation speed, or equivalently, mass. The , , and images are presented in Paper I. The and color maps and vertical color gradients are discussed Paper II.
While analyzing the data for Paper II, we noticed a remarkable fact. As is visually apparent in the dust sensitive maps shown in Paper II, all galaxies with high rotation speeds () have obvious dust lanes, while none of the galaxies with lower rotation speeds () do. We have quantified this change in dust morphology by plotting the vertical color profiles as a function of the galaxies’ rotation speed , as shown in Figure 1. Here, is derived from either the galaxies’ HI line widths or from their optical rotation curves when HI data was not available. The colors were measured using the average flux within 1 radial exponential scale length of the center of the galaxy, averaging above and below the plane, as discussed in Paper II. We have excluded two galaxies (FGC E1619 and FGC 2217) because they are not exactly edge-on, and therefore have significantly different color gradients above and below the plane. Errors were calculated in a Monte Carlo fashion to account for the Poisson errors due to flux uncertainties and the correlated errors due to sky subtraction, following Bell & de Jong (2000). Data for which the uncertainty in is above 0.5m are not shown. Such large errors in color typically occur only at the furthest point from the midplane (see Figure 3 of Paper II). The distances above the plane were scaled by the galaxies’ -band half-light height , defined so that half of a galaxies’ light is contained between .

The right hand panel of Figure 1 shows the vertical color profiles of all galaxies with . These galaxies all show steep declines in color () with increasing scale heights, due the presence of a well-defined dust lane. The regions close to the midplane are highly obscured at optical wavelengths, leading to colors that are far redder than any realistic stellar population. Outside of the dust lane, the reddening is much lower, revealing the bluer colors of the underlying stellar population and suggesting that the dust lane is well-confined within the stellar disk, as found in other detailed modeling studies (Xilouris et al. 1999, and references therein). All of the variations in the vertical color profiles are similar in amplitude and extent, suggesting a large degree of uniformity in the structure of the dust lanes111The one apparent exception, FGC 436, is at very low galactic latitude. Given the similarity in shape between its color profile and the others, it seems likely that the true Galactic extinction toward this galaxy is less than we adopted in Paper II. The colors of the galaxy are also consistent with this interpretation..
In contrast, the vertical color profiles of more slowly rotating lower mass galaxies (; left panel) are distinctly different. In these, we can detect no color gradients within , consistent with the visual impression that these galaxies have no dust lanes. In a few galaxies there is a hint of a slight gradient (), but it is neither statistically significant nor reflected in the color gradients (see Figures 3 and 5 of Paper II). Galaxies of even lower mass () likewise show no evidence for dust lanes. They have color gradients comparable to those shown here, or become increasingly redder above the plane.
Figure 1 strongly suggests that represents a dividing line for the dust properties of disk galaxies. There is absolutely no overlap in the properties of the color profiles between the two regimes, despite the small difference in rotation speed. (There are less than separating the maximum rotation speed in the left panel and the minimum in the right.) We would expect that this transition might be somewhat less sharp within a more heterogeneous sample than ours. However, we have inspected images from the Sloan Digital Sky Survey Early Data Release (Stoughton et al 2002) of another edge-on galaxies with known circular velocities and found identical results. This suggests that there are two distinct regimes for the morphology of the dust in disk galaxies and that the transition between these regimes is a very sharp function of galaxy mass.
While there are alternate possibilities explaining the trend seen in Figure 1, none of these seem likely when combined with other observations. One alternate possibility is that low mass galaxies do have dust lanes, but they are obscured by current star formation near the midplane. This would also cause a strong increase in the color toward the midplane due the young population. However, the color gradients of the low mass systems are as flat as those in , as shown in Paper II. The simplest explanation is that the stellar populations and the extinction are quite uniform over a large range in height, not that there is a population of stars which just happens to exactly fill in the dust lane.
A second alternate explanation of the data in Figure 1 is that the low mass galaxies host dust lanes of comparable thickness to those in the high mass galaxies, but that the stellar disk is sufficiently thin that it is entirely embedded within the dust layer and thus no -gradient appears. This explanation fails for several reasons. First, the stellar disk must be substantially smaller than the dust lane to produce a color gradient as small as we observe. If we admit a generous color gradient of for the low mass galaxies, then these must have a stellar scale height, , that is more than a factor of three times smaller than the high mass galaxies (assuming that the strength of the dust lane is similar), in spite of the fact that the mass of the galaxies has changed very little. Second, we can do the more direct test of measuring the actual stellar scale heights for the galaxies. Based on 2-dimensional fits of exponential disks viewed in projection (Yoachim & Dalcanton 2003), we find that there is in fact substantial overlap in the -band scale heights of the low and high mass subsamples, as shown in the top panel of Figure 2. This was initially somewhat surprising, as we expected the lower mass galaxies to indeed be smaller. However, as the bottom panel of Figure 2 shows, also seems to be the point at which the stellar disks become proportionally thicker compared to their radial scale lengths, which compensates for the expected decrease in the size of the galaxy. (We will return to this point in §7.2, as we believe it is closely related to the disappearance of the dust lane.) As a final test that changes in the scale height of the stellar disk are not responsible for masking the true presence of the dust lane, we inspected plots of the color profiles as a function of distance above the plane, rather than scaled to the disks’ scale height. The color profiles of the low mass galaxies can easily be traced to large enough distances that the steep color gradient seen in high mass galaxies would be readily visible, if present.

While the evidence suggests that galaxies with do not have dust lanes, it does not necessarily suggest that there is a large drop in the overall quantity of dust in these galaxies. Dust is probably a by-product of late-stage stellar evolution (Fleisher, Gauger, & Sedlmayr 1992, Gail & Sedlmayr 1988), and thus even low mass galaxies should also have produced dust. Previous studies of extinction and dust-to-gas ratios do suggest that this is the case, as they have found a steady decrease in reddening with decreasing galaxy mass and/or luminosity (e.g. Stasinska & Sodré 2001, Zaritsky et al. 1994), but not a sharp drop in the inferred dust-to-gas ratio.
It follows that dust is still present in galaxies with , but that the spatial distribution of dust has altered dramatically. Specifically, the data are consistent with the dust having a much larger scale height and thus more porous spatial distribution and lower line-of-sight opacity when viewed edge-on. The ground-based images of our sample (Paper I) frequently show significant patchy dust extinction at all scale heights in the low mass galaxies. This confirms that dust is present but is no longer confined to a thin layer. Although almost no late-type edge-on galaxies have published HST observations, the one that has been fully analyzed also shows a significant dust component with a clumpy distribution. A detailed HST study of one slowly rotating, edge-on, late-type galaxy comparable to those in our sample (UGC 7321 with ; Matthews & Wood 2001) reveals a non-negligible amount of dust distributed in clumps and filaments throughout the galaxy, rather than confined to a thin dust lane.
To verify that a change in the dust scale height is responsible for the disappearance of dust lanes we have extracted images of several other galaxies from the HST Archive “Associations”. We have chosen these galaxies to be very late-type and completely edge-on, comparable to those in our sample. There are only two suitable observations of galaxies with (due to few studied galaxies, low signal-to-noise, and/or galaxies’ being resolved into stars), and not many more with (due to the presence of large bulges, and significant deviations from ). In Figure 3 we show images of two galaxies from each mass range, in the reddest filter available. We have scaled the sizes of all four images to the same effective distance using distances from Tully (1988) and from Karachentsev et al. (2000; UGC 7321) so that the true thicknesses of the dust lanes can be directly compared. Figures 3a&b show the two low mass and high mass galaxies, respectively. Due to limitations of the archival data, the images of the low mass galaxies are centered on the galaxies, while the high mass galaxy images are shifted radially so that the center of the galaxy falls on the left edge of the image. Therefore, while all of the HST images show a region of the disk, the images of the high mass galaxies extend twice as far in radius.
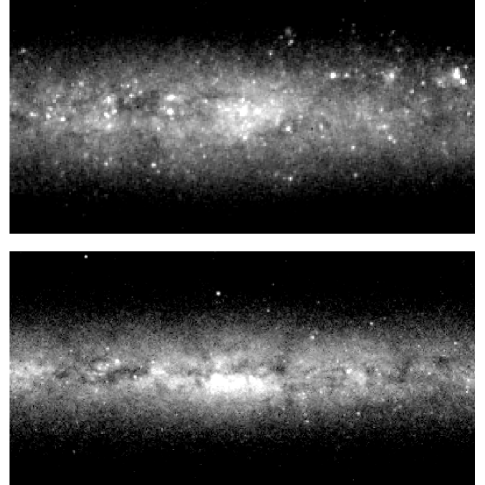
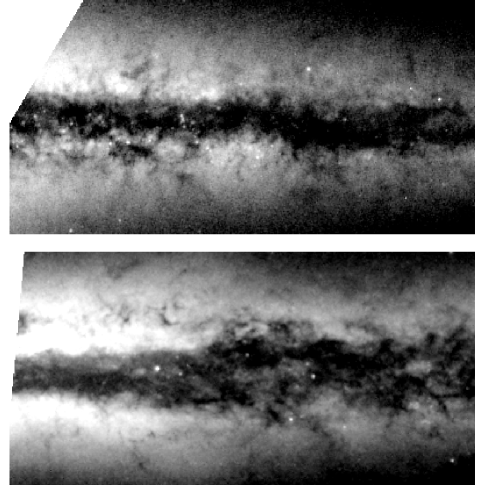
The HST imaging reveals clear differences in the distribution of dust between low and high mass galaxies. The central dust lanes of the high mass galaxies are extremely compact vertically, with relatively sharp boundaries above and below the lane. While these galaxies do have some dust absorption above the plane (and indeed, both were selected for HST study on that basis), the extraplanar dust is clearly a very small fraction of the total. In contrast, the low mass galaxies do not show evidence for an equally compact lane, even one with significantly lower opacity. Although the imaging for the low mass galaxies is not as deep, the observations are sufficient to eliminate the possible existence of a compact dust lane. Note that they do, however, have significant dust absorption, albeit patchier and with a larger scale height222The radiative transfer modeling of UGC 7321 by Matthews & Wood (2001) did not attempt to model the scale height of the dust, and instead adopted a height of 1/2 that of the stars, as found by Xilouris et al. (1999) for galaxies with well-defined dust lanes.. The HST data and our own observations therefore suggest that the lack of dust lanes in low mass galaxies is best explained by an increase in the scale height of the dust, rather than a sharp decrease in the relative dust mass.
Although the dust morphologies in the centers of the galaxies are distinct, there is one morphological similarity between the distributions of dust in Figures 3. Namely, in the outer regions of the high mass galaxy NGC 4302 (lower panel), the distribution of dust is far more porous and has a noticeably larger scale height than in the center of the galaxy. The dust in the outer regions is distributed with a morphology similar to those in the low mass galaxies, but perhaps with a higher overall opacity. In NGC 4302, the transition in the distribution of dust occurs rapidly over a very small range radius, possibly reflecting a change in physical conditions within the disk comparable to the change from galaxy-to-galaxy at .
3 ISM Structure and Disk Instability
Rotation speed (i.e. mass) is unlikely to be the parameter which directly controls the physics of the transition in the dust scale height. Instead, the transition is likely to originate from one or more of the correlations found between the properties of disk galaxies and their rotation speeds. We find that several of the parameters that have previously been suggested as crucial for driving variations in the ISM, such as luminosity density, have relatively weak or non-existent trends with rotation speed within our sample333Note, however, that we considered only mean properties in the midplane of the galaxies. Strong local variations of these quantities within a single galaxy (e.g. near HII regions, in shocks, etc) certainly can alter the properties of the ISM., and show no signs of undergoing a significant change at . We do not discuss these parameters further here, but include them in an Appendix for completeness. We find several other quantities which do correlate well with rotation speed (including stellar surface density [§3.1], stellar velocity dispersion [§3.2], shear [§3.3], and metallicity [§6]), but none of these showed a sharp, discontinuous change at either. Of all the parameters we tested, the only one which showed an obvious connection to the observed transition is disk instability. In particular, we find that, above a rotation speed of , the galaxies in our sample become gravitationally unstable, as parameterized by Rafikov’s (2001) formalism for evaluating radial instabilities in a mixed stargas disk.
The stability of the disk is controlled by the velocity dispersion and the self-gravity (i.e. surface density) of both the stellar and gaseous components, as well as by the kinematic shear within the disk. We therefore evaluate the stability of the galaxies in our sample by calculating the surface mass densities of the stars and gas (§3.1), the velocity dispersion (§3.2), and the epicyclic frequency (§3.3), using our NIR data and existing data from the literature. We combine these quantities to assess the stability of our sample galaxies in §3.4.
3.1 Surface Density
The surface densities of both gas and stars contribute to disk instabilities. While the gas component tends to dominate the instability, the stellar component provides additional mass which can participate in and reinforce any growing perturbation. In this section we calculate the mass surface density of each component.
To calculate the stellar surface density of our sample galaxies, we parameterize the band light profile as a radially exponential disk viewed in projection with an isothermal vertical velocity dispersion: , where is the radial exponential scale length, is the vertical scale height, and is the modified Bessel function of the first kind. We then fit for observed peak surface brightness , the radial exponential scale length , and the vertical scale height , and then solve for the face-on central surface brightness (van der Kruit & Searle 1981). Details of the fitting procedure are described in Yoachim & Dalcanton (2004). Similar work by Barteldrees & Dettmar (1994) and Kregel et al. (2002) has shown that this procedure produces measurements of and which are accurate to 10% for inclinations greater than . We also assume a constant disk scale height with radius, consistent with the results of de Grijs & Peletier (1997) for late-type disks. Finally, we convert surface brightness to surface density by adopting a color-dependent stellar mass-to-light ratio of in solar units, based on the results from Bell & de Jong (2001). This yields a mean of for the sample. While the resulting stellar mass-to-light ratios are robust for relative measures of the stellar mass density, the absolute value may be subject to systematic shifts depending on differences between the assumed and the true underlying initial mass function.
To calculate the gaseous mass surface density for our sample galaxy, we are forced to rely on estimating the HI surface density from single-dish observations, because the galaxies in our sample have not yet been mapped at 21 cm. For the 1/3 of the galaxies lacking single-dish HI observations, we estimate the HI mass by scaling the stellar mass (derived from the absolute magnitude using the color-dependent mass-to-light ratio above) by the median ratio of () for the other galaxies in the sample. We derive an approximate HI scale length by adopting the mean ratio of HI to optical scale lengths from Swaters et al (2002) and scaling the value of derived from the 2-d surface brightness fits. We then derive a first order estimate of . However, the HI surface density profiles of comparable late type galaxies in Swaters et al (2002) all have central depressions, so that the central HI surface densities we derive from this relation are significantly higher than seen in any face-on system. We therefore apply a second correction based on the median ratio of the actual central surface density to the one derived in the manner above (), again using the face-on late type galaxies in Swaters et al (2002). Finally, we clip any values of the HI surface density greater than , which is an empirical upper limit for late-type galaxies. The resulting HI surface densities are comparable to those seen in the Swaters et al. (2002) sample. We have propagated errors associated with the derivation of , and while they are large individually, they are small enough that the data reproduces the identical relationship between HI surface density and stellar surface brightness found by Swaters et al. (2002; see their Figure 11).
We also include a correction for the surface density of molecular gas, which makes an important contribution to the gaseous surface density of high mass galaxies. There are currently no CO observations of our sample galaxies, so we are forced to make a purely statistical estimate of the molecular gas content based on the rotation speed of the galaxy. For this we have used the central surface density in H2 of nearby galaxies, as a function of their inclination-corrected rotation speed (, as for the galaxies in our sample) from Rownd & Young (1999). To approximate the selection criteria of our sample, we have eliminated galaxies that (1) are type Sab or earlier, (2) have peculiar or spindle morphologies, (3) are identified as mergers, or (4) are located in close pairs. We fit these data with a power law relationship between and , including a Baysean treatment of upper limits. If Virgo galaxies are included, in . When Virgo galaxies are excluded, the relation shifts to slightly higher values: in . There is scatter of about a factor of 2 around this relation at the high mass end. The scatter increases to a factor of 5 at lower masses due to a large number of CO upper limits among the low mass galaxies. While the scatter is large for these low mass galaxies, we find that the contribution from H2 to the gaseous surface density is negligible, modulo uncertainties in the CO-to-H2 conversion factor. Thus the uncertainty in the H2 surface density makes little contribution to the error budget near the transition in which we are interested.
The resulting central stellar mass surface density, gaseous mass surface density (, using the Virgo data calibration for and correcting for helium), and total baryonic surface density () are shown in Figure 4, as a function of rotation speed. All surface densities show strong correlations with rotation speed (Spearman correlation coefficients of ): ; ; and in units of . However, none of these show a sharp change at . We note that there are many galaxies on either side of the transition with comparable gas and stellar surface densities, suggesting that a drop in surface density alone is not responsible for the significantly increased thickness of the dust layer in low mass galaxies. In addition, the correlation with stellar surface density is comparable to that seen in recent analyses of SDSS data (Kauffmann et al. 2003, Blanton et al. 2003), assuming a power-law relationship for the baryonic Tully-Fisher relation (Bell & de Jong 2000).

Finally, we approximate the dependence of surface density on radius by assuming that the surface density of both the gas and the stars fall of radially as (i.e. as an exponential disk; Regan et al. 2001).
3.2 Velocity Dispersions
We derive the vertical velocity dispersion of the stars by measuring the scale height which results from the balance between dynamical pressure and the gravitational force of the disk. For the isothermal disk population used in the 2-d fits the vertical velocity dispersion is , neglecting the surface density of the gas. We include an approximate correction for the effect of the gas by using instead of in the expression for ; although this is not exact, the gas density is negligible for nearly all of our sample and the approximation is adequate for this calculation. The resulting vertical stellar velocity dispersions are shown in Figure 5. There is an extremely tight power-law correlation between velocity dispersion and rotation speed, in , with a Spearman correlation coefficient of 0.92. However, no sharp transition is seen at .

Because Rafikov’s (2001) analysis quantifies the stability of the disk to radial perturbations, the vertical component of the velocity dispersion is less critical than the radial. We estimate the radial velocity dispersion by assuming , i.e. that the 3-dimensional velocity dispersion is anisotropic, which holds for the old stellar populations of the Milky Way. Although there are no direct measurements of this ratio in other galaxies, there are indirect arguments by van der Kruit & de Grijs (1999) and van der Kruit et al. (2001) which suggest comparable ratios hold outside the Milky Way as well. Finally, we adopt a radial dependence for the stellar velocity dispersion of , as observed by Bottema (1993).
For the gas, we adopt a fixed velocity dispersion of for the HI, typical of the line width of the warm HI component in late type and dwarf galaxies (Young & Lo 1997, Braun 1997, Petric & Rupen 2001, Hoffman et al. 2001), assuming that the warm component dominates the neutral medium and that the gas velocity dispersion is isotropic. We also adopt a velocity dispersion of for the H2 (Malhotra 1994, Combes & Becquaert 1997). We then calculate the effective gas velocity dispersion as the quadrature sum of the velocity dispersion of each component, weighted by their relative surface densities. This allows us to treat the gas as a single component in the stability analysis. Observations of face-on disks suggest that the velocity dispersion of HI and H2 varies weakly with radius, and thus we assume a constant velocity dispersion throughout the disk.
3.3 Epicyclic Frequency
The epicyclic frequency is a measure of the Coriolis force within a rotating disk. The Coriolis force in a strongly shearing disk can disrupt growing perturbations and stabilize the disk for large values of . We now calculate from dynamical measurements of late-type galaxies.
Ideally, we would use spatially resolved velocity maps to measure directly for the galaxies in our sample. Although we have H rotation curves for 2/3 of our sample (Dalcanton & Bernstein 2000b), those curves cannot be used due to projection effects, the sparse sampling of HII regions, and extinction. We therefore derived as a function of rotation speed for an extensive sample of H rotation curves of less inclined galaxies, for which far more accurate values can be derived than from our edge-on sample.
To measure as a function of radius we calculate and from the parameterized rotation curves from Courteau (1997) (see Courteau’s eqn 2), after restricting the sample to only unbarred galaxies of type Sbc or later that have high-quality parameterized fits to the rotation curves. We then calculate using for the resulting sample of 181 galaxies. We find that varies systematically with rotation speed, with more slowly rotating galaxies having smaller values of . For reference, we find that at one disk scale length (), , where is adopted from Courteau (1996). This trend reflects that the internal dynamics of low mass galaxies more closely approximate solid-body rotation.
We derive the radial variation of by averaging together for all Courteau (1997) galaxies that have rotation speeds within of the rotation speed of each galaxy in our sample. We then scale each resulting average curve for by the value of for the corresponding galaxy from our sample.
3.4 The Radial Variation of Disk Stability
We can combine the results of §§3.1-3.3 to evaluate the stability of the disks as a function of radius. For this we adopt the formalism of Rafikov (2001), who evaluates the stability of a thin two component disk where the gas behaves as a cold fluid, and the stars are dynamically warm and collisionless. Rafikov (2001) calculates the locus separating regions of stability (bottom) and instability (top) on a plane of vs , where for the gaseous and stellar velocity dispersions and mass surface densities , respectively. The exact position of the locus depends on the ratio of gas to stellar surface density, , and can be solved for numerically.
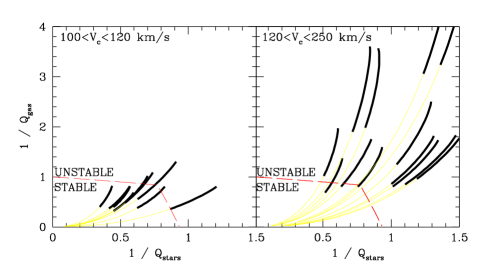
In Figure 6 we plot the radial variation of and for the galaxies with rotation speeds above and below , as in Figure 1. We have included the locus separating stability from instability for the median value of for the galaxies in each subsample. The central regions of the galaxies (; bold line) indicate the region used to identify the presence of dust lanes in Figure 1. Note that these inner regions are typically less stable than the outer regions.
Figure 6 shows a sharp difference between the stability of high and low mass disks in their inner regions. The high mass galaxies (right panel) are unstable over the entire central region within which we can easily detect dust lanes. In contrast, the low mass galaxies (left panel) are almost entirely stable, all the way to their centers. In the few low mass galaxies that are not entirely stable, the unstable region contains a negligible fraction of the galaxies’ light444The only exception is FGC 979, which is unusual in many other respects. It seems to be undergoing a modest starburst, based on its unusually blue color and high surface brightness. These two facts are likely to be related (§5). (). While there may be small unstable regions corresponding to local gas overdensities, Figure 6 suggests that such regions cannot be widespread within the low mass disks.
While one may not have expected the difference in stability to be so sharply defined, it is not surprising that the stability is a strong function of . From the scaling relations derived for surface density, velocity dispersion, and epicyclic frequency, we expect , assuming , at one disk scale length. For the stars, , which depends only weakly on rotation speed. However, as the stability locus shows, our sample is in a regime where the stability of the disk depends more strongly on . This suggests that the stability of late type disks at is nearly inversely proportional to rotation speed. The exact combination of surface densities and sizes of our sample galaxies conspires to make this trend particularly sharp at .
Our conclusion that the high mass disks are substantially and systematically less stable than the low mass disks is unchanged, or perhaps even strengthened, if the finite thickness of disks is taken into account. Calculations by Elmegreen (1995) suggest that including finite thickness effects increases the stability most for low surface density galaxies with high gas mass fractions, such as those in the left hand panel of Figure 6. Thus, thickness corrections will tend to exaggerate the offset between high and low mass galaxy stability seen in Figure 6.
In contrast, the inferred stabilities may be affected directly by uncertainties in and/or . While we do not have spatially resolved HI observations from which to derive these, we nonetheless expect the estimated values to be relatively accurate, for two reasons. First, the central HI surface densities of late type galaxies show a very small absolute range ( at the very extremes), with a well-defined correlation with stellar surface density. Our procedure for estimating surface densities from single-dish measurements reproduces the same range and correlation seen in comparable face-on galaxies, suggesting that while our estimates for an individual galaxy may be uncertain, the mean is fairly accurate. Given that the observed range of central surface densities varies by only a factor of two, then our uncertainty in must be substantially smaller. There are additional uncertainties in the gas mass surface density from the molecular gas component. The intrinsic scatter in the H2 surface density is much larger than the HI (spanning a factor of 10 at the extremes), and we do not yet have measurements of CO fluxes. However, molecular gas is not the dominant gas phase for galaxies near the transition, limiting the degree to which the larger uncertainty in the molecular gas surface density propagates into . In the end, the scatter in as a function of rotation speed is comparable to that found for (Figure 4), for which we have reasonably accurate measurements, suggesting that our uncertainties are not so large as to have swamped the underlying trend. Second, more accurately measured values of , while desirable, are unlikely to deviate much from the values adopted from the Courteau (1997) dataset. At one disk scale length, the intrinsic dispersion in is less than 25%. The scatter is somewhat larger at smaller radii, but this is due to the wide variety of bulge strengths in the Courteau (1997) sample – a feature which would not affect our sample of bulgeless galaxies. Moreover, there is a large degree of self-similarity in the rotation curves of galaxies of similar mass (Persic, Salucci, & Stel 1996), and thus there are unlikely to be major errors introduced by our adopting values for from a separate sample of galaxies.
In conclusion, we find a substantial difference in the stability of galaxies above and below . When combined with the evidence in §2, this suggests that the onset of instabilities is likely to play a key role in the formation of dust lanes.
4 How Disk Stability Shapes the Morphology of the Cold ISM
We now turn our attention to the mechanism by which disk instabilities might lead to the formation of a thin dustlane. Key to our interpretation is the belief that the transition in dust morphology must involve the entire cold ISM, not just the dust component. Thus, the onset of dust lanes in high mass galaxies discussed in §2 must reflect a significant decrease in the scale height of the cold ISM. In the Milky Way, and presumably within our sample as well, the scale height of the cold ISM is set by the equilibrium between turbulent velocities and surface density. Therefore, the onset of disk instabilities may potentially decrease the scale height by altering the turbulent velocities of the gas layer. We now discuss these ideas in more detail.
4.1 The Connection Between Dust and the Cold ISM
The transition in the morphology of the dusty ISM is likely to reflect a structural shift in the entire cool gaseous ISM, for several reasons. First, if dust is evenly mixed with gas throughout the ISM, then the highest densities of dust will coincide with the highest gas densities, i.e. in the coolest phases of the ISM. This assumption is based both on observational data (e.g. Allen, Atherton, & Tilanus 1986, Vogel, Kulkarni, & Scoville 1988, Rand 1995) and theory, which suggests that dust and gas have slow relative drift velocities (Weingartner & Draine 2001). The close physical coupling between dust and gas therefore suggests that the morphology of the dust extinction gives a first order indication of the cold gas distribution. Second, dust is the catalyst for the formation of molecular gas, and thus the cold gaseous ISM will track regions of high dust density – i.e. it will be easiest for molecular gas to form where the dust density itself is highest. Finally, dust is destroyed principally by sputtering and grain-grain collision in supernovae remnants (Dwek 1998, Draine & Salpeter 1979), and thus it may avoid all but the cooler phases of the ISM. These arguments all suggest that regions with the highest levels of dust extinction will also be associated with the cold molecular phase or its immediate precursor, the cool neutral medium (as can be clearly seen in Figure 6 of Dame et al. 2001). We therefore assume that the change in dust morphology with disk stability implies an accompanying change in the cool gas distribution.
4.2 The Importance of Turbulent Velocities
The ground-based and HST data presented in §2, and the dust-cold ISM connection drawn in §4.1, suggest that the scale height of the cold ISM is significantly smaller in gravitationally unstable high mass galaxies. What sets this scale height?
As discussed in §3.1 for the stellar disk, the scale height of the ISM results from the balance between gravity and pressure. The sharp change observed in the ISM scale height suggests that either the self-gravity of the disks or the pressure supporting the ISM changes discontinuously across the transition. However, the data presented in Figure 4 indicates that the self-gravity of the disks is likely to be similar on either side of the transition. Therefore, it is much more likely that the pressure of the ISM drops significantly with the onset of gravitational instabilities, producing thin dust lanes. Indeed, we have solved for the vertical equilibrium structure of the gas and stars and find that we cannot produce a sharp transition in the relative thickness of the gas and stars without assuming that the gas pressure is systematically lower in the unstable high mass galaxies. The question then becomes, what is the mechanism for this pressure support, and why might it drop when disk instabilities are present?
Within the ISM, the dominant source of pressure is dynamical (), and results from random motions of the gas, rather than thermal pressure. These motions are thought to arise almost entirely from turbulence, consisting of superposed “eddies” with a range of physical scales and velocities. The amplitude of these velocity fluctuations vary as a power law over several decades in physical scale (see review by Vázquez-Semadeni 1999). For classical Kolmogorov turbulence of an incompressible adiabatic fluid, this power law spectrum develops when energy input at one particular physical scale “cascades” to other scales. One can think of this as a process that generates eddies of a particular size (i.e. the “driving scale” of energy input). These then break into smaller eddies, or superimpose to form larger ones. Although the ISM is neither incompressible nor adiabatic, the velocity fluctuations of the interstellar medium are observed to follow a turbulent power-law spectrum over several orders of magnitude (e.g. Larson 1981, and more recently Ossenkopf & Mac Low 2002). In such a medium, the velocity dispersion is the rms velocity of the gas integrated over all physical scales . The exact form of the velocity spectrum depends on the amount of energy injected into the interstellar medium and the physical scales at which that energy is injected. This suggests that changes in the mechanism driving the turbulence may alter the turbulent velocity spectrum, and with it, the global rms velocity of the gas.
The connection between the the rms velocity of the gas and the driving mechanism of turbulence suggests a possible mechanism linking the likely drop in the rms velocity of galaxies with to the onset of gravitational instabilities. We explore this possibility in the following section.
4.3 Constraints on Turbulent Driving Mechanisms
There are several mechanisms which are thought to drive turbulence in the interstellar medium (see Mac Low & Klessen 2003 for a review). On relatively small scales, turbulence can be driven by the energetic input of stellar outflows, either from protostar jets or winds from young massive Wolf-Rayet stars, or by supernova explosions. On larger scales, turbulence can be driven by magneto-rotational instabilities (Sellwood & Balbus 1999), or through gravitational instabilities (e.g. Wada, Meurer, & Norman 2002, although see Sánchez-Salcedo 2001). Although all of these energy sources may be operating to some degree in galaxy disks, not all of them are likely to deliver enough energy to drive the turbulence observed in the ISM. Of these various mechanisms, only supernova shocks (Mac Low & Klessen 2003) and/or gravitational instabilities (Elmegreen 2003) are thought to provide sufficient energy input. We will only consider these two possible driving mechanisms in the discussion which follows.
Empirically, our results strongly suggest that the characteristic velocity dispersion of turbulence driven in the presence of gravitational instabilities is indeed lower than that produced by supernovae alone. There are two possibilities that we can identify for explaining this difference. First is that when disk instabilities are present, the fragmentation of spiral arms produced by the disk instabilities becomes the dominant driving mechanism, and that this mechanism produces turbulence with a smaller rms velocity than supernovae-driven turbulence. The second possibility is that supernovae are always the dominant mechanism for driving turbulence, but that in the presence of gravitational instabilities, the ISM layer begins to collapse and becomes denser. At these higher ambient densities, the supernovae feedback may become less effective at driving turbulence, leading the ISM to reach a new equilibrium state with smaller characteristic velocities. We now discuss each of these possibilities.
4.3.1 Turbulence Driven by Gravitational Instabilities
In §3 we presented evidence that galaxy disks with rotation speeds above are gravitationally unstable. What does this imply for the structure of such galaxies and the possible turbulent driving mechanism? To first order, the onset of disk instabilities is usually associated with the formation of spiral arms. However, a theoretical analysis by Elmegreen (1991) suggests that although Toomre’s (1964) parameter does provide some indication of the presence of spiral arms, it is a much more reliable indicator of the ability of such spiral arms to fragment into clumps. Elmegreen (2002,2003) has suggested that this fragmentation process is primarily responsible for driving turbulence, rather than the initial formation of spiral arms. Observations of molecular clouds by Hartmann (2002) lend support to this picture. Combined with our analysis in §3, these works suggest a scenario where massive galaxies () drive turbulence primarily through fragmentation of spiral arms.
Unfortunately, we have no theoretical explanation for why the fragmentation process should produce turbulence with a lower rms velocity dispersion than supernova-driven turbulence. It is not unexpected that the two processes might produce turbulence with different rms velocities, given that the former has a characteristic velocity scale of the Jean’s length divided by the free-fall time of a typical fragment, while the latter has a velocity scale characteristic of expanding shock waves in the ISM. However, the rms velocity dispersion depends on the fully developed turbulent velocity field, and we cannot give a complete explanation for why the velocities associated with the fragmentation process should be smaller overall. Neither can numerical simulations currently shed much light on this issue, due to a lack of the computational power necessary to model 3-dimensional supersonic dissipative turbulence on galactic scales. Instead, we are left with the empirical fact that, if fragmentation of spiral arms is indeed the dominant mechanism for driving turbulence, then the resulting turbulence appears to have lower characteristic velocities than that driven by supernovae. This result may guide future theoretical efforts to understand turbulence in the ISM.
One possible question that arises in the above scenario is why gravitationally unstable disks, which have both fragmentation and supernovae available as turbulent driving mechanisms, would have lower turbulent velocities than stable disks, in which turbulence is powered only by supernovae. Instead, one might expect the turbulence velocities to be larger when both driving mechanisms can be operating simultaneously.
The resolution to this question is more subtle than it first appears. Our empirical result that gravitational instabilities lead to turbulence with lower characteristic velocities is based upon the observed thinness of the dust layer. The apparent scale height of this layer depends upon the scale height of the cold gas integrated along the line of sight and weighted by the local extinction. Therefore, regions of the galaxy with very high extinction and/or reddening dominate the apparent thickness of the dust lane, while regions of the galaxy which have little cold gas produce little extinction, and thus have no significant effect on the morphological appearance of the dust. The highest densities of molecular gas are always found in spiral arms (e.g. Helfer et al. 2003), and thus these regions will dominate the apparent distribution of dust when viewed in the edge-on orientation. This implies that the low velocity dispersion we have inferred only applies to the cold gas localized within spiral arms.
Outside of the spiral arms, the turbulence may well have a different velocity spectrum. Turbulence decays rapidly, and it is unlikely that low velocity turbulence driven within a spiral arm persists outside the arm. After a spiral density wave passes through a region, fragmentation ceases to be a significant driving mechanism and supernovae and late-stage stellar evolution must take over. However, these inter-arm regions have a much smaller fraction of cold gas (Crosthwaite et al. 2001). They therefore produce little extinction and/or reddening and do not significantly influence the observed edge-on morphology of the dust distribution. The exceptions are the few cases where the supernovae-driven turbulence itself produces significant amounts of cold gas in the interfaces between turbulent eddies. Observationally, this is probably manifested in the small subset of galaxies known to have “extra-planar dust” above the confines of the dust lanes (Howk & Savage 1999). These systems have particularly high star formation rates and are the rare cases where we see evidence of both modes of turbulent driving along a single line of sight. Finally, in stable low mass galaxies, we again become sensitive to the extinction caused by molecular gas created by supernovae-driven turbulence, because it is no longer swamped by the much larger extinction produced globally by dense spiral arms.
4.3.2 Turbulence Driven by Supernovae when Gravitational Instabilities are Present
The above scenario suggests that low turbulent velocities result when gravitational instabilities are the dominant mechanism driving turbulence. However, there is disagreement in the literature about whether or not gravitational instabilities could ever provide more energy input than supernovae (e.g. Elmegreen 2003, Mac Low & Klessen 2003). If not, then supernovae must always be the dominant turbulent driving mechanism. Supposing this to be true, the empirical correlation we find between low turbulence velocities and the presence of gravitational instabilities indicates that the feedback of the supernovae into the ISM is different when gravitational instabilities are present. In other words, even though supernovae always are the principal drivers of turbulence, the resulting spectrum of turbulence is different in disks which are gravitationally unstable.
At first glance, this interpretation is not unreasonable. Assuming that our evaluation of stability is measuring the ability of spiral arms to fragment, then large regions within the arms can undergo local gravitational collapse. Perturbations along the spiral arms become more massive than their Jeans’ mass, and are no longer supported by random motions. These regions can collapse vertically, compressing the gas to high densities, and seeding episodes of enhanced star formation. At some point, the feedback from the resulting supernovae will either stabilize the collapse or disperse the collapsing cloud, and the gas layer will find a new equilibrium scale height. If the degree of compression from the gravitational collapse cannot be completely counter-acted by the resulting increased energy input from supernovae, then the new scale height of the gas layer will be smaller.
At second look, however, there are a few possible problems with the above scenario. First, the higher densities in the collapsing gas layer should lead to an elevated star formation rate. If anything, this should increase the energy input of supernovae, leading to higher turbulent velocities, rather than lower ones. To get around this first objection, supernovae would need to be less efficient at driving turbulence in the dense gas of the collapsing gas layer. One solution would be if there is less coupling between the supernovae and the gas because the supernovae “blow out” of the thinner gas layer before depositing much energy (Mac Low & McCray 1988). Another solution would be if the velocities of the supernova shock wave itself is lower in the denser ISM. However, the velocity of a shock wave depends extremely weakly on the density of the ambient medium, making this second solution unlikely.
The second possible problem with supernova-dominant turbulence is that the rms velocity dispersion of a turbulent gas tends to be dominated by the velocities of the largest eddies. However, the characteristic length scale associated with supernova driving is relatively small, corresponding to the typical spatial separation between supernovae. In contrast, the driving scale of gravitational instabilities is much larger, corresponding to the Jeans’ length of the collapsing fragments along the spiral arms. Driving by gravitational instabilities may therefore dominate at the large length scales which contribute most to the global velocity dispersion. While all of these issues are potentially resolvable, full understanding must wait for more detailed calculations and numerical simulations.
4.4 Velocity Dispersions in Face-On Galaxies
We have hypothesized above that the turbulent velocity dispersion of the cold ISM is systematically lower in spiral arms. In principle, this difference could be measured directly in the face-on orientation, allowing a direct comparison between the velocity dispersions of stable and unstable disks, and inside and outside of spiral arms. However, such observations will be complicated by the high spatial resolution needed, and by the very real possibility that the CO-to-H2 conversion factor varies between the two different turbulent regimes. We have performed a preliminary analysis of the FCRAO galaxy survey (Young et al. 1995) and find that almost all stable galaxy disks are undetected in CO. The required velocity dispersion measurements are therefore difficult, if not impossible, to make in stable disks. Even in unstable disks, the degree to which CO emissivity traces the molecular gas is unclear. In the presence of star-formation, the emission from CO can be artificially enhanced by UV-heating by young stars or by low energy cosmic rays, leading the distribution of CO to be displaced from the dust lane (e.g. Rand, Lord, & Higdon 1999).
As an alternative, the velocity dispersion of HI can be employed as a potential substitute for the difficult CO measurements. HI may not be an ideal tracer of the conditions within the molecular gas, but has the benefit of being easily detected. Since most HI is found in inter-arm regions of spiral galaxies, where we suspect turbulence is driven by the same mechanisms as in stable galaxies, the global velocity dispersion of an entire galaxy may not change much above and below the threshold. However, our hypothesis suggests that high resolution spatially resolved maps of HI should reveal systematically lower velocity dispersions in spiral arms undergoing gravitational collapse. Observations of the spiral galaxy NGC 1058 by Petric & Rubin (2003) seem to find exactly this effect, giving some preliminary support to our hypotheses. In low mass galaxies without spiral arms, star formation is also confined to regions with low HI velocity dispersion (e.g. NGC 2366; Hunter, Elmegreen, & van Woerden 2001). This suggests that local gravitational collapse may also be associated with the low velocity dispersions we have hypothesized are associated with more global gravitational collapse in unstable disks.
Finally, we note that the velocity differences between instability-driven and supernovae-driven turbulence are actually not expected to be terribly large, and thus may have easily escaped detection. Although we have not yet carried out a full radiative transfer analysis to measure the thickness of the dust layer in our sample galaxies, we estimate that the scale height is not more than a factor of 2 larger than the scale height found in unstable disks. For an isothermal distribution the scale height is proportional to the velocity dispersion squared, and thus we expect no more than a factor of difference between the velocity dispersions measured in the arm and inter-arm regions. This would correspond to a small change from in the inter-arm region to within the arms.
5 Star Formation and Disk Stability: Explaining the Kennicutt Star Formation Threshold
Kennicutt (1989), and more recently Martin & Kennicutt (2001), have argued that there is a strong empirical connection between disk stability and star formation efficiency. Specifically, they find that at large radii in disk galaxies there is a precipitous drop in the star formation rate, as measured by H. They argue that the fall-off in star formation occurs where the gas disk becomes stable, which they identify as where the surface density of the gas falls below a critical surface density, , where is a numerical constant derived from observations. In regions of galaxies where is low compared to the value of () is high and the disk is stable.
The existence of the Kennicutt star formation threshold implies that there may be an underlying link between disk instability and efficient star formation. Simultaneously, our results suggest a second link between disk instability and the creation of a thin layer of cold ISM. Taken together, these empirical results suggest a possible physical connection between a thin layer of cold ISM and efficient star formation. We now consider how this connection can potentially constrain the direct physical mechanism driving the Kennicutt star formation threshold.
The results in this paper suggest that there are two significant changes in the state of the cold ISM when disks become unstable. First is that the layer of cold ISM collapses vertically. The new equilibrium state of the gas is therefore much denser, on average, when disk instabilities are present. Although the Schmidt law for star formation in disks is usually written in terms of surface density, it can also be expressed in terms of the mass density of the gas:
| (1) |
where is the star formation rate per unit volume, is a measure of the efficiency of star formation, and and are the density and the free-fall time of the gas, respectively. This particular form of the Schmidt law suggests that the star formation rate per unit volume has a strong dependence on the density of the gas, and therefore may be sensitive to changes in the scale height of the gas layer.
Based on the dust morphologies in the HST images, we assume that the scale height of the gas drops by roughly a factor of two when disk instabilities are present. This change in scale height will tend to increase the gas density by a factor of two as well555The dependence of gas density on scale height will not be exact, however, since the gas remains fully turbulent.. The above form for the Schmidt law therefore suggests that the star formation rate would increase by nearly a factor of 3 when the cold gas layer collapses. This change would not be accompanied by any change in the surface density of the gas. The traditional expression of the Schmidt law in terms of surface density, , would therefore appear not hold across a transition where the scale height of the gas changes significantly. This would lead to an apparent jump in star formation efficiency in unstable regions of disks where the scale height of the cold ISM has dropped.
The second significant change in the cold ISM is lower turbulent velocities when disk instabilities are present. These lower rms velocities must accompany the sharp drop in scale height if the surface density has not changed significantly. The drop in velocity dispersion may also have an impact on the star formation rate. In particular, under current theories of turbulent-controlled star formation high star formation efficiencies are associated with lower turbulent velocities. Thus, may be significantly larger in unstable disks, increasing the star formation rate even more than the factor of expected from the increase in density alone, further sharpening the observed Kennicutt star formation threshold. We now review the connection between turbulent velocities and star formation efficiency in more detail.
5.1 Turbulent Controlled Star Formation: Velocities and Star Formation Efficiency
Over the last decade there has been an increasing focus on the role that turbulence plays in star formation. On the one hand, random turbulent velocities are now thought to be critical in supporting molecular clouds against global collapse, and indeed may be a more important source of support than magnetic fields (Klessen, Heitsch, & Mac Low 2000). Thus, turbulence may play an important role in suppressing star formation in molecular clouds. On the other hand, turbulence can lead to converging flows when turbulent eddies collide. These regions have high densities, small internal velocities, and small Jeans masses, all of which encourage small scale local collapse and fragmentation. Turbulence can therefore enhance the star formation rate within molecular clouds, even while suppressing wholesale star formation by preventing the clouds global collapse (see discussion in Mac Low & Klessen 2003). This emerging picture strongly suggests that the interplay between turbulence and gravitational collapse regulates the star formation rate.
Current theories of turbulence-driven star formation find that the star formation rate is sensitive to the energy spectrum of the turbulence. In general, when there is more turbulence on large scales, more material can be “swept up” by the eddies. A large fraction of the mass is therefore driven into high density sheets and filaments which then fragment into stars. Thus, turbulent energy on large scales is thought to increase the star formation efficiency. However, if the turbulent velocities become too high, then overdensities are short-lived. Their lifetimes become shorter than the timescale for star formation and the very high turbulent velocities reduce the star formation efficiency. Simulations have confirmed both of these trends, and demonstrate that both low Mach numbers (i.e. a small ratio of the rms velocity to the sound speed) and large driving scales can lead to high star formation efficiencies (Klessen et al. 2000).
Recently, however, Vázquez-Semadeni, Ballesteros-Paredes, & Klessen (2003) have shown that although the star formation efficiency is correlated with both low Mach numbers and large driving scales, it correlates even more tightly with a single number, the “sonic scale”. This physical length scale is the typical eddy size below which the turbulent velocities become subsonic. In their simulations, velocities are significantly supersonic on large scales and decrease steadily to subsonic velocities on small scales. The sonic scale is then defined as the length scale which divides these two regimes. When the sonic scale is large, the turbulent velocities are supersonic over a much smaller range of scales. Thus, large sonic scales correspond to smaller velocities (i.e. lower Mach numbers) and/or larger driving wavelengths, both of which are associated with inefficient star formation. Indeed, Vázquez-Semadeni et al. (2003) find a nearly one-to-one relationship between increases in the star formation efficiency and in the sonic scale.
In addition to being indicative of high star formation efficiencies, a large sonic scale is also associated with a small rms gas velocity. When averaged over all physical scales, the turbulent velocities in a gas will have a small rms value when a smaller fraction of the gas is supersonic, i.e. when the sonic scale of the turbulence is large. This suggests that gas with globally small rms turbulent velocities has a large sonic scale, and will therefore host more efficient star formation. In §4.2 we gave evidence for systematically low rms velocities in gravitationally unstable disks. In light of the results in Vázquez-Semadeni et al. (2003), this suggests that the turbulent ISM in unstable disks has a large sonic scale, and thus will undergo efficient star formation with larger values of .
These two effects – the larger star formation efficiency due to lower turbulent velocities, and the increased density due to the collapsing gas layer – combine and lead to a highly non-linear increase in the star formation rate when disk instabilities are present. This provides a possible mechanism explaining the Kennicutt density threshold for star formation, while simultaneously explaining the onset of dust lanes.
5.2 Other Issues
The above discussion focusses on the large view of how star formation thresholds may operate in disks. However, there are several more detailed points that we now address here.
First, we note that the above discussion proposes a mechanism only for the truncation of the star formation efficiency in stable regions of disks, and has no immediate implications for how the star formation rate might vary with gas density when instabilities are present (see review by Kennicutt 1998). Other models which presuppose efficient formation (e.g. Elmegreen 2002, Kravtstov 2003) take hold in this regime and will set the scalings between star formation rate and gas density.
Second, in addition to the mechanism we have proposed, there are many other models of star formation thresholds in the literature (e.g. Wyse 1986, , Wang 1990, Wang & Silk 1994, Elmegreen & Parravano 1994, Hunter et al. 1998, Pandey & de Bruck 1999, Sellwood & Balbus 1999). The majority of these models invoke the growth of molecular clouds as the critical mechanism, driven by cloud-cloud collisions in the spiral arms, or the competition between thermal collapse and dynamical shear. Thus they represent a distinct class of models from the one we have explored in this paper. These other scenarios may play some role in establishing the exact distribution of molecular clouds, but do not simultaneously explain the disappearance of dust lanes with the onset of disk stability.
Finally, we address a small potential discrepancy in the above discussion. The Kennicutt threshold suggests that the critical value of separating stability from instability is reached when (Martin & Kennicutt 2001), whereas our analysis of disk stability assumes instead that . However, Martin & Kennicutt (2001) have derived a value of based on an assumed gas velocity dispersion of . Our adopted velocity dispersions are 25% larger, on average. When this difference in corrected for, we would agree with their definition of stability to within 15%, and we would still catagorize the stability of the disks in our sample the same way (i.e. all unstable disks would remain unstable with the slightly revised criteria for instability).
6 The Impact of ISM Structure on Galaxy Metallicity
Empirically, the Kennicutt star formation threshold suggests that star formation proceeds more efficiently in the presence of disk instabilities than in their absence. The existence of two different regimes for star formation, coupled to the presence or absence of disk instabilities, will lead galaxies to have different star formation and enrichment histories, and thus to have different metallicities. Our data in §3 assigns the onset of disk instabilities to galaxies with rotation speeds above . It follows that the metallicities of galaxies above and below this threshold should differ, due to their systematic differences in star formation efficiency.
In the first case, where disk instabilities allow the rapid formation of dense molecular clouds, Elmegreen (2002) suggests that star formation is extremely efficient and goes to the maximum rate permitted by the structure of the ISM. In this regime, any on-going gas infall increases the star formation rate, and the new gas is quickly consumed. This process leads to self-regulated star formation that maintains a nearly constant gas fraction at the edge of instability. In this mode the enrichment history of the galaxy will approximate the “balanced infall” case of chemical evolution, wherein galaxies maintain a constant gas fraction by consuming any infalling gas. This special case can be solved analytically to show that the metallicity of the gas will approach a constant value equal to the nucleosynthetic yield of the stellar population (see review by Tinsley 1980).
In the second case, where disks are stable, star formation proceeds with low efficiency. Galaxies in this regime maintain large gas fractions for long periods of time, enrich slowly, and will therefore tend to have lower metallicities on average. The metallicities will be further reduced by on-going gas accretion. When the star formation rate is low, the accreted gas increases the global gas reservoir, and dilutes the metallicity. In this case, the metallicity will have an “effective yield” (i.e. the metallicity relative to the prediction of a closed box model) that is suppressed compared to the unstable disks. Detailed models by Köppen & Edmunds (1999) demonstrate that galaxies with long star formation timescales compared to the gas accretion timescale () will have low metallicities, low effective yields, and larger ratios of secondary to primarily element abundances, all in proportion to the ratio of .
We find strong support for this picture in the data of Garnett (2002). Garnett (2002) has shown that the metallicity of a large sample of late-type spiral and irregular galaxies varies by a factor of 100 over a wide range in galaxy rotation speed. However, the galaxy metallicities show a sharp change at , exactly where we have identified the transition between the two star formation regimes. Galaxies above the threshold have constant metallicity, regardless of , as expected for unstable disks with efficient star formation that balances infall. Galaxies below the threshold show a strong correlation between metallicity and rotation speed and have an “effective yield” that is systematically suppressed with decreasing galaxy mass (assuming the underlying nucleosynthetic yield does not vary strongly with metallicity).
Garnett (2002) and Dekel & Woo (2002) have argued that the drop in metallicity and/or nucleosynthetic yield in galaxies below reflects the onset of supernovae-driven outflows in low mass galaxies. However, large outflows are hard to explain in these low mass disks. While low mass galaxies are thought to have “bursty” star formation histories, their star formation rates and efficiencies are actually small by any absolute standards (i.e. they only seem high compared to their time-averaged past star formation rates), making it unlikely that these systems experience the large synchronous star bursts necessary to routinely drive winds (Kennicutt 1998). Low mass galaxies also have much higher gas mass fractions than high mass galaxies (McGaugh & de Blok 1997), consistent with infall being at least as important as outflow, if not more so. Given that the drop in effective yield occurs at exactly the rotation speed where disks become stable, the combination of late-time infall and inefficient star formation due to the onset of disk stability seems to be a more plausible explanation for the observed mass-metallicity relationship observed in disks. Note however, that we are not commenting on the origins of the mass-metallicity relationship in spheroidal systems. Massive bulges and ellipticals are not subject to disk instabilities, and unlike most disks they do show evidence for the short episodes of very high star formation rates required to drive winds.
Further support for the link between disk galaxy stability and effective yield can be found in Garnett’s data, which shows a strong correlation between effective yield and galaxy morphology. Galaxies classified as spirals all have nearly constant effective yields, whereas the yields of irregulars and low surface brightness galaxies are systematically lower (his Figure 5). This implies that galaxies with morphological evidence for gravitational instability throughout their disks have high, nearly constant values of the effective yield characteristic of efficient star formation. In contrast, stable disks can only experience sporadic star formation in response to local instabilities, leading to irregular morphologies (as in dIrr and LSBs), and suppressed yields.
Within the class of low mass stable disks, the trend of decreasing effective yield with decreasing rotation speed is probably a by-product of the decreasing galaxy surface density (Figure 4). While low mass galaxies are “stable” in the sense that their mean surface densities are low enough that they are unlikely to host widespread gravitational instabilities, they are observed to host sparse localized regions of high gas density. These regions rise above the threshold for instabilities over small areas and are associated with knots of star formation (e.g. Hunter & Plummer 1996, van Zee et al. 1996, 1997, Hunter, Elmegreen, & Baker 1998). Galaxies with lower surface densities require larger (and thus rarer) density perturbations to initiate local gravitational collapse and temporarily drive efficient star formation. Thus, they will have lower time-averaged star formation rates, a larger ratio of to , and a lower effective yield. The lower density of these systems may also lead to longer accretion timescales as well, since the infall timescale is proportional to , which would further decrease the yield. This assumption finds strong support in the chemical evolution models of Boissier et al. (2001).
Finally, we comment on another more speculative mechanism that may affect the observed correlations between rotation speed, metallicity, and mean stellar age. If young disk galaxies are initially gaseous, then they are unstable for all reasonable disk parameters. Even very low mass galaxies with will have some initial epoch of instability, which is coupled with high star formation efficiency. This process shuts off when enough stars have formed to lower the gas surface density and stabilize the disk. We have calculated the stability of disks as a function of the fractional gas mass surface density (), using the scaling relations from §3, and find that this early epoch of high star formation efficiency terminates earlier (i.e. at higher gas mass fractions) in galaxies with lower total mass. The remaining gas reservoir is left to be processed at lower star formation efficiency. This mechanism could potentially explain the observations of thick disks in Paper II by producing thick disk stars during an epoch of instability in the young gas rich disk, perhaps through the mechanism proposed by Kroupa (2002), while still allowing the thin disks to form at much later times.
7 Other Consequences
In the sections above we have discussed three empirical facts: (1) high mass disks with are unstable to gravitational instabilities; (2) the cold ISM is systematically thicker in galaxies with ; and (3) distribution of dust is thicker and more diffuse in low mass galaxies. In addition to their implications for star formation thresholds (§5), these facts have other broad implications for galaxy evolution and morphology.
7.1 The Formation of Bulges
It has become standard lore that very low mass galaxies do not have bulges. Recent evidence now allows us to quantify the mass scale at which bulges disappear from galaxies. Kauffmann et al. (2002) have used the Sloan Digital Sky Survey (York et al. 2000) to examine the dependence of a galaxy’s morphology, as measured by its concentration index, on the galaxy’s stellar mass. They find that the concentration index is constant below a stellar mass of , consistent with all galaxies being effectively bulgeless below this mass (their Figure 8). Using the baryonic Tully-Fisher relation of Bell & de Jong (1999), we find that this stellar mass corresponds to a rotation speed of , exactly the rotation speed at which the high mass disks in our sample become unstable.
We also see the same transition within our own data. While the sample in Paper I was chosen to consist of apparently bulgeless disks as viewed on the Digitized Palomar Sky Survey, subsequent deep near-IR imaging revealed the presence of small three-dimensional bulges in all the galaxies with . None of the lower mass galaxies showed this additional component. Further independent support can be found in the study of dust lane thickness by Hacke, Schielicke, & Schmidt (1982). They selected nearly 40 galaxies with prominent dust lanes in the Palomar Observatory Sky Survey plates. All of these galaxies turned out to be type Sc or earlier666The one exception, NGC 4758, was tentatively classified as an irregular, but in fact is a clear merger, based on imaging from the Nearby Field Galaxy Survey (Jansen et al. 2000a)., suggesting that selecting for the presence of dust lanes also indirectly selects for the presence of bulges.
Taken together, these data strongly suggest that the existence of bulges and dust lanes in massive late type galaxies are linked. If so, then it is likely that the onset of disk instabilities drives not just the formation of dust lanes but the formation of bulges as well. This gives support to models of secular bulge formation in late-type galaxies (Pfenniger 1993). These models invoke angular momentum transport and vertical heating from resonances in bars to explain the formation of small bulges in late-type disks. Since transient bars are a possible by-product of disk instabilities, bulges formed by secular evolution are less likely to exist in stable low mass galaxies with .
7.2 The Thickness of Low Mass Galaxies
There is a slowly growing body of evidence that low surface brightness dwarf galaxies are thicker than normal spiral disks. Estimates of the intrinsic axial ratios of dwarf irregulars range from (Hodge & Hitchcock 1966, van den Bergh 1988, Binggeli & Popescu 1995) up to (Stavely-Smith, Davies & Kinman 1992, Sung et al. 1998), all of which are significantly “puffier” than typical spirals (e.g. Kudrya et al. 1994). While the past work has pointed to significant structural differences between the disks of classic dwarf irregulars and normal spirals, two questions have remained unresolved. First, what is the mass scale at which disks “puff up” and second, what is the responsible mechanism?
The structural analysis of our edge-on galaxy sample (Figure 2) shows that there is a striking difference in the ratio of radial to vertical scale lengths () above and below . Galaxies above this mass threshold have axial ratios of 5:1, with little scatter. Low mass galaxies, however, are much rounder on average, and show much more scatter in their axial ratios. Although we have not done a full shape analysis, the observed axial ratios should be nearly representative of the true axial ratios, given that our original sample was chosen to be the most highly inclined galaxies in the FGC catalog. Thus, the data in Figure 2 suggest that galaxies with are puffier on average than more massive disks. Given that these galaxies are stable, they are unlikely to host well-defined spiral arms and would probably be classified as dwarf irregulars in a face-on orientation. Thus, they are comparable to the thick dwarf irregular and low surface brightness galaxies considered in previous shape analyses.
We believe that the increase in thickness in low mass galaxies may be closely associated with the disappearance of the dust lanes. We have given evidence in §§2–4 that dust lanes are absent in low mass galaxies because the cold ISM has a substantially larger scale height. This implies that stars forming from the cold ISM will have a larger scale height as well. This process can be seen directly in Figure 3, where luminous young stars show up as bright white point sources against the diffuse background. In the high mass galaxies, these point sources are clustered close to the midplane, whereas in the low mass galaxies, the young stars are distributed almost uniformly with height. The vertical scale height of the young stellar distribution will therefore be substantially thicker in the low mass galaxies, leading to smaller values of .
We note that there have been other analyses in the literature that have not found the sharp change in that we identify in Figure 2. The most directly comparable are the structural analysis of de Grijs (1998) and a reanalysis of the same data set by Kregel et al. (2002). These groups find no substantial trend in with galaxy rotation speed. There are at least two reasons why such trends may have been masked in their data. First, their analysis was performed on -band images that are substantially affected by dust lanes. This will lead to artificially large values of in the high mass galaxies, masking the trend which appears in our NIR -band data. Although these groups take steps to minimize the effect of dust lanes, our own experiments with 2-d fitting of edge-on disks in the optical suggests that it is difficult not to bias the scale height to large values of , even when masking the dust lanes. Second, their sample includes a much broader range of Hubble types, complicating the interpretation of the observed flattenings in the high mass galaxies with large bulges. Karachentsev et al. (1997) have also analyzed the apparent flattenings of edge-on galaxies, using the axial ratio of the limiting isophote of photographic plates. The same issues which affect the de Grijs (1998) sample are relevant here, and again it is not necessarily inconsistent with our data that no trend with rotation speed was found. Moreover, the shape of the limiting isophote is a less robust measurement of the flattening than fitting edge-on exponential disk models, which better traces the distribution of the bulk of the stars.
7.3 Tully-Fisher Relation
Our work suggests that the disk galaxy population may have a systematically different star formation history, physical structure, and internal extinction at rotation speeds less than . These differences may be observable as features in the Tully-Fisher relation. We now explore the expected and observed changes due to the above effects.
7.3.1 Possible Changes in Slope
A recent analysis of Tully-Fisher residuals by Kannappen et al. (2002) suggest that below , kinematically undisturbed galaxies fall systematically below the Tully-Fisher relation defined by high mass galaxies. This would be consistent with their having low star formation rates due their stability, as discussed in §5.
7.3.2 Possible Changes in Scatter
The scatter and slope of the Tully-Fisher relation depends relatively sensitively on the exact extinction model used to correct a sample of galaxies to a face-on luminosity (e.g. Pierini 1999). Variations in the distribution of dust therefore have an effect on the Tully-Fisher relation. However, upon further consideration the absence of dust lanes in low mass galaxies may have less impact on the scatter in the Tully-Fisher relation than expected. In galaxies with narrow, optically thick dust lanes, the far side of the galaxy will be unobservable This leads galaxies with dust lanes to have luminosities reduced by nearly a factor of two at wavelengths where the dust lane is optically thick. However, this change in luminosity should be relatively consistent from galaxy to galaxy, leading to a well-defined inclination-dependent correction for extinction and thus little added scatter in the Tully-Fisher relation for galaxies with .
In contrast, when the dust has a larger scale height and is more diffuse overall, the overall extinction might be expected to be lower, requiring a different inclination correction for low mass galaxies. However, the extinction may still be significant, or indeed even larger than for a dust lane, particularly if stars are physically correlated with dust (Bianchi et al. 2000). Variations in the distribution of dust may therefore not necessarily lead to a noticeable change in the slope of the Tully-Fisher relation. There may, however, be an increase in scatter, because the inclination correction for a clumpy dust distribution with large scale height is quite different than for a traditional dust lane morphology (Bianchi et al. 2000, Misiriotis & Bianchi 2002). Observational limits on these effects have been explored by Pierini (1999), who find no trends in the Tully-Fisher relation which exceed the uncertainties in extinction corrections and population incompleteness. However, his Figure 3 may suggest an increase in scatter at rotation speeds less than .
In summary, it seems that the drop in star formation efficiency below may indeed be having an effect on the slope of the Tully-Fisher relation for kinematically undisturbed, non-starburst galaxies. However, the change in the distribution of dust has a much smaller effect, producing no obvious change in slope, and a small to non-existent change in scatter at rotation speeds below .
7.4 Implications for High Redshift
The present day threshold for disk stability may not hold at higher redshifts, due to evolution in galaxies’ surface densities, gas fractions, dark matter halos, and disk velocity dispersions. Evolution in all of these quantities could potentially lead to evolution in the mass scale associated with disk instabilities, dust lanes, and efficient star formation. However, numerical simulations indicate that massive disks evolve at constant (Mayer et al. 2001), suggesting that the threshold for stability may be roughly the same at all redshifts. It may also be possible to make a priori predictions for the redshift evolution of disk stability with mass by using semi-analytic models for galaxy formation. However, the associated uncertainties will be large.
Rather than attempting to predict disk stability as a function of redshift, it may be more fruitful to use the presence of dust lanes in high redshift disks to place empirical constraints on the evolution of disk stability. One could measure the rotation speeds of high redshift disks that host dust lanes, and use the minimum observed rotation speed as an estimate of the scale where disk instabilities become prevalent. The observed evolution in this velocity scale can then be used as a constraint on models of disk galaxy evolution, by providing an indirect measurement of disk stability at high redshift.
7.5 The Magellanic Clouds
We note that evidence for a transition in dust morphology has been seen in the Magellanic clouds. In a multicolor survey of the LMC, Zaritsky (1999) finds that the population of cool, presumably older, stars shows a tail toward high extinction. He argues that the heavily extincted stars are from the far side of the galaxy, viewed through an intervening dust lane. In contrast, comparable stars in the SMC show no such high extinction tail, suggesting that there is no dust lane blocking the view of the more distant stars (Zaritsky et al. 2002). The SMC is a very low mass galaxy, based on its luminosity. Although it has no observed rotation along the line of sight due to its face-on orientation, it has a central velocity dispersion of (Hatzidimitiou et al. 1997) and a Tully-Fisher based rotation speed that clearly puts it on the low mass side of the transition. The more massive LMC has a rotational speed of using the kinematic inclination of , or , using the morphological inclination (Kim et al. 1998). Its rotation speed is therefore close to but somewhat less than the transition speed discussed in this paper. However, the LMC has a strong bar indicating that the disk is currently globally unstable, and thus may be dynamically similar to undisturbed galaxies above transition in our sample. The data on the Magellanic Clouds are therefore consistent with the behavior of dust lanes inferred for our sample.
7.6 Evidence for a Change in the Extinction of Face-on Galaxies
While our observations of variations in dust lane morphology have been based on a sample of edge-on galaxies, such variations may also detectable in the face-on orientation. While we cannot view dust lanes directly in this configuration, we may potentially infer their existence through measurements of extinction and reddening, using the reddening sensitive ratio of H/H. In almost all conditions in the ISM, this ratio has an intrinsic value of 2.9 (Case B recombination). Reddening manifests itself by suppressing the bluer H line relative to the red H line, leading the ratio to increase above the Case B expectation.

In Figure 7, we show the H/H ratio (relative to Case B) for all normal late-type galaxies (Sc and beyond) from Jansen’s (2000a,b) Nearby Field Galaxy Survey. The ratio was derived from integrated moderate resolution spectra, and thus represents an intensity-weighted average over the entire galaxy. In the absence of rotation speed information, we plot H/H as a function of metallicity using the metal-sensitive [NII]/H ratio. We use [NII]/H as a proxy for rotation speed since dynamical measurements have not yet been published for this sample. As discussed in §6, galaxies’ metallicities correlate well with rotation speed, and tend to become super-solar above (Garnett 2002). The vertical line drawn at solar metallicity therefore marks the approximate regime above which we expect dust lanes to appear.
Figure 7 suggests that the distribution of dust undergoes a transition similar to that seen in edge-on galaxies. At low metallicities, corresponding to low rotation speeds, the degree of reddening is quite low. Most galaxies have mean values of H/H within 15% of the unreddened value. With slightly increasing metallicity, the ratio rises somewhat, indicating a modest increase in reddening (about 30% above the Case B value). However at larger metallicities, the reddening jumps sharply Galaxies with super-solar gas phase abundances have a median H/H that is nearly twice the unreddened value. This transition occurs at a value of [NII]/H that is identical to where we see the onset of dust lane morphologies in our edge-on sample.
The sharp transition in the observed reddening of the face-on Jansen et al. (2000a,b) sample is consistent with a rapid change in the distribution of dust. Although the dust content should increase with increasing metallicity, the metallicity changes very little across the transition near solar metallicity and we would not expect such a rapid increase in its overall quantity. Instead, radiative transfer simulations have demonstrated the extreme sensitivity of extinction and reddening to the overall distribution of dust and its degree of clumpiness (Disney et al. 1989, Bianchi et al. 1996, Kuchinski et al. 1998, Bianchi et al. 2000, Matthews & Wood 2001, Misiriotis & Bianchi 2002). Models in which the dust is distributed in a uniform sheet suffer from far more reddening than those in which the same quantity of dust is confined to small clumps mixed evenly with the stars. In the latter case, those few lines of sight that are heavily reddened are also heavily extincted. Thus, the majority of the light that escapes is unreddened. The uniform and clumpy distributions assumed by these theoretical models are not exact analogs of a turbulent dusty ISM. However, the uniform thin dust layer model is not a terrible analogy to the dust distribution seen along the line of sight (i.e. vertically) in high mass disks viewed face-on, particularly in the spiral arms which host most of the HII regions. Likewise, the model with intermixed dust clumps is not a bad match to the more vertically extended dust distribution in low mass galaxies. Thus, while the models are not perfect replicas of the dusty ISM, they are likely sufficient to conclude that the sharp drop in reddening with decreasing metallicity is more compatible with a change in dust distribution than a sharp decrease in the overall quantity of dust.
8 Conclusions
Our analysis of the distribution of dust in a large sample of edge-on late-type disks shows that the dust lane morphology appears only within galaxies rotating faster than . Based on ground-based and archival HST images, we suggest that dust lanes appear in high mass galaxies because the thickness of the dust layer drops substantially, increasing its line-of-sight opacity and its contrast against the stellar disk. Dust is closely coupled to the cold ISM, and thus these data indicate that the scale height of the cold ISM is likely to have dropped as well. The scale height is set by the balance between the surface density of the disk and the velocity dispersion of the gas. However, the surface density does not increase sharply above the transition, and thus we suggest that the smaller scale height is due to lower velocity dispersions in high mass galaxies.
We have investigated possible origins for the observed transition at . We find that this transition point corresponds to the rotation speed above which disks become gravitationally unstable. We speculate that the disk instabilities lead to a thin dust lane through collapse and fragmentation of high density gas within spiral arms. We speculate on two possible effects which might reduce the rms velocity dispersion within fragmenting spiral arms and thus lead the new equilibrium scale height for the gas to be lower. The first possibility is that the fragmentation process changes the dominant driving mechanism for turbulence from supernovae to fragmentation. The second possibility is that supernovae continue to be the dominant mechanism driving the turbulent velocities, but that the resulting velocities are lower in the dense collapsed gas layer. Either of these two scenarios would affect the velocity dispersion of only the gas within the spiral arms.
We suggest that the change in dust lane morphology may provide a physical explanation for the Kennicutt (1989) star formation threshold. Our data indicate that when disk instabilities are present, the cold ISM collapses to a denser layer with smaller turbulent velocities. The increased density should increase the star formation rate by roughly a factor of three, assuming a Schmidt law, with no change in gas surface density. In addition, numerical simulations suggest that star formation is more efficient when turbulent velocities are smaller, further increasing the star formation rate. The combination of these two effects can lead to sharp increases in the star formation rate in the gravitationally unstable regions of disks, reproducing Kennicutt star formation threshold.
Our data suggest that galaxies with will tend to lie entirely below the Kennicutt threshold. They will therefore have systematically low star formation efficiencies and long star formation timescales. The long star formation timescales can potentially explain why the metallicity and effective yield of galaxies decrease systematically below , but are constant above. For the low mass stable disks, the star formation timescale is likely to be sufficiently long that accretion can dilute the gas in between significant star formation events. In this regime, the metallicity and the effective yield are systematically depressed, so that the galaxies with the longest star formation timescales show the largest deviations from theoretical closed box yields. For unstable disks, however, star formation is extremely efficient and always shorter than the infall timescale. In this regime, chemical evolution models suggest that the metallicity and effective yield approach a constant value. This interpretation may explain the observed trends between metallicity and galaxy mass without invoking mass loss through outflows.
We give evidence that the onset of disk instabilities at may be associated with the onset of bulges at a comparable velocity. This gives support to theories of secular evolution for bulge formation in late-type galaxies. We also demonstrate that there is a significant jump in the thickness of stellar disks for galaxies with . We argue that this results naturally from the increase in the thickness of the cold ISM in these stable galaxies.
In a subsequent paper we will explore the implication of our results for the molecular gas content of galaxies.
Acknowledgments
We gratefully acknowledges helpful conversations with Colin Norman, Sangeeta Malhotra, Monika Kress on grain surface chemistry, Erik Rosolowsky, Mordechai Mac-Low, and Bruce Draine. In addition, we thank Marco Spaans, for providing cooling curves below , Roman Rafikov for providing the stability loci for Figure 6, Stephane Courteau for providing his rotation curve data in digital format. Chris McKee, Carl Heiles, Connie Rockosi, Christopher Stubbs, and Craig Hogan are also acknowledged for interesting and informative discussions during the course of this work. We are also grateful for the sounding board provided by Vandana Desai, Maritza Tavarez, Andrew West, and Beth Willman during the writing of this paper. JJD dedicates this paper to the memory of Dan Rosenthal. The authors also thank the anonymous referee for constructive comments which substantially improved the paper. Finally, we now acknowledges the wisdom of E. L. O. Bakes who insisted that “Dust is sublime”.
JJD was partially supported through NSF grants AST-990862 & CAREER AST-0238683, and the Alfred P. Sloan Foundation. PY was partially supported through UW’s NSF ADVANCE program. This research has made use of the NASA/IPAC Extragalactic Database (NED) which is operated by the Jet Propulsion Laboratory, California Institute of Technology, under contract with the National Aeronautics and Space Administration.
APPENDIX
A Appendix: Quantities Which Do Not Cause the Transition in Dust Lane Morphology
For completeness, we briefly discuss two quantities which we rejected as having a significant effect on the formation of dust lanes and the morphology of the ISM.
A.1 Luminosity Density


In addition to being affected by surface density dependent dynamical instabilities, the state of the ISM can be affected by the density of ionizing radiation. To explore this, we have used the 2-dimensional fits to the band surface brightness to derive the central midplane luminosity density, (van der Kruit & Searle 1981). The results are shown in Figure A8 for the band and for the band (the latter giving a better estimate of the density in ionizing UV photons). While there is a factor of ten range in the midplane luminosity densities, there is no statistically significant trend in either or .
A.2 Internal Shear
Another possible contributor to the observed transition is the systematic change in the internal dynamics of the galaxies. Shear within a galaxy disk is a possible source of energy input into the turbulent spectrum of a galaxy’s ISM and may affect the rate at which cold dense clouds are formed through collisions. It may also be closely tied to the star formation rate (Hunter et al. 1998). If the internal shear changes systematically as a function of galaxy mass, then potentially the change in energy input can change the three-dimensional structure of the ISM.
To quantify the amplitude of this effect alone, rather than its contribution to gravitational instability, we adopt the “universal rotation curve” of Persic et al. (1997). Using a large database of rotation curves, Persic et al. have argued that the rotation curves of galaxies are almost entirely determined by a galaxy’s rotation speed and/or luminosity. They have derived a fitting formula good to roughly 10%, allowing one to derive the approximate rotation curve for any galaxy. They measure the gradient of the rotation curve as a function of a galaxy’s rotation speed as well.

We use the Persic et al. (1997) data on the gradient of the rotation curve to derive d/d in km/s/kpc, as a function of a galaxy’s rotation speed (from Matthewson et al. 1992), shown in Figure A9. Over the range of rotation speeds spanned by our sample, the lower mass galaxies increasingly approach solid body rotation, decreasing the amount of internal shear. This suggests that energy input due to shear is probably lower in lower mass galaxies, decreasing the contribution that the relative internal velocities make to the turbulent spectrum.
The decrease in shear with decreasing mass goes in the wrong direction for creating the observed transition, which appears to have higher turbulent velocities in low mass disks. We conclude that increased energy input from dynamical shear is not directly responsible for the disappearance of the dust lane phenomena, except for its effect on the epicyclic frequency. In contrast, the trend between shear and mass does go in the right direction if creation of a dust lane requires frequent cloud-cloud collisions, though a specific physical mechanism has yet to be proposed.
B References
Allen, R. J., Atherton, P. D., & Tilanus, R. P. J. 1986, Nature, 319, 296
Barteldrees, A. & Dettmar, R.-J. 1994, A&AS, 103, 475
Bell, E. F., & de Jong, R. S. 2000, MNRAS, 313, 800
Bianchi, S., Ferrara, A., Davies, J. I., & Alton, P. B. 2000, MNRAS, 311, 601
Bianchi, S., Ferrara, A., & Giovanardi, C. 1996, ApJ, 465, 127
Binggeli, B. & Popescu, C. C. 1995, A&A, 298, 63
Blanton, M. R. et al. 2003, ApJ, submitted
Bottema, R. 1993, A&A, 275, 16
Boissier, S., Boselli, A., Prantzos, N., & Gavazzi, G. 2001, MNRAS, 321, 733
Braun, R. 1997, ApJ, 484, 637
Combes, F. & Becquaert, J.-F. 1997, A&A, 326, 554
Courteau, S. 1997, AJ, 114, 2402
Courteau, S. 1996, ApJS, 103, 363
Crosthwaite, L. P., Turner, J. L., Hurt, R. L., Levine, D. A., Martin, R. N., & Ho, P. T. P. 2001, AJ, 122, 797
Dalcanton, J. J. & Bernstein, R. A. 2000a, AJ, 120, 203. (Paper I)
Dalcanton, J. J. & Bernstein, R. A. 2000b, ASP Conf. Ser. 197: Dynamics of Galaxies: from the Early Universe to the Present, 161
Dalcanton, J. J., & Bernstein, R. A. 2002, AJ, in press. (Paper II)
de Grijs, R. & Peletier R. F. 1997, A&A, 320, 21
de Grijs, R. 1998
Dekel, A., & Woo, J. 2002, astro-ph/0210454
Draine, B. T., & Salpeter, E. E. 1979, 231, 438
Dwek, E. 1998, ApJ, 501, 643
Elmegreen, D. M. 1980, ApJS, 43, 37
Elmegreen, B. G. 1991, ApJ, 378, 139
Elmegreen, B. G. 1995, MNRAS, 275, 944
Elmegreen, B. G. 2002, ApJ, 577, 206
Elmegreen, B. G. 2003, Ap&SS, 284, 819
Elmegreen, B. G., & Parravano, A. 1994, ApJ, 435, L121
Fleischer, A. J., Gauger, A., & Sedlmayr, E. 1992, A&A, 266, 321
Gail, H.-P. & Sedlmayr, E. 1988, A&A, 206, 153
Garnett, D. R. 2002, ApJ, in press
Hacke, G., Schielicke, R., & Schmidt, K.-H. 1982, Astron. Nachr., 303, 245
Hartmann, L. 2002, ApJ, 578, 914
Hatzidimitriou, D., Croke, B. F., Morgan, D. H., & Cannon, R. D. 1997, A&AS, 122, 507
Helfer, T. T., Thornley, M. D., Regan, M. W., Wong, T., Sheth, K., Vogel, S. N., Blitz, L., & Bock, D. C.-J. 2003, ApJS, 145, 259
Hodge, P. W., & Hitchcock, J. L., PASP, 78, 79
Hoffman, G. L., Salpeter, E. E., & Carle, N. J. 2001, AJ, 122, 2428
Hunter, D. A., Elmegreen, B. G., & van Woerden, H. 2001, ApJ, 556, 773
Hunter, D. A., Elmegreen, B. G., & Baker, A. L. 1998, ApJ, 493, 595
Hunter, D. A. & Plummer, J. D. 1996, ApJ, 462, 732
Jansen, R. A., Franx, M., Fabricant, D. 2001, ApJ, 551, 825
Jansen, R. A.,Franx, M., Fabricant, D., & Caldwell, N. 2000a, ApJS, 126, 271
Jansen, R. A., Fabricant, D., Franx, M., and Caldwell, N. 2000b, ApJS, 126, 331
Kannappan, S. J., Fabricant, D. G., & Franx, M. 2002, AJ, 123, 2358
Kauffmann, G. et al. 2002, astro-ph
Karachentsev, I. D., Karachentseva, V. E., Kudrya, Y. N., Makarov, D. I., & Parnovsky, S. L. 2000, Bull. Spec. Astrophys. Obs. 50, 5
Kennicutt, R. C. 1998, ARA&A, 36, 189
Kennicutt, R. C. 1989, ApJ, 344, 685
Kim, S., Staveley-Smith, L, Dopita, M., Freeman, K. C., Sault, R. J., Kesteven, M., & McConnell, D. 1998, ApJ, 503, 674
Klessen, R. S., Heitsch, F., & Mac Low, M.-M. 2000, ApJ, 535, 887
Köppen, J. & Edmunds, M. G. 1999, MNRAS, 306, 317
Kravtsov, A. V. 2003, ApJ, 590, L1
Kregel, M., van der Kruit, P. C., & de Grijs, R. 2002, MNRAS, 334, 646
Kroupa, P. 2002, MNRAS, 330, 707
Kuchinski, L. E., Terndrup, D. M., Gordon, K. D., Witt, A. N. 1998, AJ115, 1438
Kudrya, Y. N., Karachentsev, I. D., Karachentseva, V. E., & Parnovskii, S. L. 1994, Astronomy Letters, 20, 8
Larson, R. B. 1981, MNRAS, 194, 809
Lisenfeld, U. & Ferrara, A. 1998, ApJ, 496, 145
Mac Low, M.-M., & McCray, R. 1988, ApJ, 324, 776
Mac Low, M.-M., & Klessen, R. S. 2003, astro-ph/0301093
Malhotra, S. 1994, ApJ, 433, 687
Martin, C. L., & Kennicutt, R. C. Jr. 2001, ApJ, 555, 301
Matthews, L. D., & Wood, K. 2001, ApJ548, 150
Matthewson, D. S., Ford, V. L., Buchhorn, M. 1992, ApJS, 81, 413
Mayer, L., Governato, F., Colpi, M., Moore, B., Quinn, T., Wadsley, J., Stadel, J., & Lake, G. 2001, ApJ, 559, 754
McGaugh, S. S. & de Blok, W. J. G. 1997, ApJ, 481, 689
Misiriotis, A., & Bianchi, S. 2002, A&A, 384, 866
Ossenkopf, V., & Mac Low, M.-M. 2002, A&A, 390, 307
Pandey, U. S. & van de Bruck, C. 1999, MNRAS, 306, 181
Persic, M., Salucci, P, & Stel, F. 1996, MNRAS, 281, 27
Petric, A. & Rupen, M. P. 2001, ASP Conf. Ser. 240: Gas and Galaxy Evolution, 288
Pfenniger, D. 1993, in Galactic Bulges, IAU Symposium 153, ed. H. Dejonghe & H. J. Habing, p. 387
Pierini, D. 1999, A&A, 352, 49
Rafikov, R. R. 2001, MNRAS, 323, 445
Rand, R. J., Lord, S. D., & Higdon, J. L. 1999, ApJ, 513, 720
Rand, R. J. 1995, AJ, 109, 2444
Regan, M. W., Thornley, M. D., Helfer, T. T., Sheth, K., Wong, T., Vogel, S. N., Blitz, L., & Bock, D. C.-J. 2001, ApJ, 561, 218
Rownd, B. K., & Young, J. S. 1999, AJ, 118, 670
Sánchez-Salcedo, F. J. 2001, ApJ, 563, 867
Sellwood, J. A. & Balbus, S. A. 1999, ApJ, 511, 660
Stasińska, G., & Sodré, L. Jr. 2001, A&A, 374, 919
Staveley-Smith, L., Davies, R. D., & Kinman, T. D. 1992, MNRAS, 258, 334
Stil, J. M., & Israel, F. P. 1998, preprint (astro-ph/9810151)
Stoughton, C. et al. 2002, AJ, 123, 485
Sung, E., Han, C., Ryden, B. S., Patterson, R. J., Chun, M., Kim, H., Lee, W., & Kim, D. 1998, ApJ, 505, 199
Swaters, R. A., van Albada, T. S., van der Hulst, J. M., & Sancisi, R. 2002, A&A, in press.
Tinsley, B. M. 1980, Fundamentals of Cosmic Physics, 5, 287
Tully, R. B. 1988, “Nearby Galaxies Catalog”, Cambridge and New York, Cambridge University Press
van den Bergh, S. & Pierce, M. J. 1990, ApJ, 364, 444
van den Bergh, S. 1988, PASP, 100, 344
van der Kruit, P. C., & de Grijs, R. 1999, A&A, 352, 129
van der Kruit, P. C. & Searle, L. 1981, A&A, 95, 105
van der Kruit, P. C., Jiménez-Vicente, J., Kregel, M., & Freeman, K. C. 2001, A&A, 379, 374
van Zee, L., Haynes, M. P., Salzer, J. J., & Broeils, A. H. 1996, AJ, 112, 129
van Zee, L., Haynes, M. P., Salzer, J. J., & Broeils, A. H. 1997, AJ, 113, 1618
van Zee, L., Salzer, J. J., Haynes, M. P., O’Donoghue, A. A., & Balonek, T. J. 1998, AJ, 116, 2805
Vázquez-Semadeni, E., Ballesteros-Paredes, J., & Klessen, R. S. 2003, ApJ, 585, L131
Vázquez-Semadeni, E. 1999, ASSL Vol. 241: Millimeter-Wave Astronomy: Molecular Chemistry & Physics in Space., 161
Vogel, S. N., Kulkarnit, S. R., & Scoville, N. Z, 1988, Nature, 344, 402
Wada, K., Meurer, G., & Norman, C. A. 2002, ApJ, 577, 197
Wang, Z. 1990, ApJ, 360, 529
Wang, B. & Silk, J. 1994, ApJ, 427, 759
Weingartner, J. C. & Draine, B. T. 2001, ApJ, 553, 581
Xilouris, E. M., Byun, Y., Kylafis, N. D., Paleologou, E. V., Papamastorakis, J. 1999, A&A344, 868
Yoachim, P. & Dalcanton, J. J. 2004, to be submitted to A.J.
York, D., et al. 2000, AJ, 120, 1579
Young, L. M., & Lo, K. Y. 1997, ApJ, 490, 710
Young, J. S., Xie, S., Tacconi, L., Knezek, P., Viscuso, P., Tacconi-Garman, L., Scoville, N., Schneider, S., Schloerb, F. P., Lord, S., Lesser, A., Kenney, J., Huang, Y.-L., Devereux, N., Claussen, M., Case, J., Carpenter, J., Berry, M., & Allen, L. 1995, ApJS, 98, 219
Zaritsky, D., Kennicutt, R. C., Jr., & Huchra, J. P. 1994, ApJ420, 87
Zaritsky, D., Harris, J., Thompson, I. B., Grebel, E. K., & Massey, P. 2002, AJ, 123, 855
Zaritsky, D. 1999, AJ, 118, 2824